. 2020 Jun 30;117(26):14636-14641.
doi: 10.1073/pnas.1922730117. Epub 2020 Jun 15.

Probing and manipulating embryogenesis via nanoscale thermometry and temperature control

Affiliations

Probing and manipulating embryogenesis via nanoscale thermometry and temperature control

Joonhee Choi et al. Proc Natl Acad Sci U S A. .

Abstract

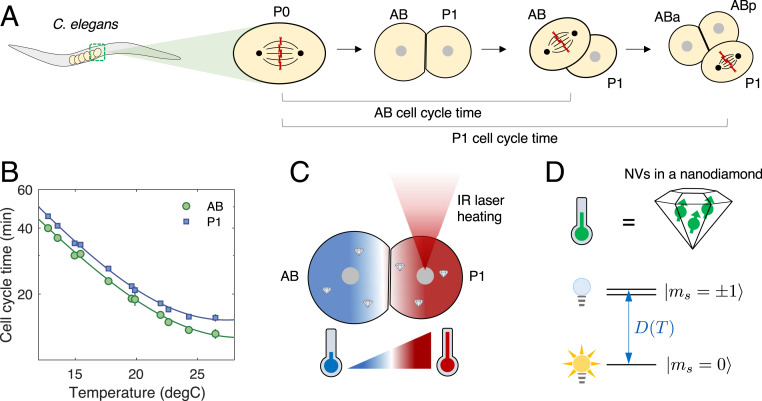
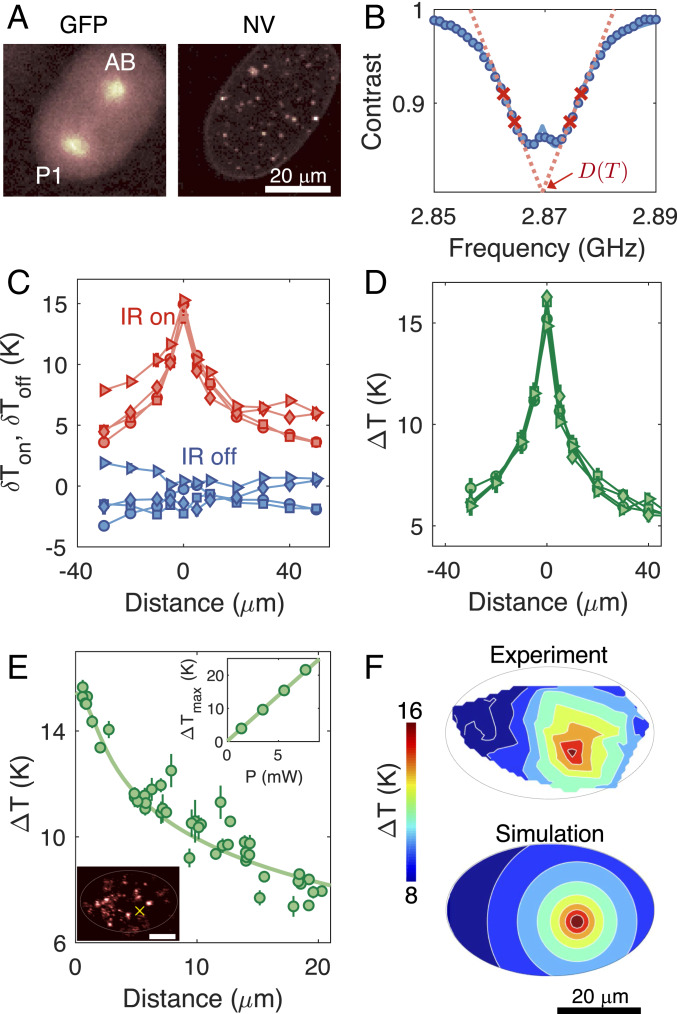
Understanding the coordination of cell-division timing is one of the outstanding questions in the field of developmental biology. One active control parameter of the cell-cycle duration is temperature, as it can accelerate or decelerate the rate of biochemical reactions. However, controlled experiments at the cellular scale are challenging, due to the limited availability of biocompatible temperature sensors, as well as the lack of practical methods to systematically control local temperatures and cellular dynamics. Here, we demonstrate a method to probe and control the cell-division timing in Caenorhabditis elegans embryos using a combination of local laser heating and nanoscale thermometry. Local infrared laser illumination produces a temperature gradient across the embryo, which is precisely measured by in vivo nanoscale thermometry using quantum defects in nanodiamonds. These techniques enable selective, controlled acceleration of the cell divisions, even enabling an inversion of division order at the two-cell stage. Our data suggest that the cell-cycle timing asynchrony of the early embryonic development in C. elegans is determined independently by individual cells rather than via cell-to-cell communication. Our method can be used to control the development of multicellular organisms and to provide insights into the regulation of cell-division timings as a consequence of local perturbations.

Keywords: cell-cycle control; cell-division asymmetry; nanoscale thermometry; nitrogen-vacancy centers; quantum sensing.


Conflict of interest statement

The authors declare no competing interest.

Figures

Fig. 1.
Fig. 1.
Studying embryogenesis of C. elegans via nanoscale NV thermometry. (A) Early embryonic development of C. elegans. At the end of the one-cell stage, the chromosomes (red crosses) align at the center of the single cell P0 and are then split and pulled apart by spindle fibers (thin black arcs), resulting in two daughter cells, AB and P1. The two daughter cells exhibit asynchronous division, in which AB undergoes mitosis earlier than P1. The cell-cycle time of a given cell is defined as the separation between chromosome-splitting events of its parent cell and itself. (B) Cell-cycle times for AB and P1 as a function of global ambient temperature. Solid lines are fits to a modified Arrhenius equation (Eq. 1). (C) Local laser heating applied to a two-cell-stage embryo. A focused IR laser selectively illuminating P1 introduces a steep temperature gradient across the embryo (red, hot; blue, cold). Nanodiamond thermometers are incorporated inside the embryo to measure the resultant temperature distribution. (D) Principle of thermometry. The in vivo thermometer consists of an ensemble of NV centers (green arrows) in a nanodiamond. The NV center has three electronic spin states in its orbital ground state, ms=0,±1, which are energetically separated by a temperature-dependent, zero-field splitting D(T). The nearly degenerate ±1 states are optically dark, while the 0 state is optically bright.
Fig. 2.
Fig. 2.
Local laser heating characterization. (A) Confocal images of the GFP-labeled embryo in the two-cell stage with GFP imaging (Left) and NV-nanodiamond fluorescence imaging (Right). (B) Optically detected magnetic resonance of an NV thermometer. Contrast is defined as the fluorescence ratio of the thermometer with and without the application of microwaves. In temperature measurements, the resonance curve is sampled at four optimized frequencies (red crosses) to extract the resonance position D(T) at a given local temperature T (18). (C) In vivo temperature readout from an NV thermometer inside an embryo while sweeping the position of an IR laser relative to the thermometer. The IR laser at a fixed power of 5.7 mW is modulated on and off with a period of 30 s over the course of scanning. Each data point is averaged over 3 min, yielding a temperature uncertainty of ±0.27 K. The different symbols correspond to different iterative runs. The temperature distribution curves fluctuate due to temporal variations in thermometer calibration parameters. (D) Differential temperature readout of ΔT=δTonδToff, where δTon, off are temperatures measured with the IR laser on and off. Such differential readouts reject common-mode noise, leading to different curves collapsing on top of each other and exhibiting robustness to experimental fluctuations. (E) In vivo temperature distribution measured by a collection of NV thermometers inside an embryo. Filled circles denote measured temperatures; the solid line denotes the simulated temperature profile (SI Appendix, Fig. S6). E, Lower Inset shows an image of the laser-illuminated embryo, and the yellow cross indicates the position of the IR heating laser. The bright spots in the image correspond to individual NV thermometers. (Scale bar: 20 μm.) E, Upper Inset shows a linear scaling of the maximum temperature increase ΔTmax, as a function of the laser power P. (F) The 2D temperature map of the laser-illuminated embryo, with comparisons between experiments (Upper) and simulations (Lower).
Fig. 3.
Fig. 3.
Selective acceleration of cell-cycle times and its correlation with local temperature changes. Cell-cycle times of a two-cell embryo subject to local heating as a function of laser power. (A) P1 nucleus heating (at least five measurements each). (B) AB nucleus heating (at least three measurements each). Solid and dashed lines are theoretical predictions based on average and nuclei temperatures of individual cells, respectively; see main text for details. The base temperature is maintained at 12.3 C. The error bars on the data markers denote the SD of the mean cell-cycle times. The bands on the theory predictions provide cell-cycle time uncertainties due to a ±10% uncertainty in extracted cell volumes.
Fig. 4.
Fig. 4.
Observation of cell-cycle inversion. (A) Observation of inversion in cell-division order for a two-cell embryo. P1 is selectively heated with the IR laser at a power of 4.5 mW. The base temperature is held at 12.3C. (B) GFP image of the cell-cycle inversion. (C) Cell-cycle time difference between the AB and P1 cells as a function of IR power. The top x axis shows the difference in the local, average temperature increases between the two cells. Above 3-mW IR laser power, the cell-division order in the two-cell embryo is inverted as a result of local laser heating. (D) Cell-cycle durations monitored for the four-cell stage (ABa, ABp, EMS, and P2) after cell-cycle inversion between AB and P1 (see SI Appendix, Fig. S9 for later cell stages). The IR heating laser is turned off once the P1 cell division is completed. The bar plot shows fractional changes in their respective cell-cycle times comparing between with and without local heating. The error bars denote the SD of the mean values.

References

    1. Gönczy P., Rose L. S., Asymmetric cell division and axis formation in the embryo, Wormbook 15, 1–20 (2014). - PMC - PubMed
    1. Gönczy P., Mechanisms of asymmetric cell division: Flies and worms pave the way. Nat. Rev. Mol. Cell Biol. 9, 355–366 (2008). - PubMed
    1. Budirahardja Y., Gönczy P., PLK-1 asymmetry contributes to asynchronous cell division of C. elegans embryos. Development 135, 1303–1313 (2008). - PubMed
    1. Tavernier N., Labbé J., Pintard L., Cell cycle timing regulation during asynchronous divisions of the early C. elegans embryo. Exp. Cell Res. 337, 243–248 (2015). - PubMed
    1. Brauchle M., Baumer K., Gönczy P., Differential activation of the DNA replication checkpoint contributes to asynchrony of cell division in C. elegans embryos. Curr. Biol. 13, 819–827 (2003). - PubMed

Publication types

MeSH terms

LinkOut - more resources