. 2020 Nov;161(11):2551-2570.
doi: 10.1097/j.pain.0000000000001955.

A modulator of the low-voltage-activated T-type calcium channel that reverses HIV glycoprotein 120-, paclitaxel-, and spinal nerve ligation-induced peripheral neuropathies

Affiliations

A modulator of the low-voltage-activated T-type calcium channel that reverses HIV glycoprotein 120-, paclitaxel-, and spinal nerve ligation-induced peripheral neuropathies

Song Cai et al. Pain. 2020 Nov.

Abstract

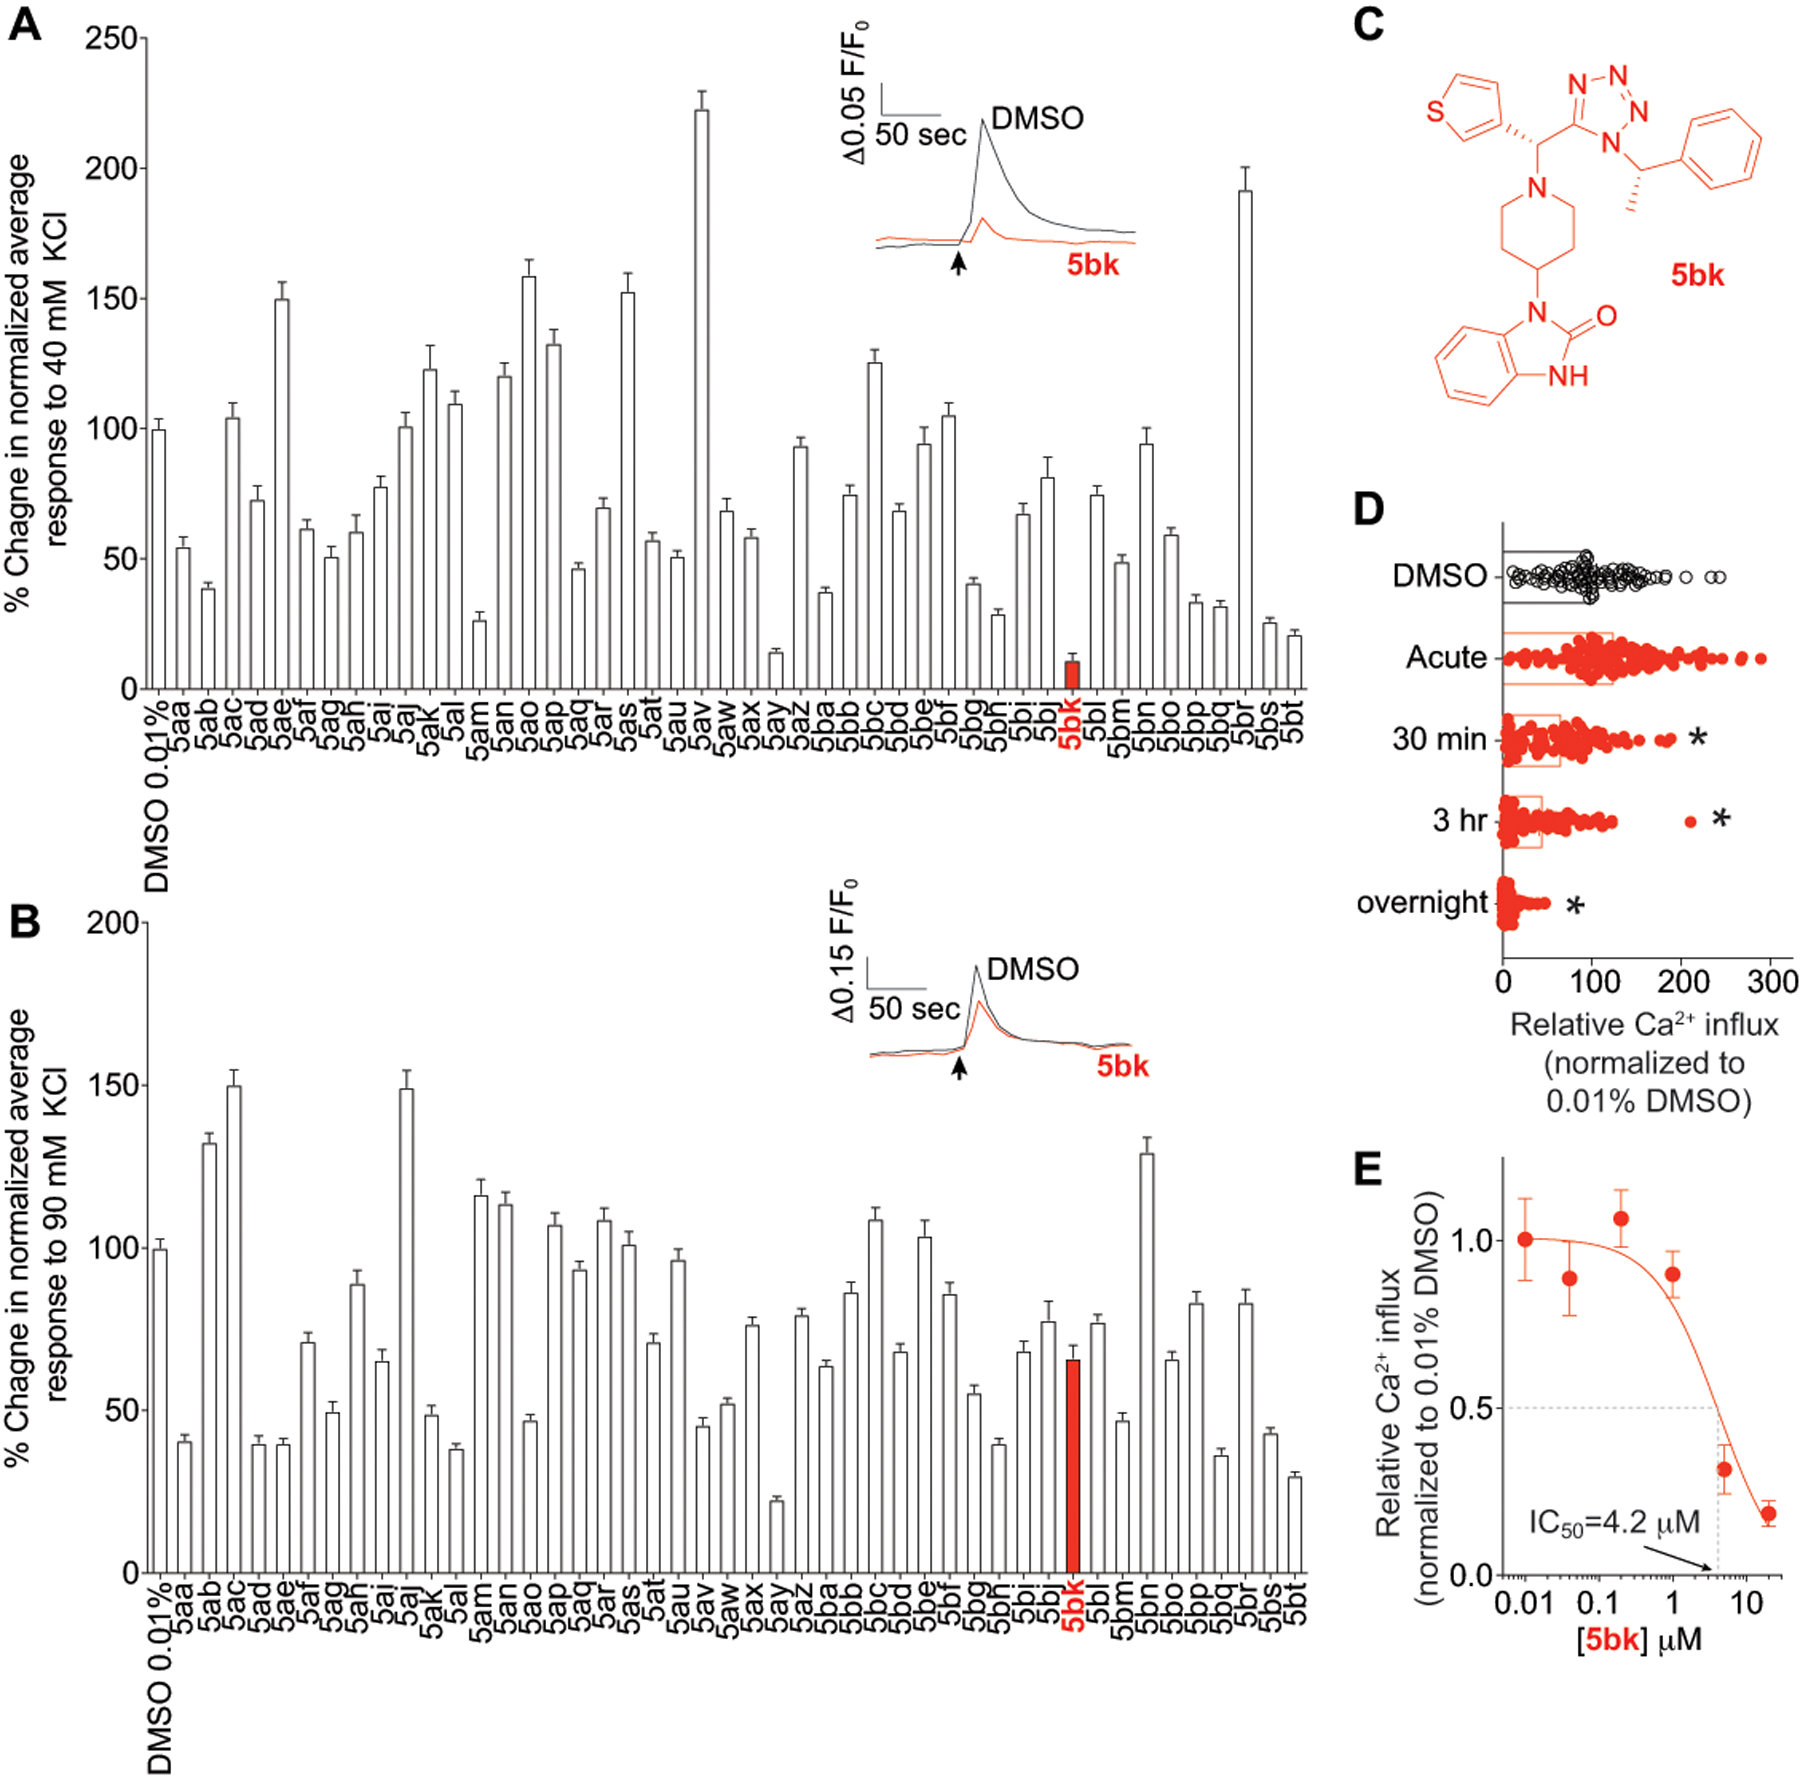
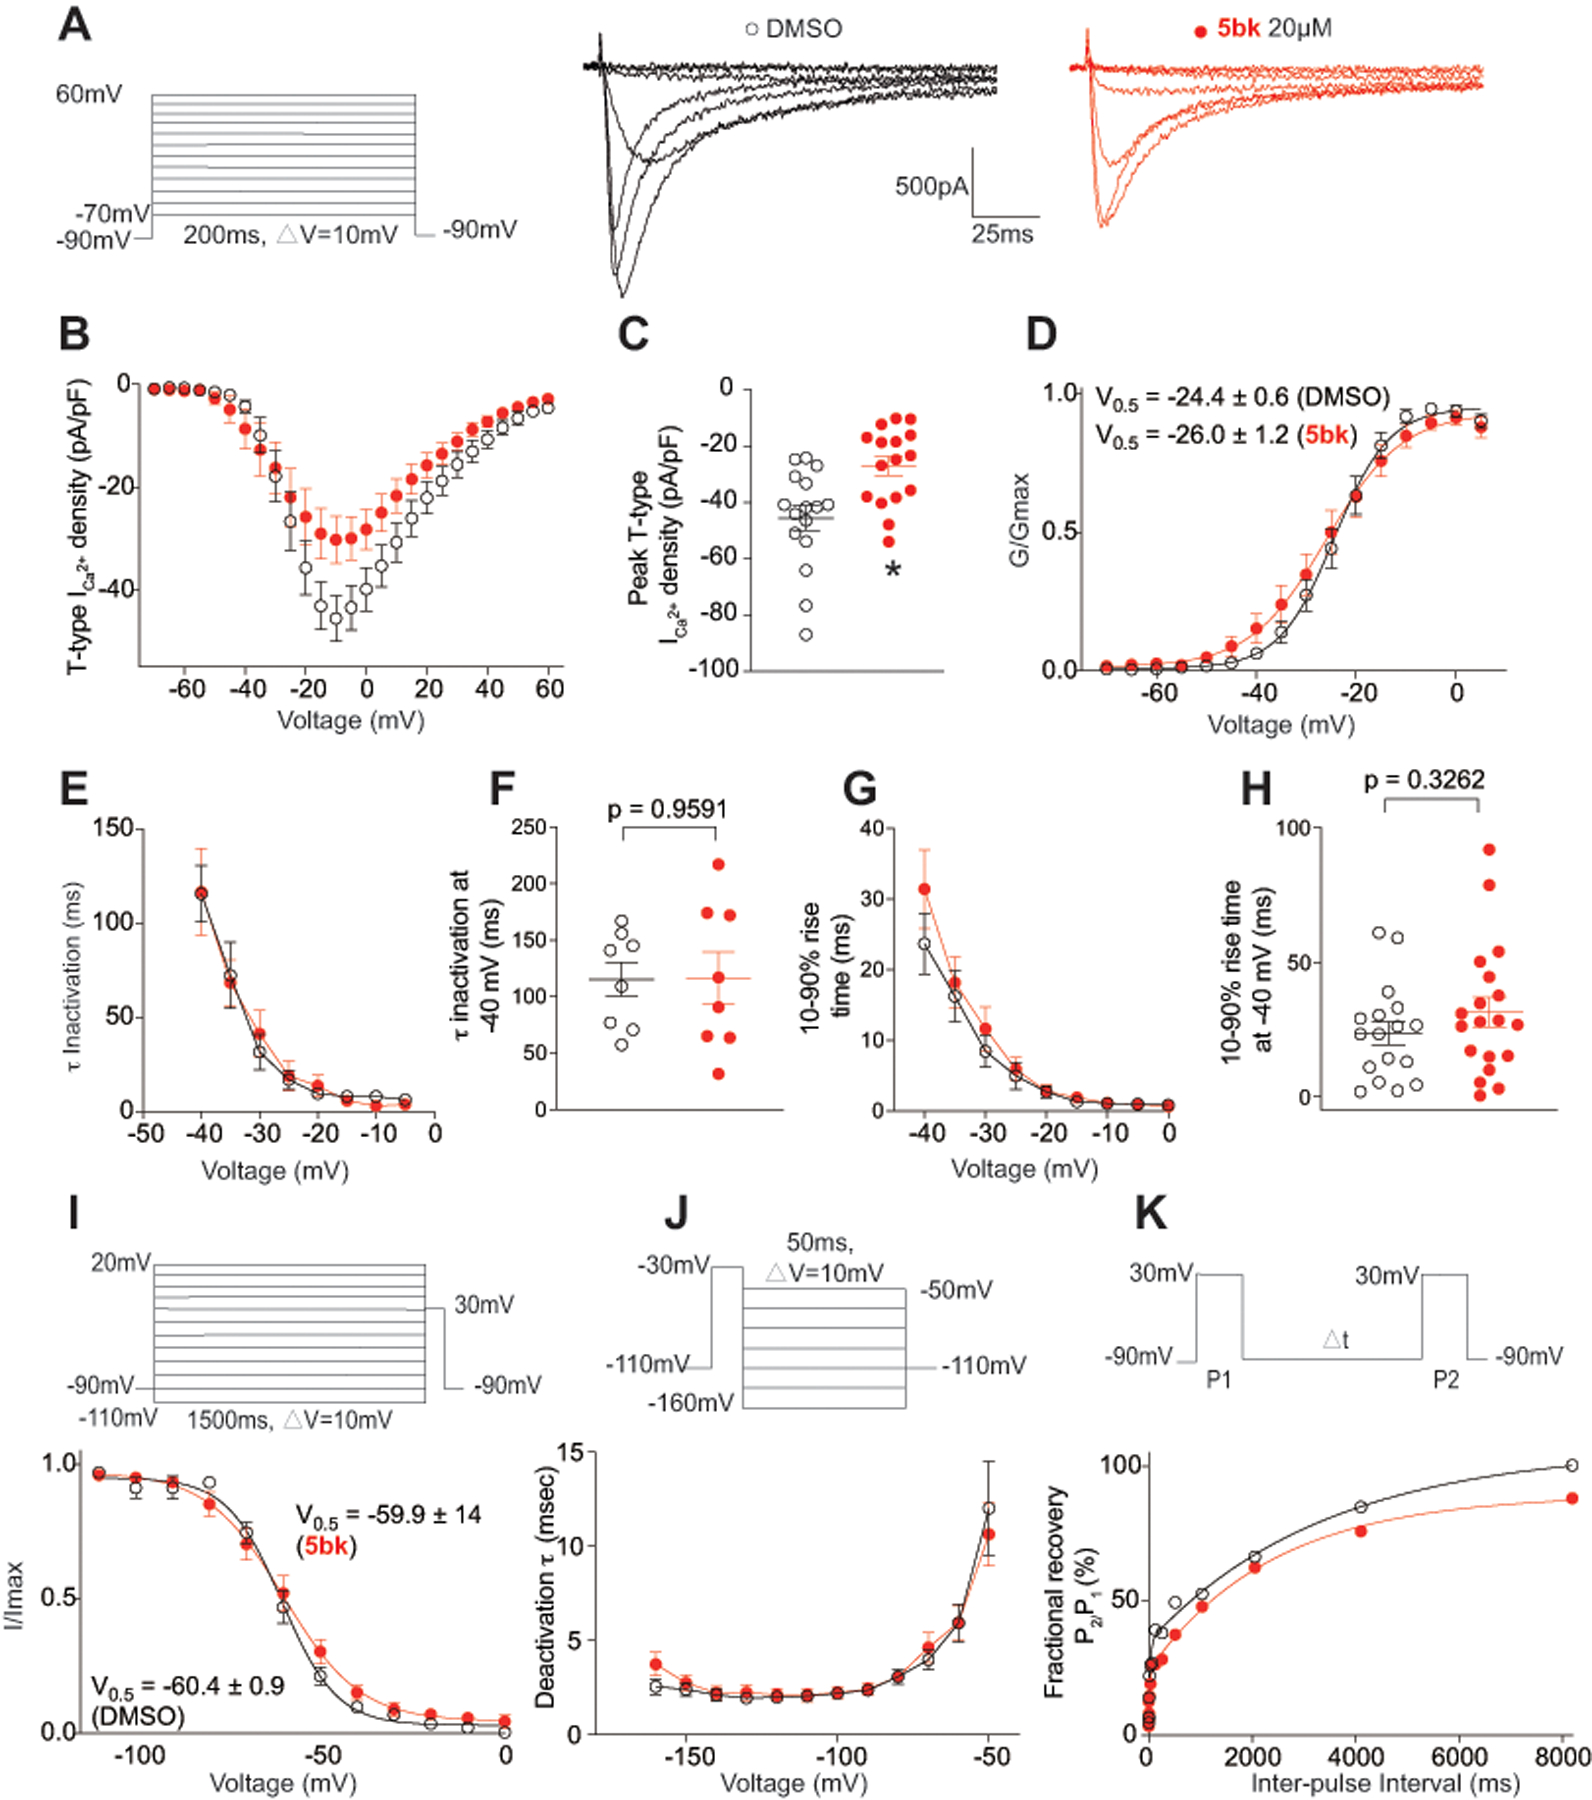
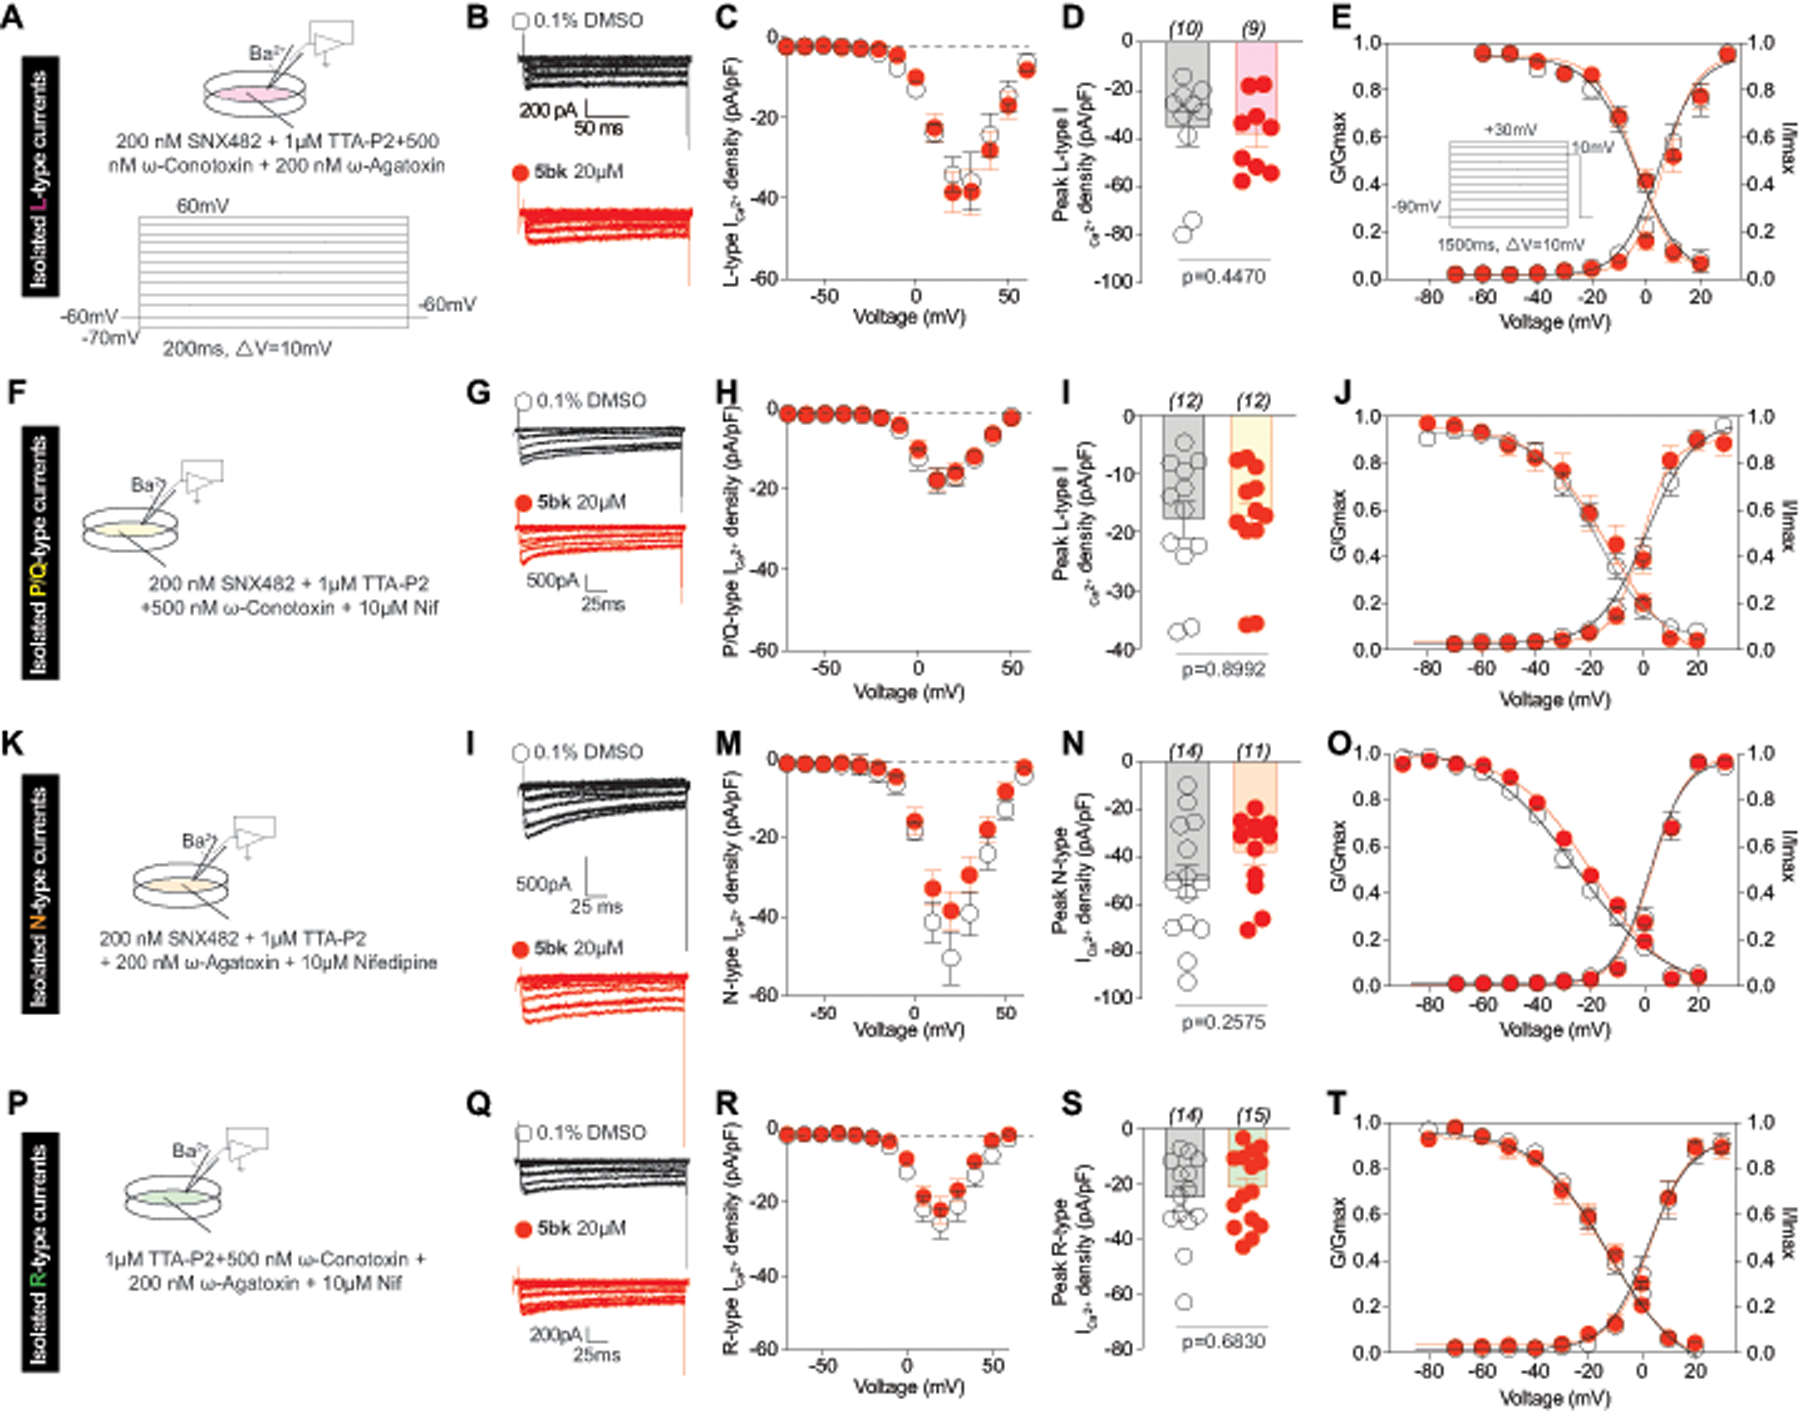
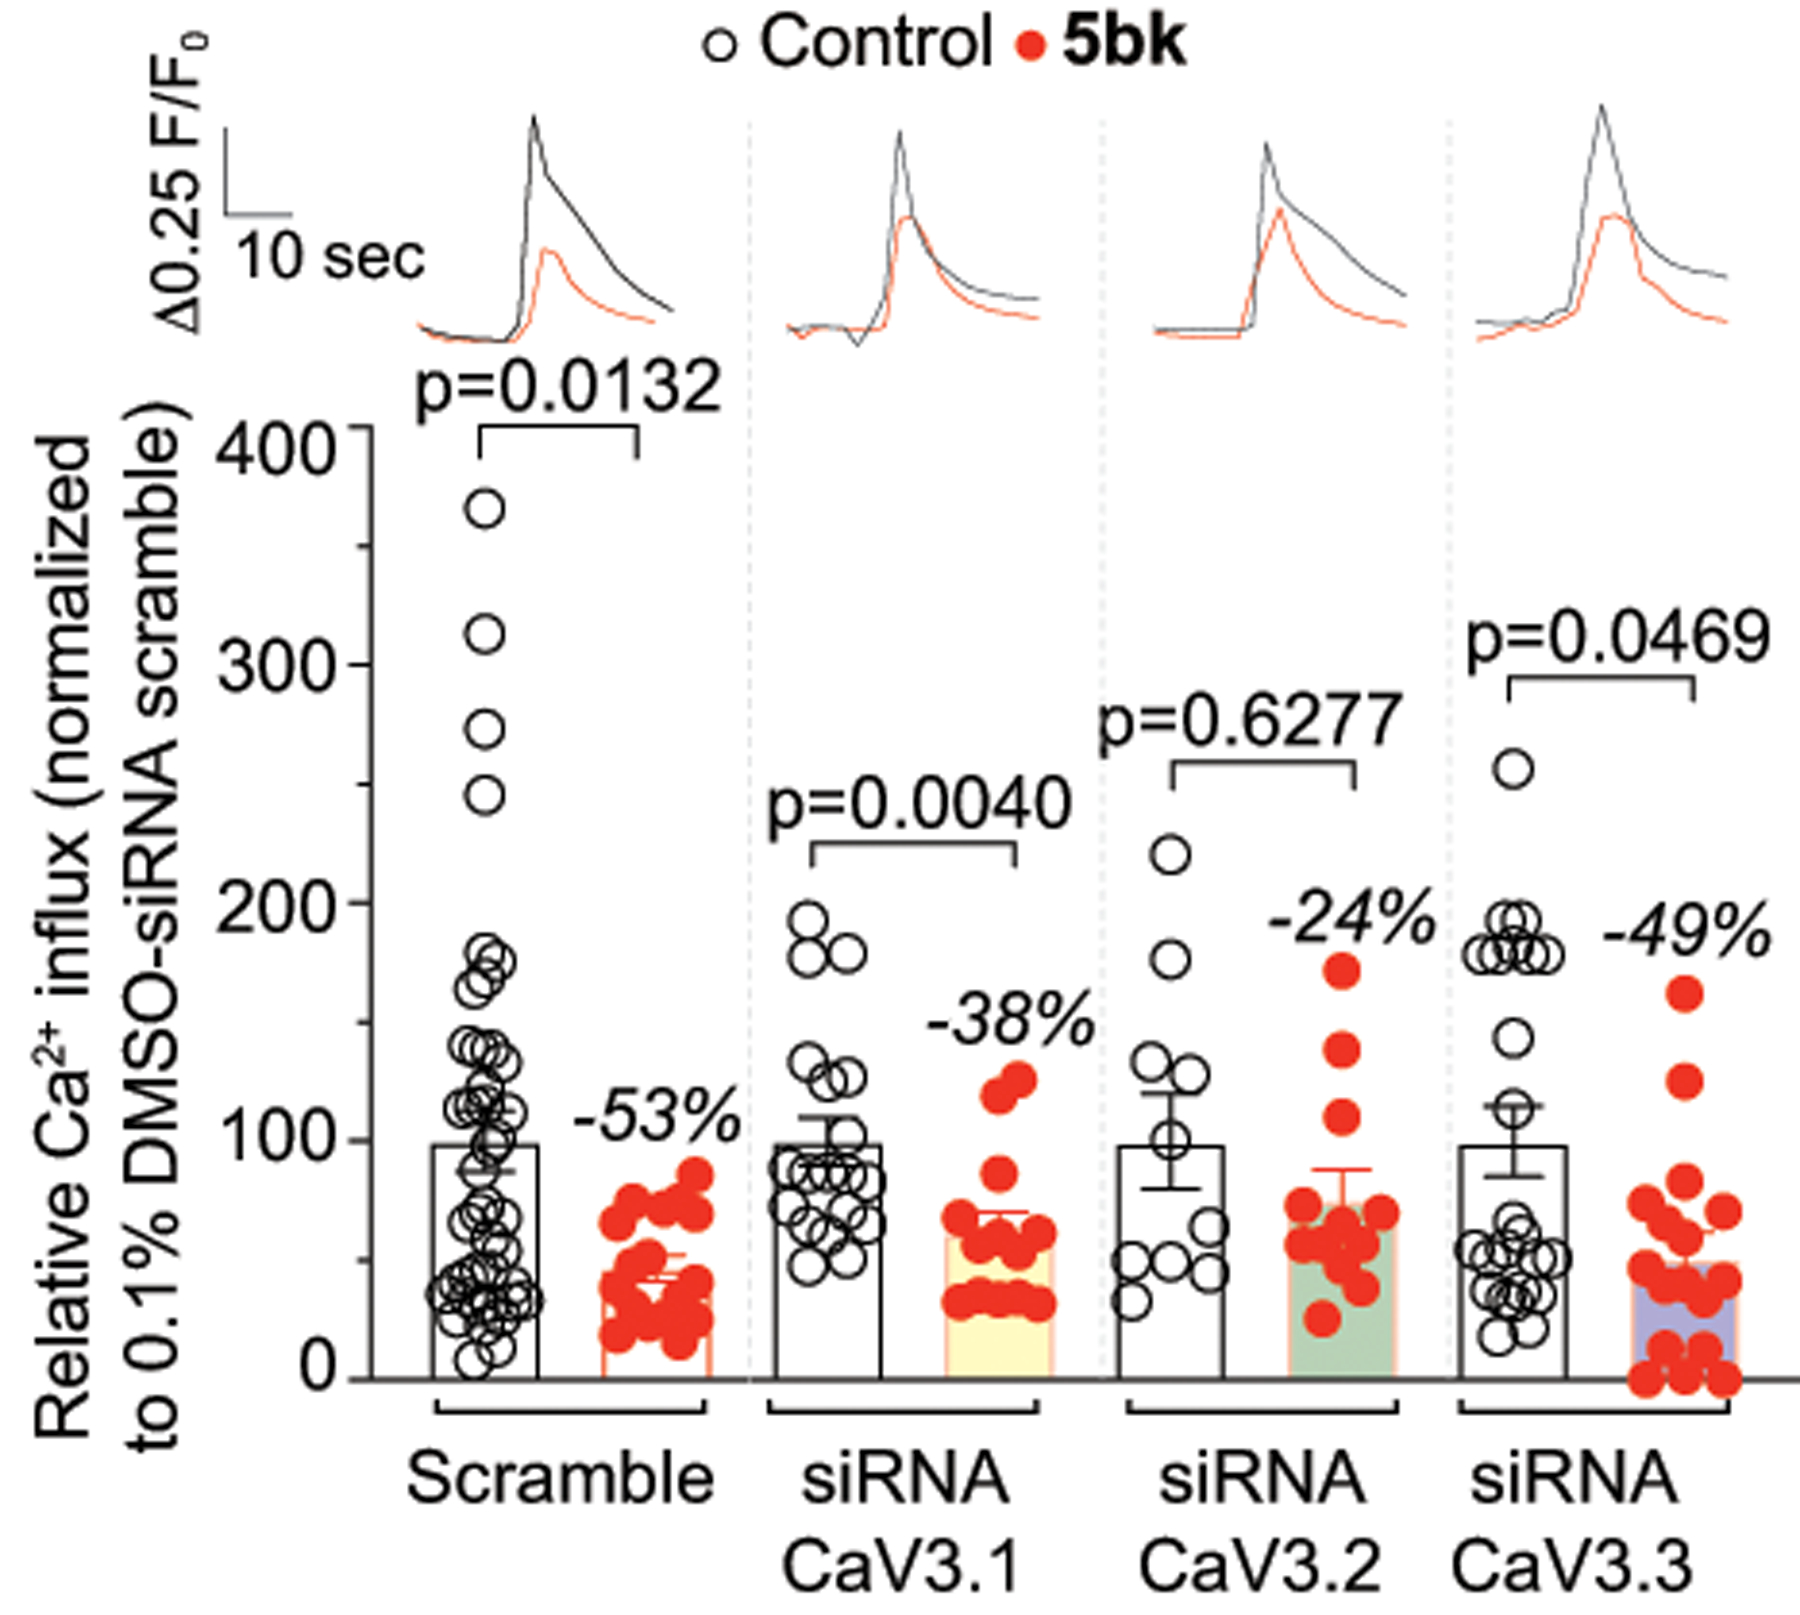
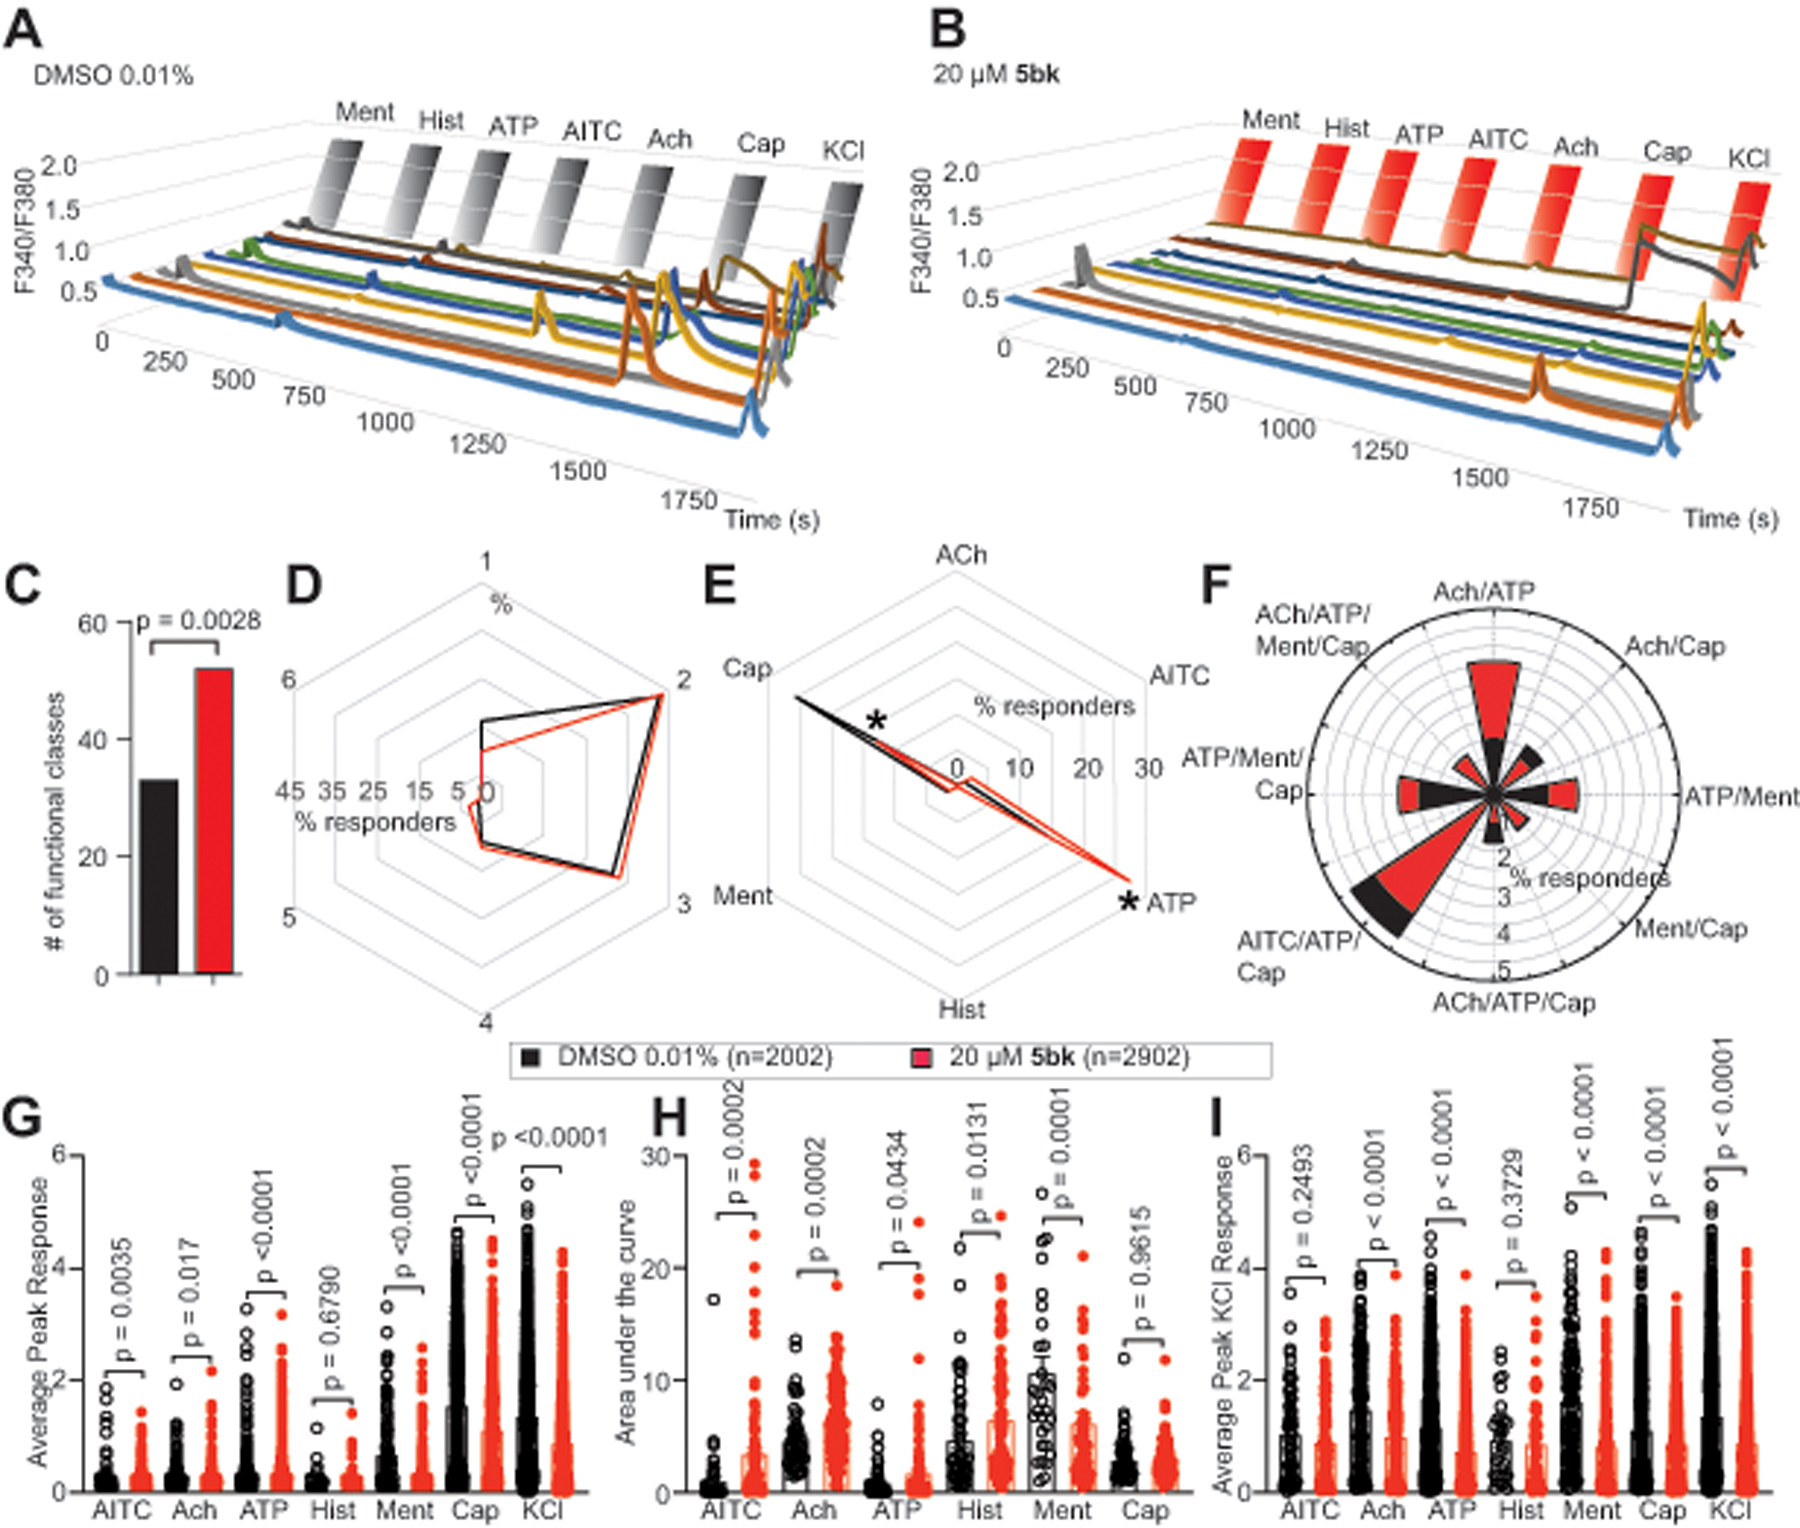
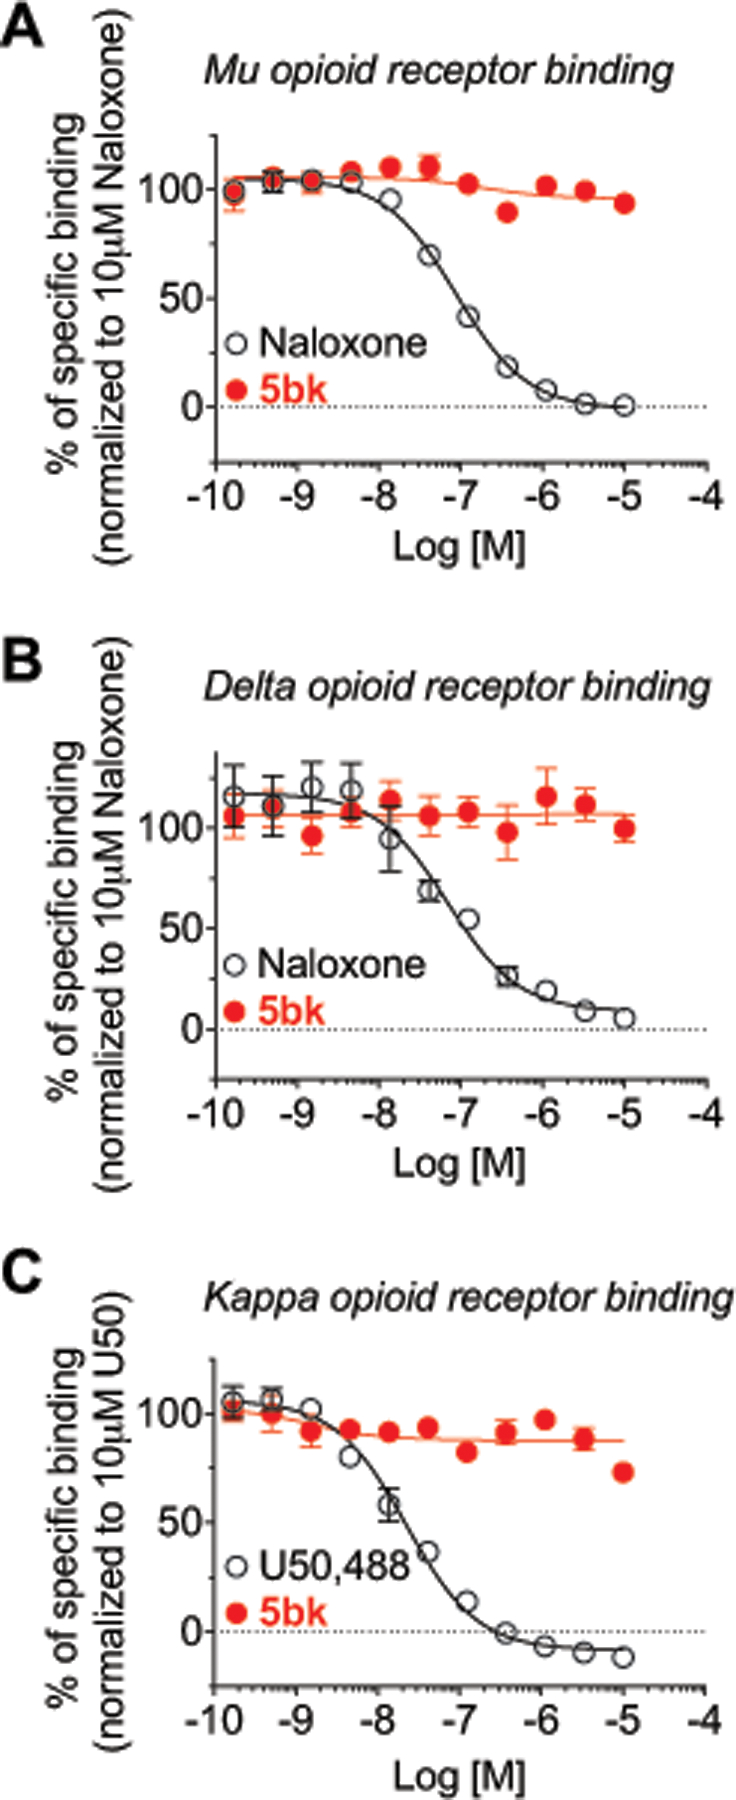
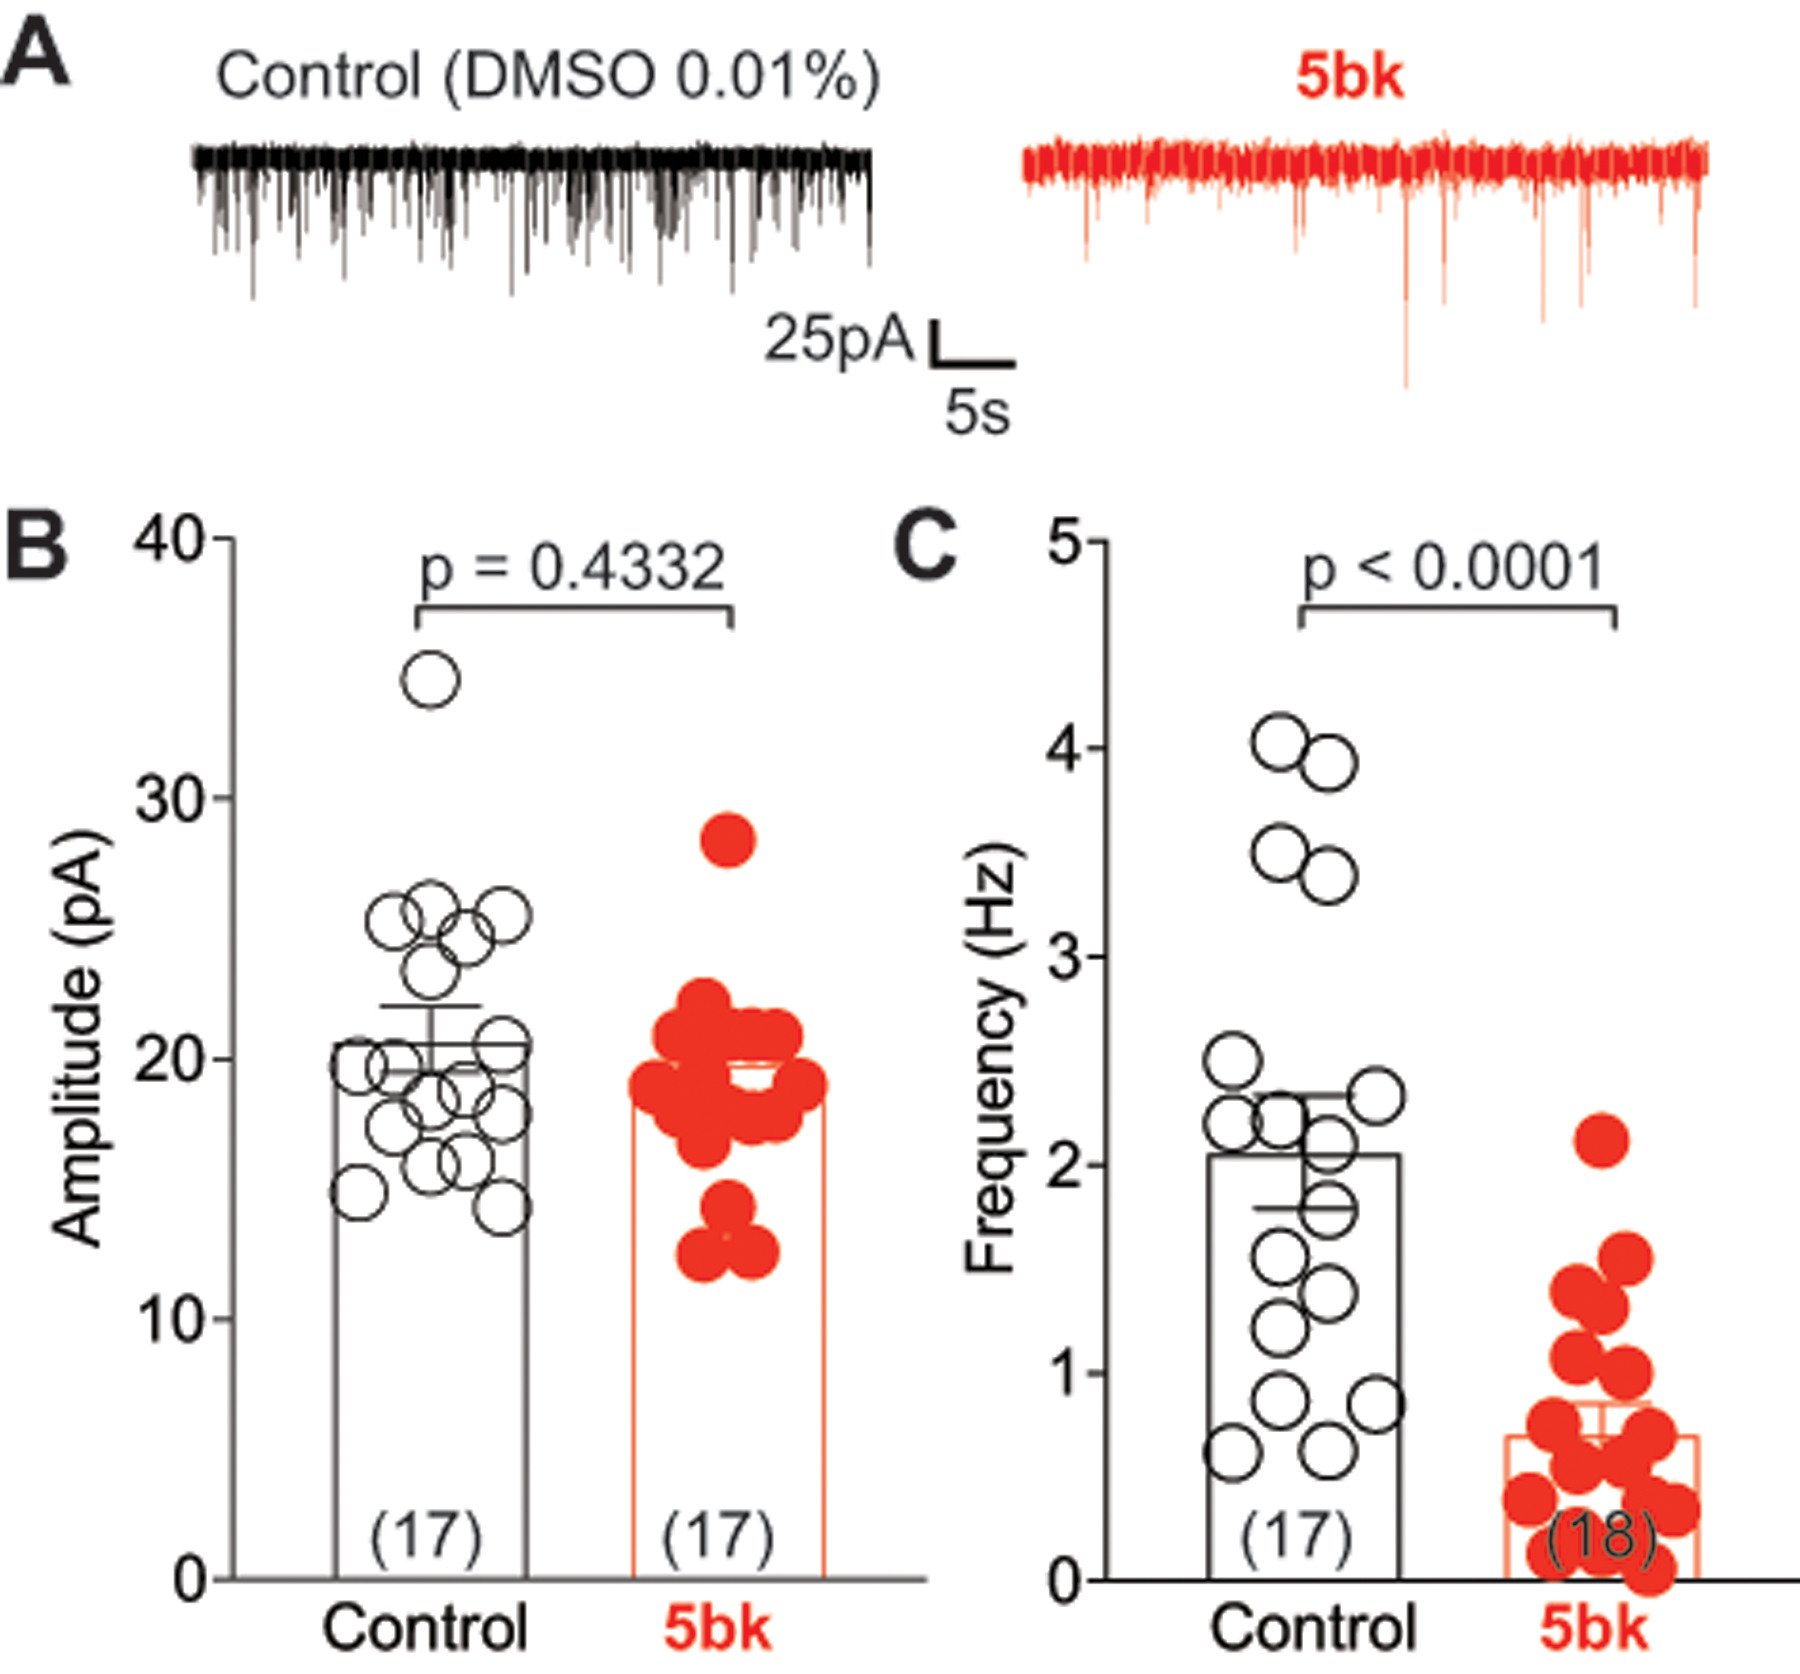
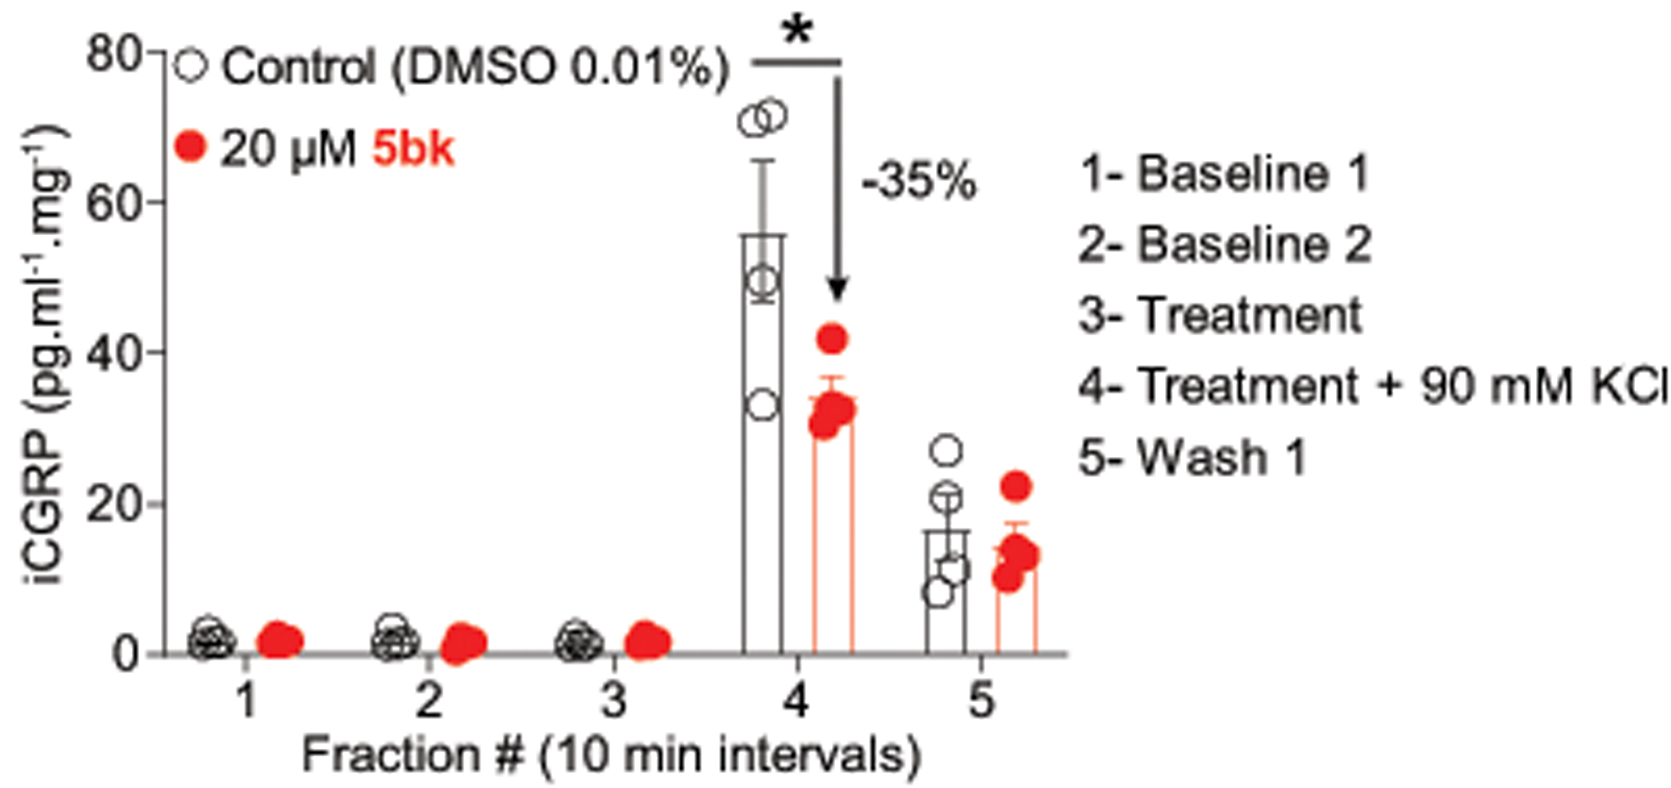
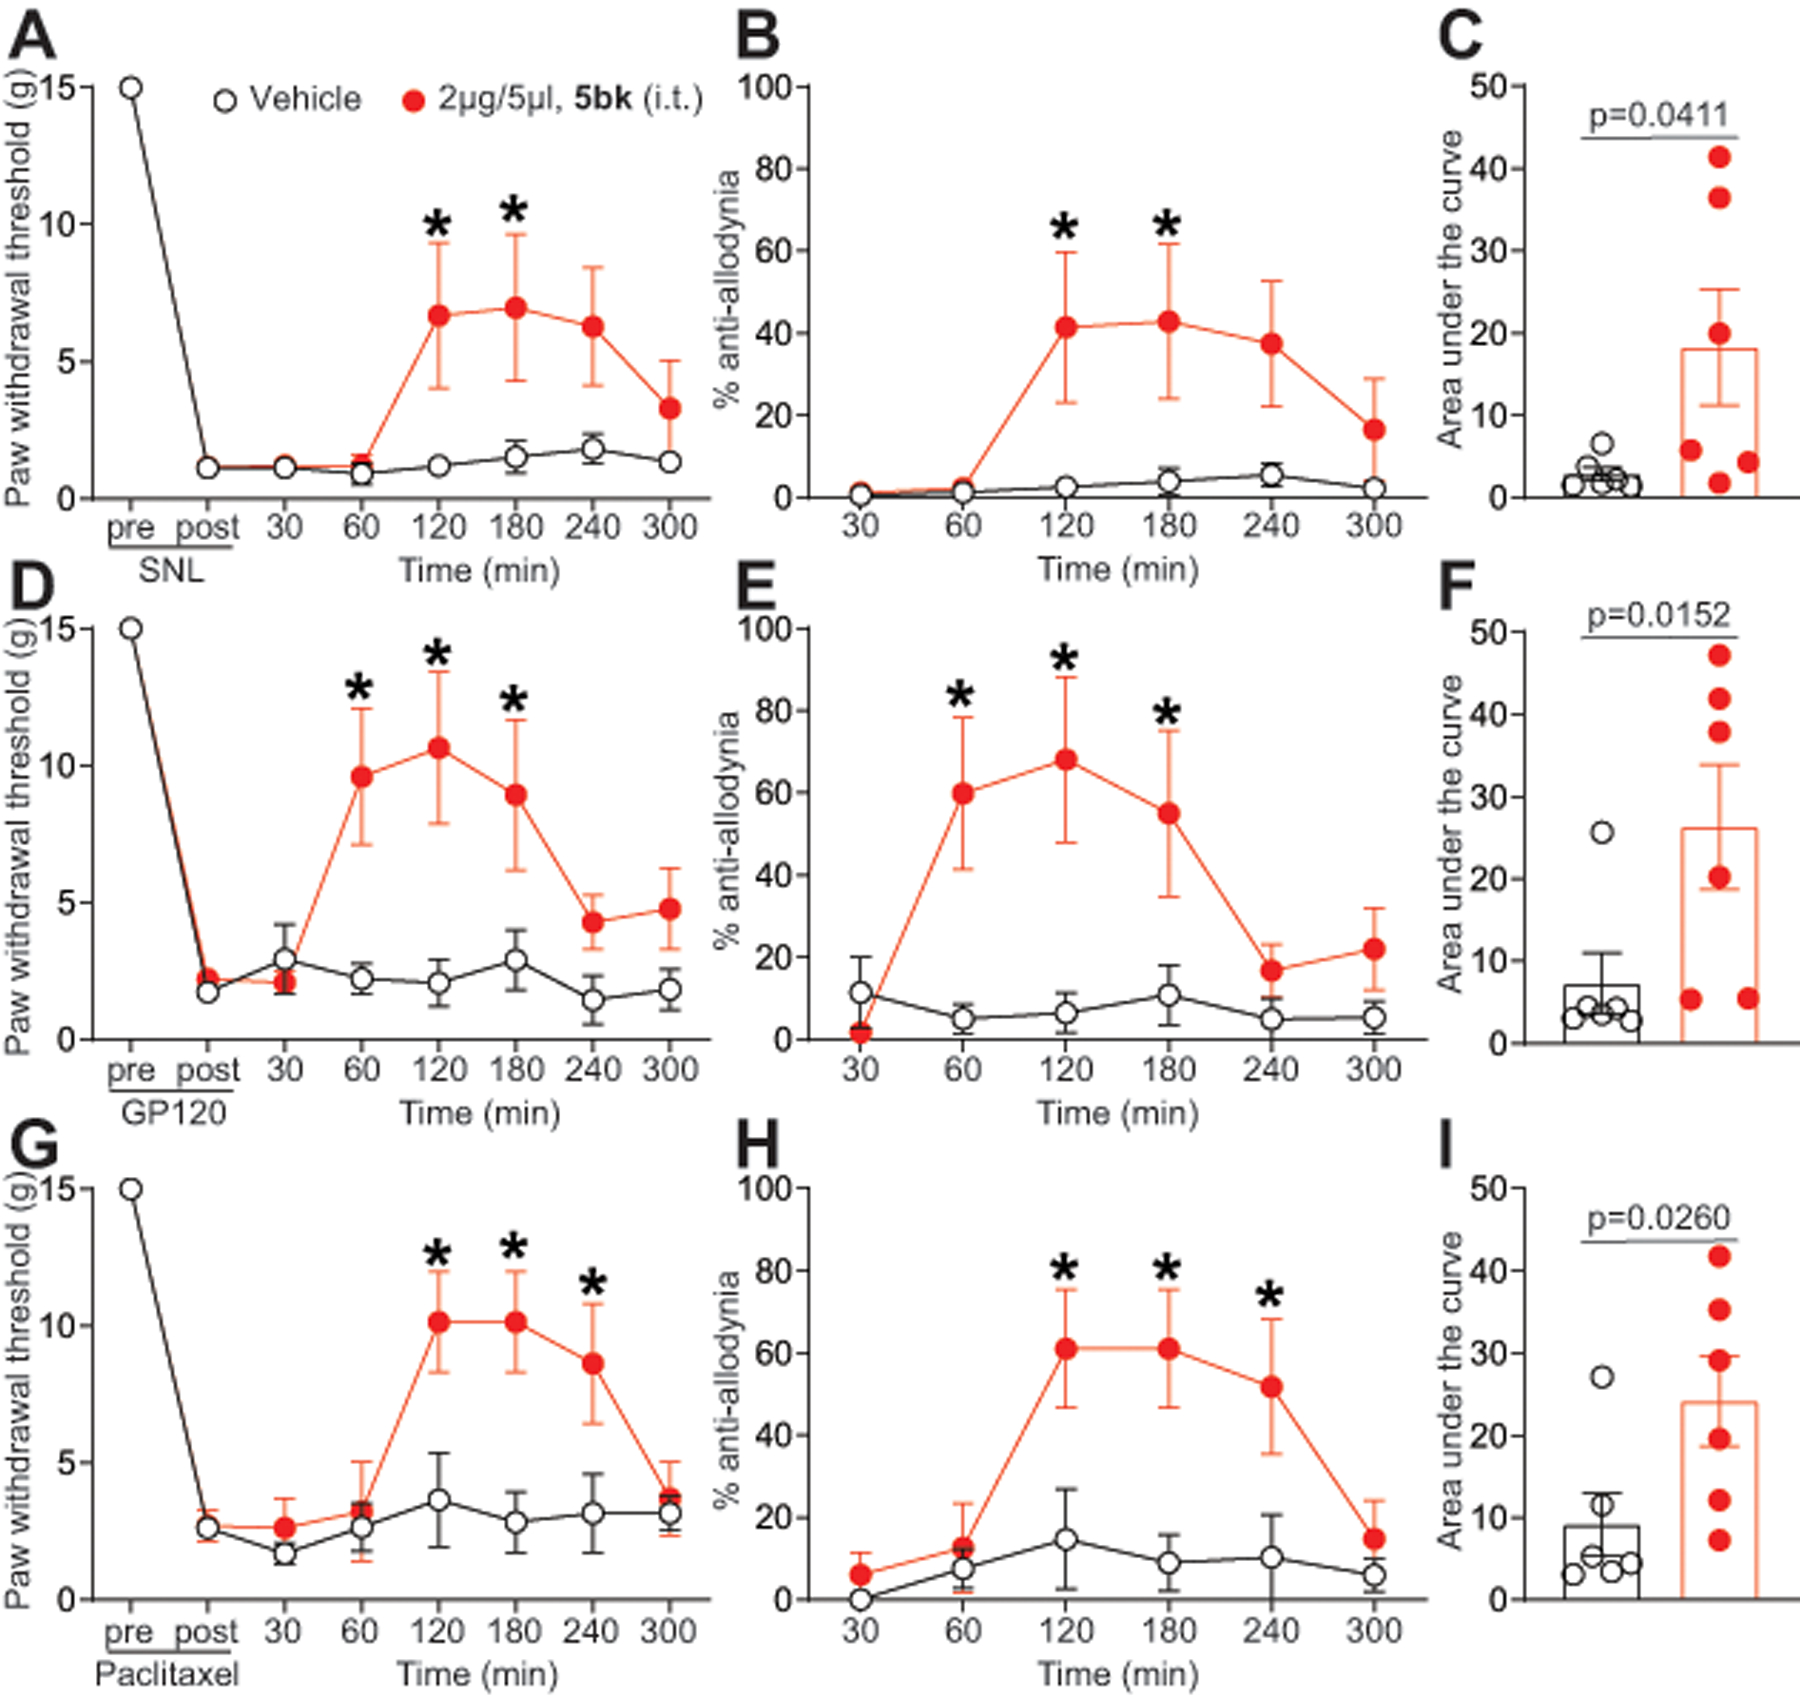
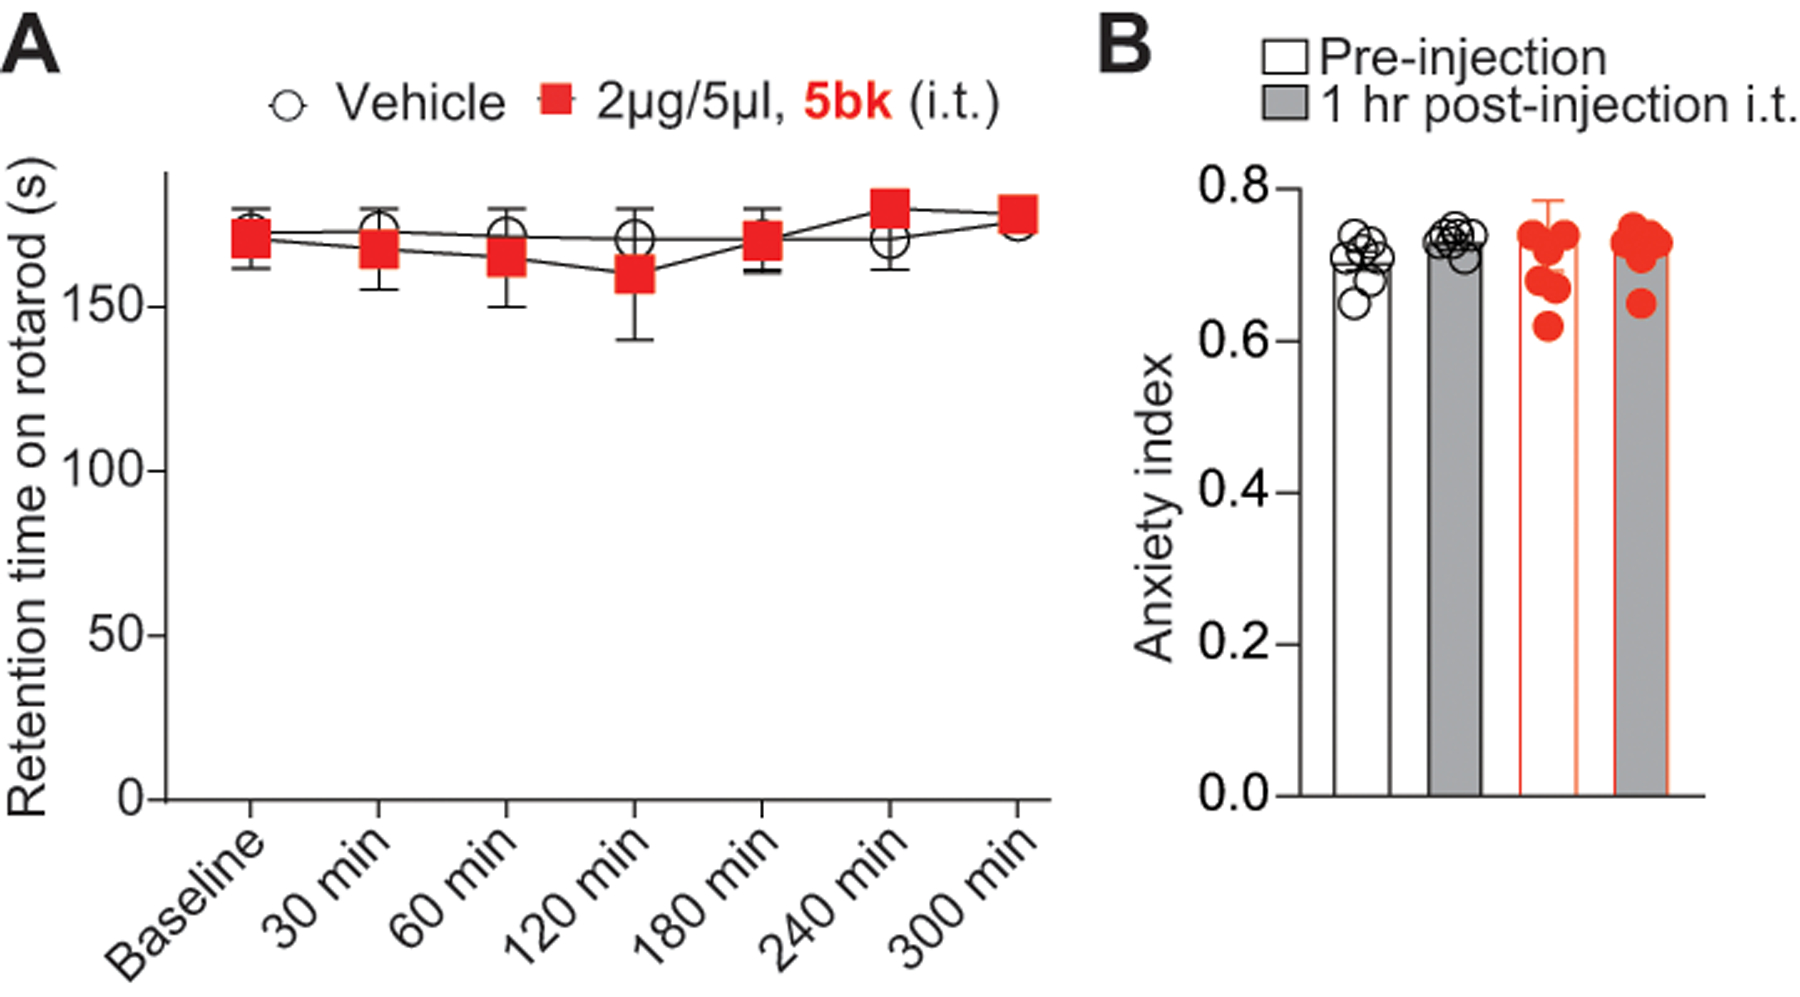
The voltage-gated calcium channels CaV3.1-3.3 constitute the T-type subfamily, whose dysfunctions are associated with epilepsy, psychiatric disorders, and chronic pain. The unique properties of low-voltage-activation, faster inactivation, and slower deactivation of these channels support their role in modulation of cellular excitability and low-threshold firing. Thus, selective T-type calcium channel antagonists are highly sought after. Here, we explored Ugi-azide multicomponent reaction products to identify compounds targeting T-type calcium channel. Of the 46 compounds tested, an analog of benzimidazolonepiperidine-5bk (1-{1-[(R)-{1-[(1S)-1-phenylethyl]-1H-1,2,3,4-tetrazol-5-yl}(thiophen-3-yl)methyl]piperidin-4-yl}-2,3-dihydro-1H-1,3-benzodiazol-2-one) modulated depolarization-induced calcium influx in rat sensory neurons. Modulation of T-type calcium channels by 5bk was further confirmed in whole-cell patch clamp assays in dorsal root ganglion (DRG) neurons, where pharmacological isolation of T-type currents led to a time- and concentration-dependent regulation with a low micromolar IC50. Lack of an acute effect of 5bk argues against a direct action on T-type channels. Genetic knockdown revealed CaV3.2 to be the isoform preferentially modulated by 5bk. High voltage-gated calcium, as well as tetrodotoxin-sensitive and -resistant sodium, channels were unaffected by 5bk. 5bk inhibited spontaneous excitatory postsynaptic currents and depolarization-evoked release of calcitonin gene-related peptide from lumbar spinal cord slices. Notably, 5bk did not bind human mu, delta, or kappa opioid receptors. 5bk reversed mechanical allodynia in rat models of HIV-associated neuropathy, chemotherapy-induced peripheral neuropathy, and spinal nerve ligation-induced neuropathy, without effects on locomotion or anxiety. Thus, 5bk represents a novel T-type modulator that could be used to develop nonaddictive pain therapeutics.


Conflict of interest statement

CONFLICT OF INTERESTS STATEMENT

R. Khanna is the co-founder of Regulonix LLC, a company developing non-opioids drugs for chronic pain. In addition, R. Khanna has patents US10287334 and US10441586 issued to Regulonix LLC. R. Khanna and Jun Wang have filed disclosures on the composition of matter and use of 5bk. The other authors declare no competing financial interest.

Figures

Figure 1.
Figure 1.. Primary screening using depolarization evoked Ca2+ influx in DRG neurons identifies several regulators of low and high voltage-activated calcium channels.
Peak calcium responses of sensory neurons incubated overnight with 20μM of the indicated compounds in response to 40 mM KCl (A) or 90 mM KCl (B) and normalized to 0.01% DMSO-treated control. N >78 neurons per condition from at least 3–4 rats each. Representative time courses of the change in 340 nm/380 nm ratio for the response of 4 representative neurons imaged in a preparation treated with 0.01% DMSO or 5bk. Because an increase in intracellular calcium induces an increase in 340-nm emission and a decrease in 380-nm emission, the simultaneous increase in 340 nm and decrease in 380-nm fluorescence emission associated with application of KCl is indicative an increase in intracellular calcium. KCl was added at the time indicated by the arrow. (C) The structure of 5bk is shown. (D) Scatter bar graph shows peak calcium responses of sensory neurons in response to a 40 mM KCl challenge. Neurons were incubated with vehicle (0.01% DMSO) or a 20μM concentration of 5bk for various period of time as indicated: acutely (less than 5 min), 30 min, 2 hours, or 12–18 hours (overnight). (E) Concentration response curve for 5bk inhibition of calcium influx in response to a 40 mM KCl challenge; neurons were treated with vehicle (0.01% DMSO) or a 20μM concentration of 5bk overnight in this experiment. P values of comparisons between treatments are as indicated; see statistical analysis described in Table 1.
Figure 2.
Figure 2.. 5bk decreases T-Type Ca2+ currents in dorsal root ganglion (DRG) sensory neurons.
(A) Representative family of traces of T-Type Ca2+ currents from DRG sensory treated overnight with vehicle (0.01% DMSO) or 5bk (20 μM). Voltage protocol used to evoke the currents is shown. (B) Summary of the normalized (pA/pF) T-Type calcium current density versus voltage relationship and (C) peak T-Type Ca2+ current density at −10 mV (mean ± SEM) from DRG sensory neurons treated as indicated. (D) Boltzmann fits for normalized conductance G/Gmax voltage relations for voltage dependent activation of T-type currents. (E) Inactivation τ, which is calculated from a single-exponential fit of the decaying portion of the current waveforms using a single-exponential equation: y = A1 × e(-x/ τ1)+ y0, where A1 is the amplitude, τ1 is the decay constant, and y0 is the offset. (F) This analysis was also isolated at −40 mV. (G) Time-dependent activation (10–90% rise time) from I-V curves and at −40mV (H) in DRG cells shown calculated from the data in B. (I) Boltzmann fits for normalized conductance G/Gmax voltage relations for voltage dependent inactivation of sensory neurons treated as indicated. (J) Deactivating tail currents in DRG neurons treated with vehicle (0.01% DMSO) or 5bk (20 μM) were fit with a single-exponential function. The resulting τ values are plotted. (K) Recovery from inactivation in indicated groups. Data are averaged and fitted by double exponential association (n=16–19 cells per condition). All graphs show mean ± s.e.m. with individual data points showed when possible. P values of comparisons between treatments are as indicated; see statistical analysis described in Table 1.
Figure 3.
Figure 3.. 5bk does not inhibit high voltage-activated Ca2+ currents in dorsal root ganglion (DRG) sensory neurons.
(A, F, K, P) Pharmacological isolation was achieved by the indicated cocktail of toxins/small molecules. The voltage protocol used to elicit the currents is also shown. (B, G, I, Q) Representative traces of DRG neurons treated overnight with 0.1% DMSO (control) or 20 μM 5bk. (C, H, M, R) Summary of the normalized (pA/pF) HVA calcium current density versus voltage relationship and (D, I, N, S) peak HVA Ca2+ current density at +20 mV (mean ± SEM) from DRG sensory neurons treated as indicated. Boltzmann fits for normalized conductance G/Gmax voltage relations for voltage dependent activation and inactivation (E, J, O, T) of sensory neurons treated as indicated. Voltage dependent activation was assessed with the protocol shown in (E). The V0.5 and slope (k) values for activation and inactivation are presented in Supplementary Figure 5. P values of comparisons between treatments are as indicated; see statistical analysis described in Table 1.
Figure 4.
Figure 4.. Downregulation of CaV3.2 blocks 5bk-mediated regulation of depolarization-evoked Ca2 influx through T-type Ca2+ channels.
Dorsal root ganglion neurons were transfected during plating with a GFP construct and a scramble siRNA or with siRNAs against CaV3.1, CaV3.2 or CaV3.3. The bar graph shows normalized peak calcium response averages ± S.E.M. of DRG sensory neurons treated as indicated. Responses were normalized to that of DMSO (vehicle) in the siRNA scramble condition. Representative time courses of the change in 340 nm/380 nm ratio for the response of representative neurons imaged in a preparation treated with 0.01% DMSO or 5bk are shown above the bar graphs. These experiments were done in a blinded fashion. P values of comparisons between treatments (n = 10–42 cells per condition) are as indicated; see statistical analysis described in Table 1.
Figure 5.
Figure 5.. Constellation pharmacology-based characterization of neuronal populations in DRG sensory neurons treated with 5bk.
(A) Representative traces of sensory neurons treated overnight with 0.01% DMSO (vehicle) or (B) 20 μM concentration of 5bk responding to constellation pharmacology triggers (menthol (400 nM), histamine (50 μM), ATP (10 μM), AITC (200 μM), acetylcholine (1 mM), capsaicin (100 nM) and KCl (90 mM)) during Ca2+ imaging. Each trace represents an individual neuron; a typical experimental trial records the responses of >300 neurons concurrently. (C) Number of overall functional DRG sensory neuronal classes as a result of treatment with DMSO or 5bk (20 μM). (D) Percentage of DRG sensory neurons that responded to indicated number of triggers. (E) Percentage of sensory neurons responding to major classes and (F) indicated subclasses of constellation triggers. (G) Average peak Ca2+ response post-indicated treatment for DRG neurons following stimulation by major classes of constellation triggers. (H) Area under the curve is shown for calcium response in sensory neurons post-indicated treatment, after stimulation by major classes of constellation triggers. Area under the curve was calculated with Graphpad Prism software using the trapezoid rule. (I) Average peak KCl-evoked response of sensory neurons post-indicated treatment. P values of comparisons between treatments are as indicated; see statistical analysis described in Table 1. Abbreviations for constellation triggers are as follows: ACh = acetylcholine; AITC = allyl isothiocyanate; ATP = adenosine triphosphate; Hist = histamine; Ment = menthol; Cap = capsaicin; KCl = potassium chloride. Data was collected from a total of 5 independent experiments with an overall sample of 2002 for control conditions and 2902 for 5bk (20 μM). P values of comparisons between treatments are as indicated; see statistical analysis described in Table 1.
Figure 6.
Figure 6.. 5bk does not bind to the opioid receptors.
Competition radioligand binding was performed in CHO cells expressing the human mu/delta/kappa opioid receptors (MOR, DOR, or KOR, respectively) (see Methods for details). 5bk or a positive control compound was competed against 3H-diprenorphine in all 3 cell lines. Curves reported as the mean ± SEM of the mean value from each individual experiment in n = 3 independent experiments. The Ki also reported as the mean ± SEM of the individual value from each of n = 3 independent experiments. 5bk did not produce competition binding up to 10 μM in any cell line. (A) MOR: Naloxone Ki = 43.3 ± 1.9 nM. (B) DOR: Naloxone Ki = 48.1 ± 9.1 nM. (C) KOR: U50,488 Ki = 12.7 ± 0.6 nM. See statistical analysis described in Table 1.
Figure 7.
Figure 7.. 5bk decreases spontaneous excitatory synaptic transmission in substantia gelatinosa neurons.
(A) Representative traces recorded from control (0.1% DMSO) and 5bk (25 μM)-treated groups. (B) Spontaneous excitatory post synaptic current (EPSC) amplitudes as a result of treatment with DMSO or 5bk. (C) Spontaneous EPSC frequency as a result of treatment with DMSO or 5bk. P values of comparisons between treatments (n = 17–18 per condition) are as indicated; see statistical analysis described in Table 1.
Figure 8.
Figure 8.. 5bk decreases evoked CGRP release.
Spinal cords from adult rats (n=4 per condition) were used to assess potassium chloride (KCl, 90 mM)-induced calcitonin gene related peptide (CGRP) release from nerve terminals. KCl increased CGRP release in control rat spinal cords, which was significantly higher than in cords from 5bk-treated rats (* p<0.05 vs. control; two-way ANOVA post hoc Sidak’s test). P values of comparisons between treatments are as indicated; see statistical analysis described in Table 1.
Figure 9.
Figure 9.. GP120, paclitaxel, and spinal nerve ligation induced nociceptive behaviors are reduced upon treatment with 5bk.
(A) Rats received spinal nerve ligation (SNL) injury with allodynia measurement on the left hind paw. Paw withdrawal thresholds were significantly decreased 7 days after surgery. 5bk (2 μg/5 μL) or vehicle (saline) were injected into the intrathecal space and PWTs measured. Paw withdrawal thresholds were significantly reversed at the indicated times after injection of 5bk (n=6; *p<0.05; two-way ANOVA with a Student-Neuman-Kuels post hoc test). (B) Data from D are transformed and presented as mean ± s.e.m. percentage of maximal anti-allodynia (see Methods). (C) Area under the curve (AUC), using the trapezoid method, for PWT. Statistical significance is indicated by asterisks (*p<0.05, one-way analysis of variance with Tukey’s post hoc analysis) in comparison to vehicle-treated rats. (D) Paw withdrawal threshold (PWTs) of adult rats (n=7) was measured 15 days after 3 intrathecal injections of glycoprotein-120. Rats were treated with saline (vehicle) or 5bk (2 μg/5 μL, intrathecal) as indicated. Asterisks indicate statistical significance compared with animals treated with saline (*p<0.05; 2-way ANOVA with a Dunnet’s hoc test). (E) Data from A are transformed and presented as mean ± s.e.m. percentage of maximal anti-allodynia (see Methods). (F) Area under the curve was derived as indicated before using Graphpad prism. Statistical significance is indicated by asterisks (*p<0.05, Mann-Whitney) in comparison to vehicle-treated rats. (G) Paw withdrawal threshold of adult rats (n=7) was measured 15 days after 4 intraperitoneal injections of paclitaxel. Rats were treated with saline (vehicle) or 5bk (2 μg/5 μL, intrathecal) as indicated. Data from G are transformed and presented as mean ± s.e.m. percentage of maximal anti-allodynia (see Methods). Asterisks indicate statistical significance compared with tissue treated with saline (*p<0.05; 2-way ANOVA with a Dunnet’s post hoc test). (I) Area under the curve was derived again as indicated before using Graphpad prism. Statistical significance is indicated by asterisks (*p<0.05, Mann-Whitney) in comparison to vehicle-treated rats. Exact p values of comparisons between treatments are described in Table 1.
Figure 10.
Figure 10.. Treatment with 5bk does not induce motor deficits or alter anxiety levels.
(A) Rats (n = 6) were subjected to the rotarod performance test as previously described in the Methods in order to test for motor deficits. Vehicle and 5bk-treated animals remained on the rotarod for an average of 172 ± 7.3 and 170 ± 9.6 seconds (cutoff 180 seconds), respectively, when tested over the course of 300 minutes. No significant motor deficits were noted in comparison to vehicle-treated animals. (B) Rats (n = 7) were subjected to the elevated plus maze (EPM) test as detailed (see methods); the anxiety index, integrates measurement of times and entries of the animals into the open and closed arms of the EPM, and is shown both pre- and post (1 hour) injection of either 0.01% DMSO (vehicle) or 5bk (2 μg/5 μL, intrathecal) as indicated. See statistical analysis described in Table 1.

References

    1. Aziz-Donnelly A, Harrison TB. Update of HIV-Associated Sensory Neuropathies. Curr Treat Options Neurol 2017;19(10):36. - PubMed
    1. Bauer CS, Rahman W, Tran-van-Minh A, Lujan R, Dickenson AH, Dolphin AC. The anti-allodynic alpha(2)delta ligand pregabalin inhibits the trafficking of the calcium channel alpha(2)delta-1 subunit to presynaptic terminals in vivo. Biochemical Society transactions 2010;38(2):525–528. - PubMed
    1. Bellampalli SS, Ji Y, Moutal A, Cai S, Wijeratne EMK, Gandini MA, Yu J, Chefdeville A, Dorame A, Chew LA, Madura CL, Luo S, Molnar G, Khanna M, Streicher JM, Zamponi GW, Gunatilaka AAL, Khanna R. Betulinic acid, derived from the desert lavender Hyptis emoryi, attenuates paclitaxel-, HIV-, and nerve injury-associated peripheral sensory neuropathy via block of N- and T-type calcium channels. Pain 2019;160(1):117–135. - PMC - PubMed
    1. Bernal Sierra YA, Haseleu J, Kozlenkov A, Begay V, Lewin GR. Genetic Tracing of Cav3.2 T-Type Calcium Channel Expression in the Peripheral Nervous System. Frontiers in molecular neuroscience 2017;10:70. - PMC - PubMed
    1. Blesneac I, Chemin J, Bidaud I, Huc-Brandt S, Vandermoere F, Lory P. Phosphorylation of the Cav3.2 T-type calcium channel directly regulates its gating properties. Proceedings of the National Academy of Sciences of the United States of America 2015;112(44):13705–13710. - PMC - PubMed

Publication types