. 2020 Jun 15;11(1):3021.
doi: 10.1038/s41467-020-16840-2.

Hematopoietic stem and progenitor cell-restricted Cdx2 expression induces transformation to myelodysplasia and acute leukemia

Affiliations

Hematopoietic stem and progenitor cell-restricted Cdx2 expression induces transformation to myelodysplasia and acute leukemia

Therese Vu et al. Nat Commun. .

Abstract

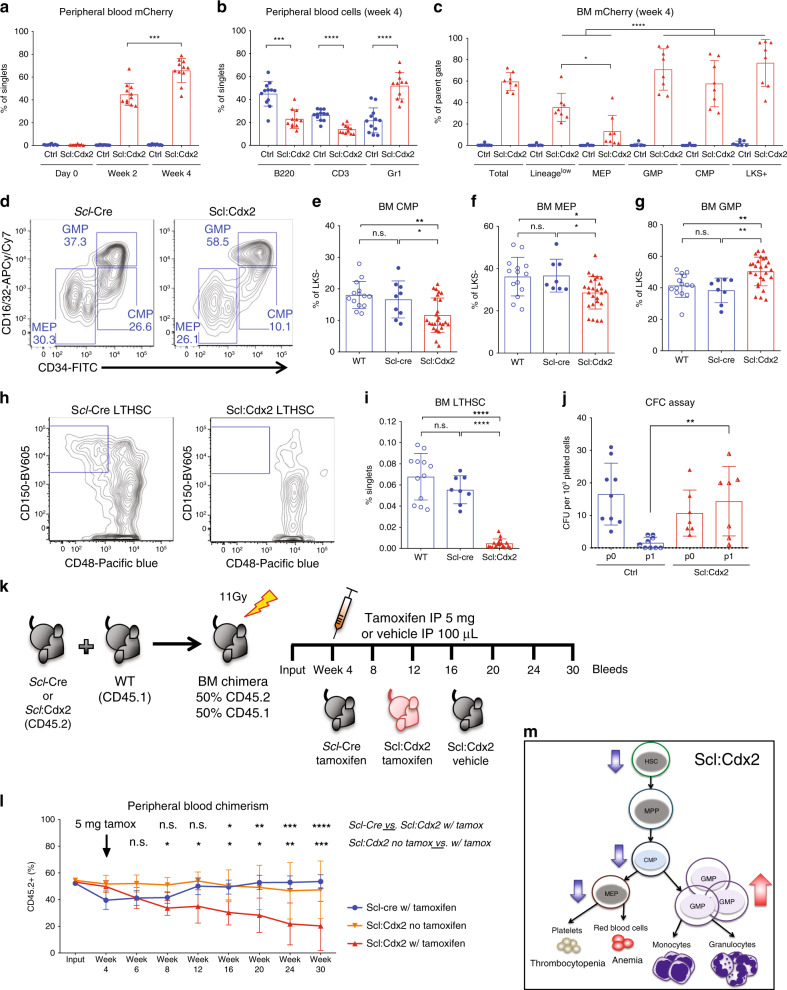
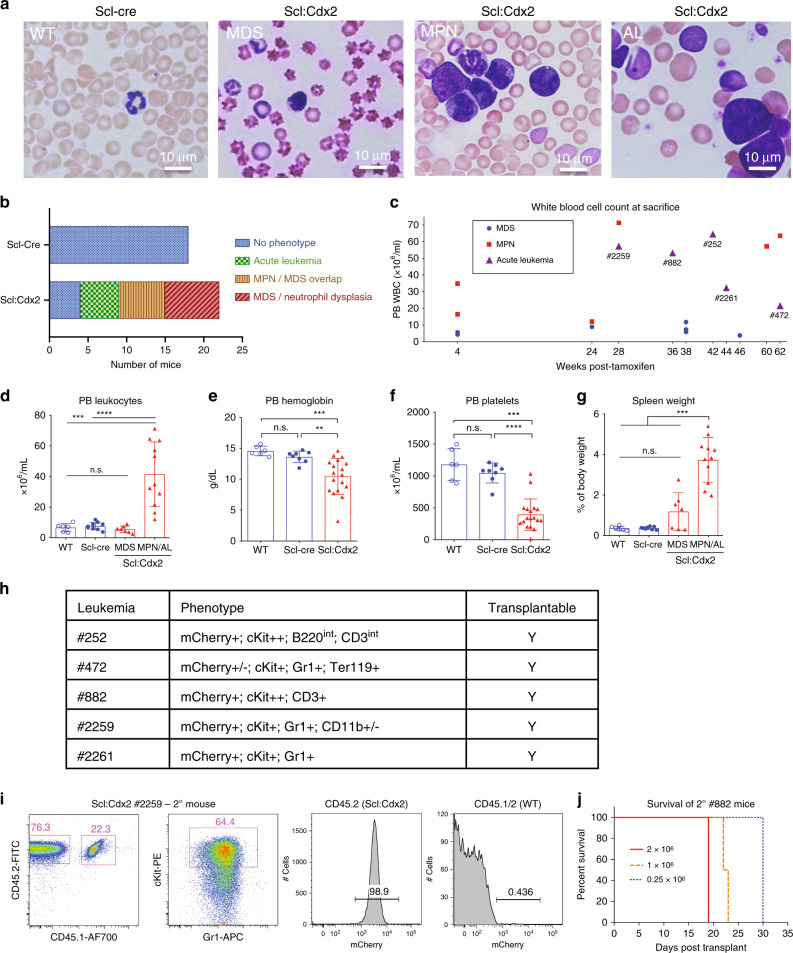
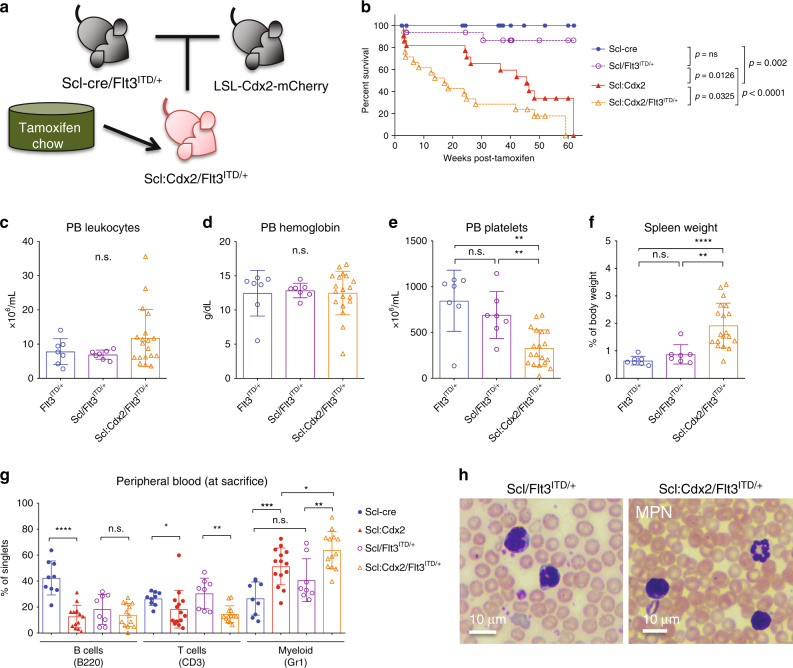
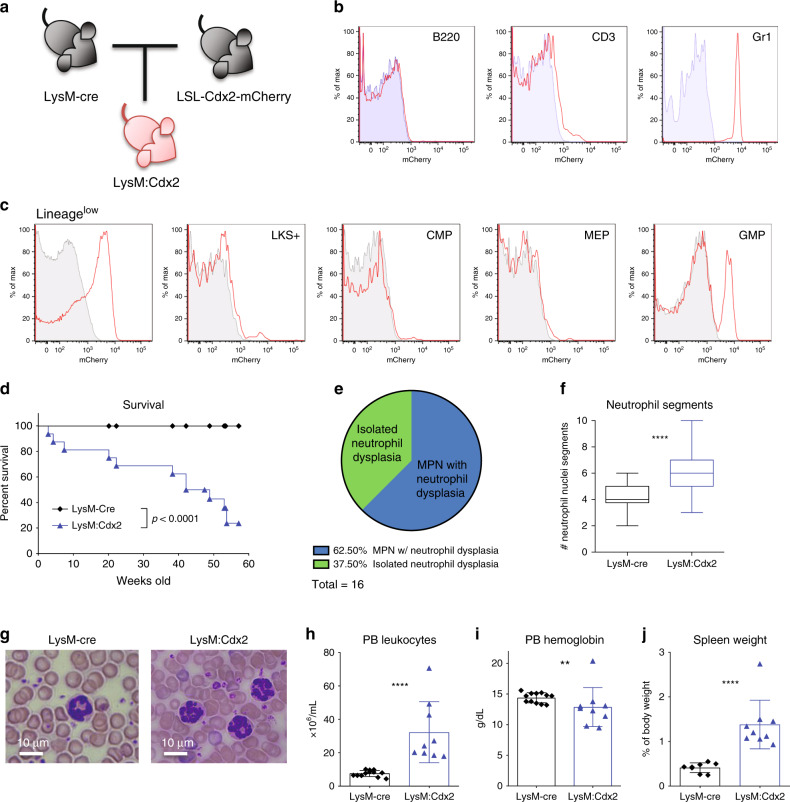
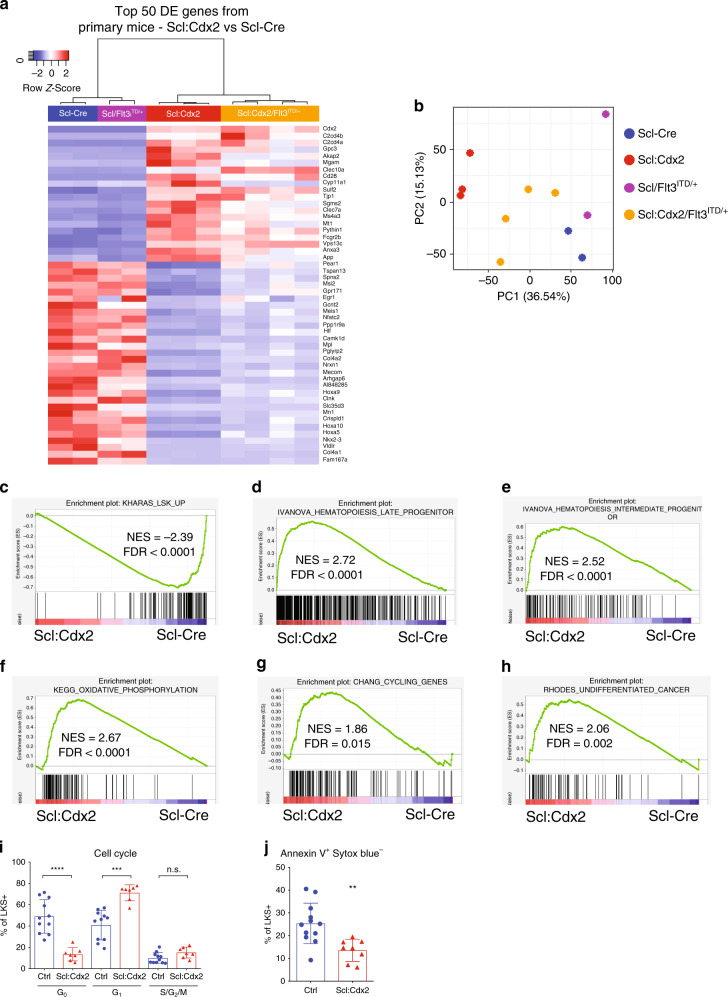
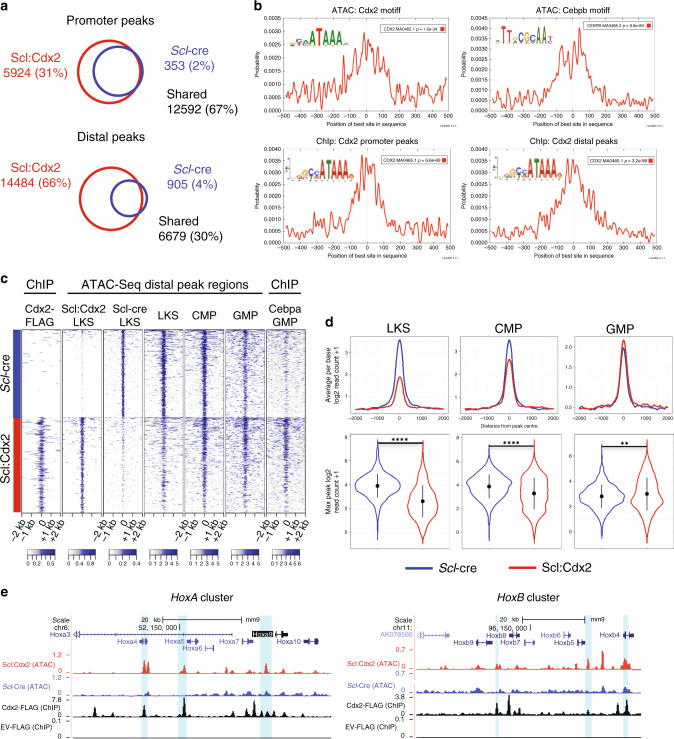
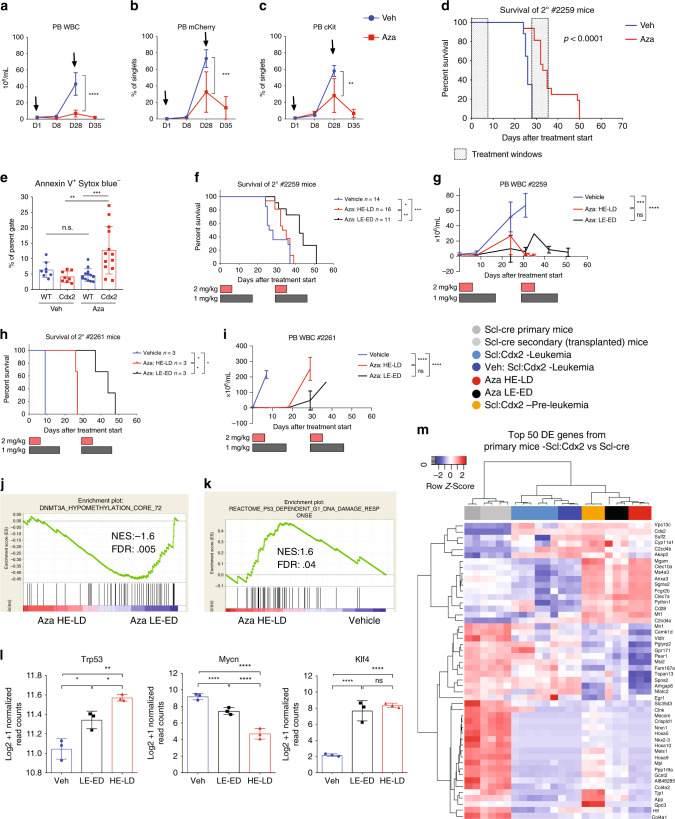
The caudal-related homeobox transcription factor CDX2 is expressed in leukemic cells but not during normal blood formation. Retroviral overexpression of Cdx2 induces AML in mice, however the developmental stage at which CDX2 exerts its effect is unknown. We developed a conditionally inducible Cdx2 mouse model to determine the effects of in vivo, inducible Cdx2 expression in hematopoietic stem and progenitor cells (HSPCs). Cdx2-transgenic mice develop myelodysplastic syndrome with progression to acute leukemia associated with acquisition of additional driver mutations. Cdx2-expressing HSPCs demonstrate enrichment of hematopoietic-specific enhancers associated with pro-differentiation transcription factors. Furthermore, treatment of Cdx2 AML with azacitidine decreases leukemic burden. Extended scheduling of low-dose azacitidine shows greater efficacy in comparison to intermittent higher-dose azacitidine, linked to more specific epigenetic modulation. Conditional Cdx2 expression in HSPCs is an inducible model of de novo leukemic transformation and can be used to optimize treatment in high-risk AML.


Conflict of interest statement

We have the following disclosures that have been included in the manuscript as potential for conflict of interest. This work was funded by the National Health and Medical Research Fund of Australia and the Leukaemia Foundation of Australia. Celgene provided azacitidine and additional research funding. S.W.L. has participated in an advisory board for Celgene.

Figures

Fig. 1
Fig. 1. Cdx2 expression in HSPC alters progenitor subsets and self-renewal function.
a Frequency of mCherry-positive Cdx2 cells in peripheral blood (PB) after tamoxifen induction at indicated time points (Ctrl n = 12; Scl:Cdx2 n = 11). b Frequency of mCherry-positive Cdx2 cells in B220 + , CD3 + or Gr1 + PB cells at week 4 after tamoxifen (Ctrl n = 12; Scl:Cdx2 n = 11). c Frequency of mCherry-positive Cdx2 cells in bone marrow (BM) at week 4 in indicated subpopulations (n = 8 per group). d Representative flow cytometry of lineagelowcKit+Sca1 (LKS−) myeloid progenitors in BM cells at week 4 after tamoxifen. (e) Frequency of common myeloid progenitors (CMP), f megakaryocyte-erythroid progenitors (MEP), and g granulocyte-macrophage progenitors (GMP) in parent population (LKS−), (WT n = 14; Scl-cre n = 8; Scl:Cdx2 n = 26). h Representative flow cytometry of lineagelowcKit+, Sca1+ (LKS+) BM cells showing CD150+CD48 long-term hematopoietic stem cells (LTHSC) and (i) quantification of LTHSC frequency, (WT n = 12; Scl-cre n = 8; Scl:Cdx2 n = 19). j Colony forming cell (CFC) assay of BM cells initially plated (p0) and replated (p1) in M3434 methylcellulose. Each BM sample was plated in triplicate and each data point represents the mean of triplicate plates (Ctrl n = 9; Scl:Cdx2 n = 7). k Diagram of BM transplant experiment setup. Scl-Cre (n = 5) and Scl:Cdx2 (n = 10, split into n = 5 per treatment arm) BM chimeras. Tamoxifen or corn oil (vehicle) was administered by intraperitoneal (IP) injection to indicated groups. l PB chimerism to monitor relative contribution of Scl-Cre or Scl:Cdx2 BM to peripheral hematopoiesis. Experiment was performed in duplicate. Arrow indicates IP injection time point. (m) Model of Scl:Cdx2 hematopoietic cell hierarchy showing decreases in LTHSC, CMP and MEP leading to a loss of platelets (thrombocytopenia) and erythrocytes (anemia), and a relative increase in GMP resulting in greater levels of myeloid cells: monocytes and granulocytes. N = biologically independent animals. Statistical analyses performed using two-tailed Mann–Whitney test except (l) which used mixed-effects model with Tukey’s multiple comparisons test. Data are plotted as mean values +/− SD. n.s.; not significant. *P < 0.05, **P < 0.01, ***P < 0.001, ****P < 0.0001.
Fig. 2
Fig. 2. Cdx2 expression in HSPC results in lethal and transplantable disease.
a Representative Wright-Giemsa stained PB smears showing distinct phenotypes of Scl-Cre (normal) and Scl:Cdx2 mice at disease onset. Scale bars on bottom right of each image indicate 10 µm. MDS, myelodysplastic syndrome; MPN, myeloproliferative neoplasm; AL, acute leukemia. b Incidence of hematological disease in Scl-Cre (n = 18) and Scl:Cdx2 (n = 22) mice after 60 weeks of monitoring. (c) White blood cell (WBC) counts of Scl:Cdx2 mice (n = 18) at date of sacrifice and assignment of disease diagnosis. The identification numbers of mice with acute leukemia are indicated. d Leukocyte counts (WBC), (e) hemoglobin, f platelet counts, and g spleen size relative to body mass of mice at sacrifice. (WT n = 6; Scl-cre n = 8; Scl:Cdx = 18 [MDS n = 7; MPN/AL n = 11]). h Table showing acute leukemia immunophenotype in mCherry+cKit+ PB cells of Scl:Cdx2 mice at disease onset and transplantability status of these cells. i Representative flow cytometry of PB from mice transplanted with Scl:Cdx2 #2259 acute leukemia BM cells. j Survival curve of secondary leukemia mice transplanted with varying cell numbers of Scl:Cdx2 #882 BM cells (n = 10). N = biologically independent animals. Statistical analyses performed using two-tailed Mann–Whitney test. Log-rank Mantel-Cox test used for survival curve. Data are plotted as mean values +/− SD. n.s.; not significant. *P < 0.05, **P < 0.01, ***P < 0.001, ****P < 0.0001.
Fig. 3
Fig. 3. Cdx2 synergizes with Flt3-ITD to accelerate myeloproliferation.
a Diagram of breeding strategy to produce Scl:Cdx2/Flt3ITD/+ mice. LSL-Cdx2-mCherry mice were crossed with Flt3ITD/+ germline mutant mice that were previously crossed with Scl-CreERT transgene mice (Scl-cre/Flt3ITD/+). Unexcised Scl:Cdx2/Flt3ITD/+ mice are fed tamoxifen-loaded chow for two weeks. b Survival curve of tamoxifen-treated mice (Scl-CreERT n = 18; Scl:Cdx2 n = 22; Scl/Flt3ITD/+ n = 16; Scl:Cdx2/Flt3ITD/+ n = 21). c PB leukocytes (WBC), d hemoglobin and e platelet counts of mice, and (f) spleen size relative to body mass of mice at sacrifice (Flt3ITD/+ n = 7; Scl/Flt3ITD/+ n = 7; Scl:Cdx2/Flt3ITD/+ n = 19). g Frequency of B220-positive B cells, CD3-positive T cells and Gr1-positive myeloid cells in PB of mice at sacrifice (Scl-cre n = 9; Scl:Cdx2 n = 14; Scl/Flt3ITD/+ n = 8; Scl:Cdx2/Flt3ITD/+ n = 13). h Representative Wright-Giemsa stained smear of Scl/Flt3ITD/+ PB with mild granulopoiesis and Scl:Cdx2/Flt3ITD/+ PB showing monocytosis and hypersegmented neutrophils resulting in MPN (observed in multiple independent animals). Scale bars on bottom left of each image indicate 10 µm. N = biologically independent animals. Statistical analyses performed using two-tailed Mann–Whitney test. Log-rank Mantel-Cox test used for survival curve. Data are plotted as mean values +/− SD. n.s.; not significant. *P < 0.05, **P < 0.01, ***P < 0.001, ****P < 0.0001.
Fig. 4
Fig. 4. Restricted myeloid expression of Cdx2 causes disease distinct from Scl:Cdx2.
a Diagram of breeding strategy to product LysM:Cdx2 mice. LSL-Cdx2-mCherry mice are crossed with LysM-Cre knock-in mice at the endogenous LysM locus, leading to LysM-expressing GMP cells and their progeny to express Cdx2 and mCherry-reporter proteins. b Representative flow cytometry plots showing mCherry expression in PB subsets of LysM-Cre (blue shaded) and LysM:Cdx2 (red line) mice. c Representative flow cytometry plots showing mCherry expression in BM subsets of LysM-Cre (grey shaded) and LysM:Cdx2 (red line) mice. d Survival curve after 60 weeks of monitoring (LysM-Cre, n = 23; LysM:Cdx2, n = 16). e Proportion of hematological state of LysM:Cdx2 mice at sacrifice. f Box plot of quantification of neutrophil nuclei segments in PB smears. Top and bottom of whiskers represent maximum and minimum values respectively, centre line within box represents median value, upper and lower quartiles represent 75th and 25th percentile respectively. At least 15 neutrophils were counted per slide by independent researchers, n = 4 per group. g Wright-Giemsa stained PB smears showing representative neutrophils of LysM-Cre and LysM:Cdx2 mice. Scale bars on bottom left of each image indicate 10 µm. h PB leukocyte (WBC) and i hemoglobin levels of mice at sacrifice (LysM-Cre n = 12; LysM:Cdx2 n = 9). j Spleen size relative to body mass of mice at sacrifice (LysM-Cre n = 7; LysM:Cdx2 n = 9). N = biologically independent animals. Statistical analyses performed using two-tailed Mann–Whitney test. Data are plotted as mean values +/− SD. n.s.; not significant. **P < 0.01, ****P < 0.0001.
Fig. 5
Fig. 5. Cdx2 confers a progenitor gene signature associated with differentiation.
a Heatmap and unsupervised hierarchical clustering of top 50 differentially expressed genes from comparing Scl:Cdx2 and Scl-Cre on normalized read counts from RNA-Seq of BM LKS + cells of Scl-Cre, Scl:Cdx2, Scl/Flt3ITD/+, and Scl:Cdx2/Flt3ITD/+ mice. Color scale shows Z-score after row normalization. b Principal component analysis of the total RNA-Seq derived transcriptome. ch Gene Set Enrichment Analysis (GSEA) on normalized read counts of transcripts from RNA-Seq of Scl-Cre (n = 2) compared with Scl:Cdx2 (n = 3). i Cell cycle analysis of BM LKS+ cells (Scl-cre n = 11; Scl:Cdx2 n = 7). j Apoptosis analysis of Annexin V-positive, Sytox-negative cells in BM LKS + by flow cytometry (Scl-cre n = 12; Scl:Cdx2 n = 8). N = biologically independent animals. Statistical analyses of graphs performed using two-tailed Mann–Whitney test. Data are plotted as mean values +/− SD. n.s.; not significant. **P < 0.01, ***P < 0.001, ****P < 0.0001.
Fig. 6
Fig. 6. Cdx2 modifies chromatin access in regions with critical differentiation factors.
a Number of ATAC-Seq peaks found in Scl-Cre and Scl:Cdx2 BM LKS+ cells. b Centrally enriched motifs in peaks specific for Scl:Cdx2 BM samples by ATAC-Seq and Cdx2-FLAG BM samples by ChIP-Seq (as labeled) determined by MEME Suite. c Heatmaps of the top 1000 gained peaks at distal elements (peak centres +/− 2000 base pairs) that overlap between Cdx2-Flag BM samples by ChIP-Seq and Scl:Cdx2 or Scl-Cre BM samples by ATAC-Seq, ordered by signal intensity. LKS, CMP, GMP ATAC-Seq read coverage and Cebpα GMP ChIP-Seq read coverage included at the same locations. Color scale shows Log2 + 1 normalized read counts. d Average peak height (top) and max peak height distribution (bottom) of distal ATAC-Seq peaks relating to (c). e UCSC browser tracks (mm9 murine genome) of Scl:Cdx2 and Scl-Cre ATAC-Seq peaks, and Cdx2-FLAG and Empty vector (EV) ChIP-Seq peaks in HoxA and HoxB clusters. Peaks called by MACS2. Light blue vertical bars highlight Scl:Cdx2 gained peaks positioned with a Cdx2 ChIP-Seq peak and Cdx2 motif. Statistical analyses for (d) performed using two-tailed Mann–Whitney test without adjustment for multiple comparisons. **P < 0.01, ****P < 0.0001.
Fig. 7
Fig. 7. Cdx2-mediated leukemia is responsive to treatment with 5-azacitidine.
Time course of PB (a) WBC count, (b) mCherry percentage and (c) immature cKit cells of Scl:Cdx2 #2259 leukemia mice treated with Vehicle (Veh) n = 8 or Azacitidine (Aza) n = 9. Black arrows denote start of each 7 day treatment cycle. d Survival curve of Veh n = 17 or Aza n = 16. e Apoptosis assay of CD45.1+ WT or CD45.2+ Scl:Cdx2 PB cells treated with Veh or Aza. f Survival curve of Scl:Cdx2 #2259 mice treated with Veh (n = 14), Aza for 7 days at 2 mg/kg (HE-LD) per dose (n = 16) or Aza for 14 days at 1 mg/kg (LE-ED) per dose (n = 11). Red shaded bars denote HE-LD Aza treatment window. Black shaded bars denote LE-ED Aza treatment window. g PB WBC count time course. h Survival curve of Scl:Cdx2 #2261 mice treated with Veh, Aza HE-LD or Aza LE-ED (n = 3 per group). i PB WBC count time course. GSEA of (j) hypomethylation signature and (k) DNA damage signature (n = 3 per group). l Normalized read counts of transcripts by RNA-Seq (n = 3 per group). m Unsupervised hierarchical clustered heatmap derived from RNA-Seq of top 50 differentially expressed genes from comparing Scl:Cdx2 and Scl-Cre. Visualized are Scl-cre (gray) representing normal LKS+, Scl:Cdx2 leukemia cells (light blue) and cells treated with vehicle (dark blue) representing Cdx2-mediated acute leukemia, Scl:Cdx2 pre-leukemia cells (orange), and Scl:Cdx2 leukemia cells treated with HE-LD Aza (red) or LE-ED (black). Color scale shows row-normalized Z-score. N = biologically independent animals. Statistical analyses of graphs performed using multiple t-tests (one unpaired t-test per row) with few assumptions except (l) which used FDR-adjusted P-values from likelihood ratio test of the binomial generalized log-linear modeled gene expression data as implemented in edgeR. Log-rank Mantel-Cox test used for survival curves. Data are plotted as mean values +/− SD. n.s.; not significant.*P < 0.05, **P < 0.01, ***P < 0.001, ****P < 0.0001.

References

    1. Scholl C, et al. The homeobox gene Cdx2 is aberrantly expressed in most cases of acute myeloid leukemia and promotes leukemogenesis. J. Clin. Invest. 2007;117:1037–1048. - PMC - PubMed
    1. Rawat VPS, et al. Ectopic expression of the homeobox gene Cdx2 is the transforming event in a mouse model of T(12;13)(P13;Q12) acute myeloid leukemia. Proc. Natl Acad. Sci. USA. 2004;101:817–822. - PMC - PubMed
    1. Rawat VPS, et al. Overexpression of Cdx2 perturbs Hox gene expression in murine progenitors depending on its N-Terminal domain and is closely correlated with deregulated Hox gene expression in human acute myeloid leukemia. Blood. 2007;111:309. - PubMed
    1. Lengerke C, Daley GQ. Caudal genes in blood development and leukemia. Ann. N. Y. Acad. Sci. 2012;1266:47–54. - PMC - PubMed
    1. Chawengsaksophak K, de Graaff W, Rossant J, Deschamps J, Beck F. Cdx2 is essential for axial elongation in mouse development. Proc. Natl Acad. Sci. USA. 2004;101:7641–7645. - PMC - PubMed

Publication types

MeSH terms

Substances