. 2020 Jun 15;10(1):9624.
doi: 10.1038/s41598-020-66598-2.

Revealing links between gut microbiome and its fungal community in Type 2 Diabetes Mellitus among Emirati subjects: A pilot study

Affiliations

Revealing links between gut microbiome and its fungal community in Type 2 Diabetes Mellitus among Emirati subjects: A pilot study

Mohammad Tahseen Al Bataineh et al. Sci Rep. .

Erratum in

Abstract

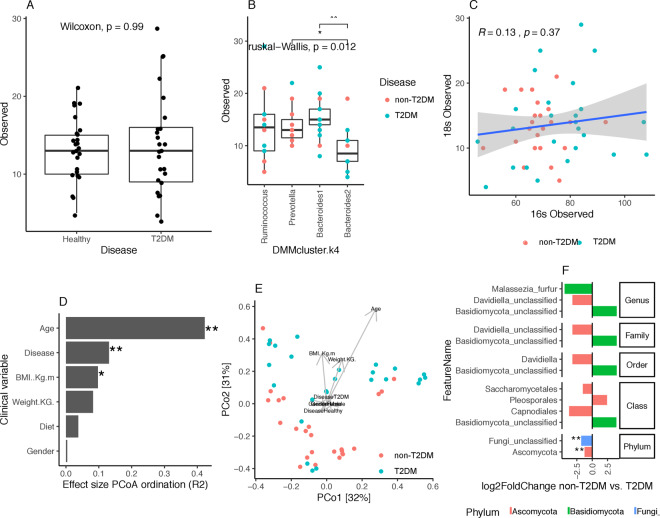
Type 2 diabetes mellitus (T2DM) drastically affects the population of Middle East countries with an ever-increasing number of overweight and obese individuals. The precise links between T2DM and gut microbiome composition remain elusive in these populations. Here, we performed 16 S rRNA and ITS2- gene based microbial profiling of 50 stool samples from Emirati adults with or without T2DM. The four major enterotypes initially described in westernized cohorts were retrieved in this Emirati population. T2DM and non-T2DM healthy controls had different microbiome compositions, with an enrichment in Prevotella enterotype in non-T2DM controls whereas T2DM individuals had a higher proportion of the dysbiotic Bacteroides 2 enterotype. No significant differences in microbial diversity were observed in T2DM individuals after controlling for cofounding factors, contrasting with reports from westernized cohorts. Interestingly, fungal diversity was significantly decreased in Bacteroides 2 enterotype. Functional profiling from 16 S rRNA gene data showed marked differences between T2DM and non-T2DM controls, with an enrichment in amino acid degradation and LPS-related modules in T2DM individuals, whereas non-T2DM controls had increased abundance of carbohydrate degradation modules in concordance with enterotype composition. These differences provide an insight into gut microbiome composition in Emirati population and its potential role in the development of diabetes mellitus.


Conflict of interest statement

The authors declare no competing interests.

Figures

Figure 1
Figure 1
Prokaryotic profiling of gut microbiome. (A) Effect sizes of clinical covariates and disease state over Alpha diversity distribution (observed species) based on linear regression analyses (** = FDR < 0.05; * = P value < 0.05, FDR > 0.05) (B) Differences in residuals of linear-regression between alpha diversity (Observed species, dependent variable) and age (independent variable) between study groups. (C) Enterotype composition in non-T2DM and T2DM individuals by PAM clustering over JSD distance matrix computed from genus abundance data. (D) Enterotype composition in non-T2DM and T2DM individuals by DMM approach from genus abundance data. (E) Effect sizes of environmental fitting of clinical variables and disease state over PCoA ordination (** = P value < 0.05; * = P value < 0.1; permutation test) (F) Principal coordinates analyses of inter-individual differences (genus-level Bray-Curtis beta-diversity) with samples colored by disease state (non-T2DM, T2DM). Arrows represents effect sizes of the significant variables identified by environmental fitting analyses of panel E. (G) Barplot of log2 fold changes in taxonomic feature abundances between health controls and T2DM (P value < 0.05 in GLM model with negative binomial distribution of feature abundance by disease state adjusted by age).
Figure 2
Figure 2
Fungal profiling of gut microbiome. (A) Alpha diversity distributions (observed species) between non-T2DM and T2DM groups. (B) Fungal diversity distributions (observed species) across DMM enterotypes (** = P value < 0.001; * = P value < 0.05; Wilcoxon rank-sum test). (C) Correlation between fungal and prokaryotic diversity (observed species). R and p corresponds to Spearman Rho and p-value of Spearman correlation test. (D) Effect sizes of environmental fitting of clinical variables and disease state over Principal coordinates ordination from panel E (** = P value < 0.05; * = P value < 0.1; permutation test). (E) Principal coordinates analyses of inter-individual differences (genus-level Bray-Curtis beta-diversity) with samples colored by disease state (non-T2DM, T2DM). Arrows represents effect sizes of the significant variables identified by environmental fitting analyses of panel D. (F) Bar plot of log2 fold changes in taxonomic feature abundance between non-T2DM controls and T2DM (P value < 0.05 in GLM model with negative binomial distribution of feature abundance by disease state adjusted by age).
Figure 3
Figure 3
Functional profiling based on PICRUS analyses of 16 S data. (A) Effect sizes of clinical covariates and disease state over functional diversity distribution (KEGG orthology (KO) groups identified in PICRUSt analyses) based on linear regression analyses (** = FDR < 0.05; * = P value < 0.05, FDR > 0.05). (B) Differences in residuals of linear-regression between functional diversity (Observed KOs, dependent variable) and age (independent variable) between study groups. (C) KEGG modules significantly enriched in differentially abundant KO groups between non-T2DM and T2DM group (** FDR < 0.05, * = P value < 0.05; Gene Set Enrichment Analyses). The mean log2 fold changes of module KOs abundances between non-T2DM controls and T2DM is represented as indicator of enrichment direction (all modules enriched in the T2DM group; mean log2 fold changes non-T2DM controls vs. T2DM < 0). (D) Bar plot of log2 fold changes in Gut metabolic modules (GMMs) abundances between health controls and T2DM (P value < 0.05 in GLM model with negative binomial distribution of GMM abundance by disease state adjusted by age).

References

    1. Hasan N, Yang H. Factors affecting the composition of the gut microbiota, and its modulation. PeerJ. 2019;7:e7502. doi: 10.7717/peerj.7502. - DOI - PMC - PubMed
    1. Structure, function and diversity of the healthy human microbiome. Nature486, 207–214, 10.1038/nature11234 (2012). - PMC - PubMed
    1. Ley RE, Turnbaugh PJ, Klein S, Gordon JI. Microbial ecology: human gut microbes associated with obesity. Nature. 2006;444:1022–1023. doi: 10.1038/4441022a. - DOI - PubMed
    1. Aw W, Fukuda S. Understanding the role of the gut ecosystem in diabetes mellitus. Journal of diabetes investigation. 2018;9:5–12. doi: 10.1111/jdi.12673. - DOI - PMC - PubMed
    1. Zheng P, et al. The gut microbiome from patients with schizophrenia modulates the glutamate-glutamine-GABA cycle and schizophrenia-relevant behaviors in mice. Science advances. 2019;5:eaau8317. doi: 10.1126/sciadv.aau8317. - DOI - PMC - PubMed

Publication types