. 2020 Jun 15;11(1):3017.
doi: 10.1038/s41467-020-16832-2.

Rab11b-mediated integrin recycling promotes brain metastatic adaptation and outgrowth

Affiliations

Rab11b-mediated integrin recycling promotes brain metastatic adaptation and outgrowth

Erin N Howe et al. Nat Commun. .

Abstract

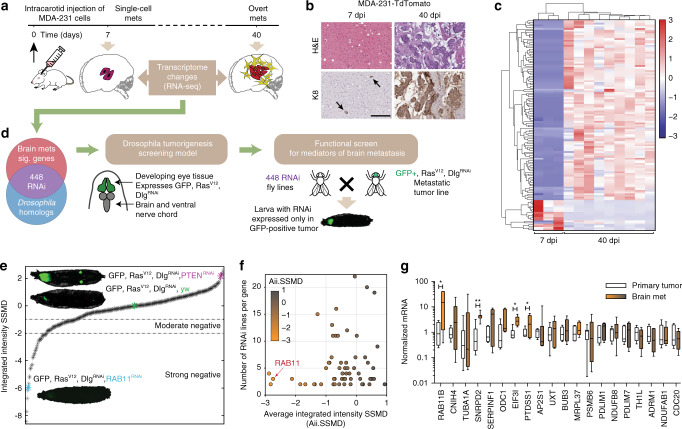
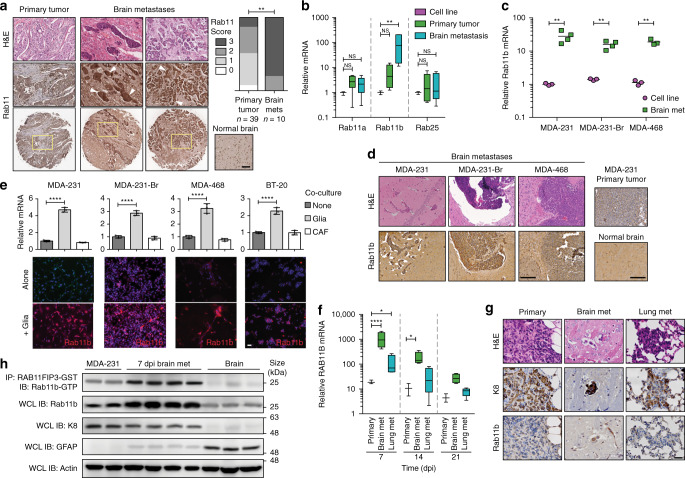
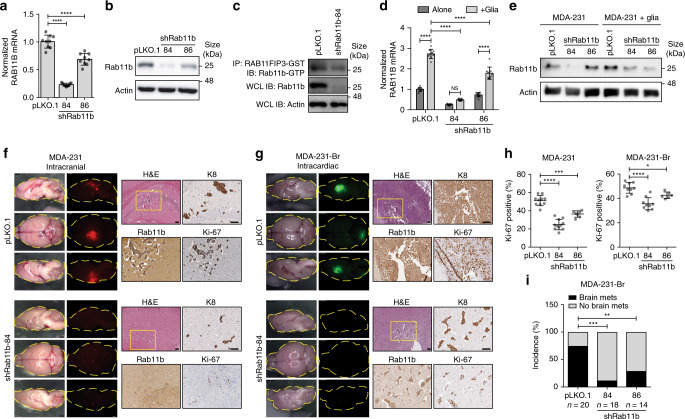
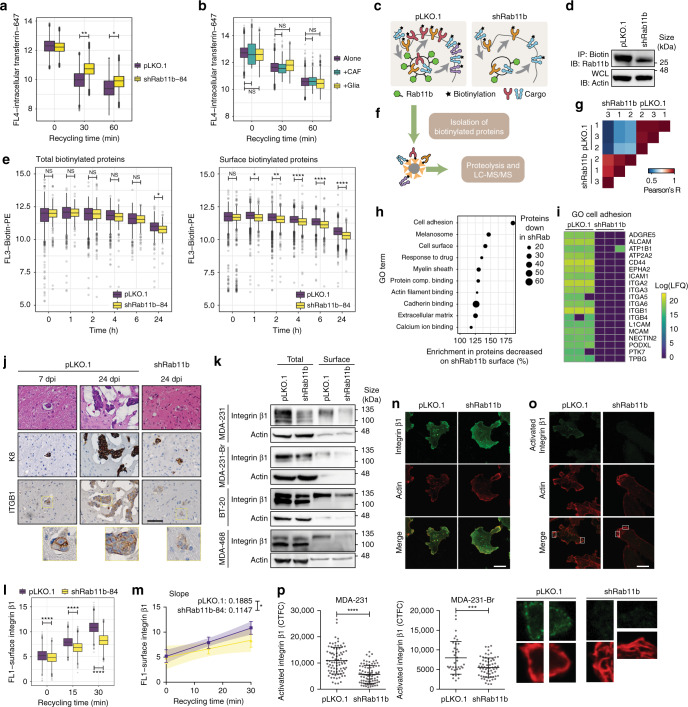
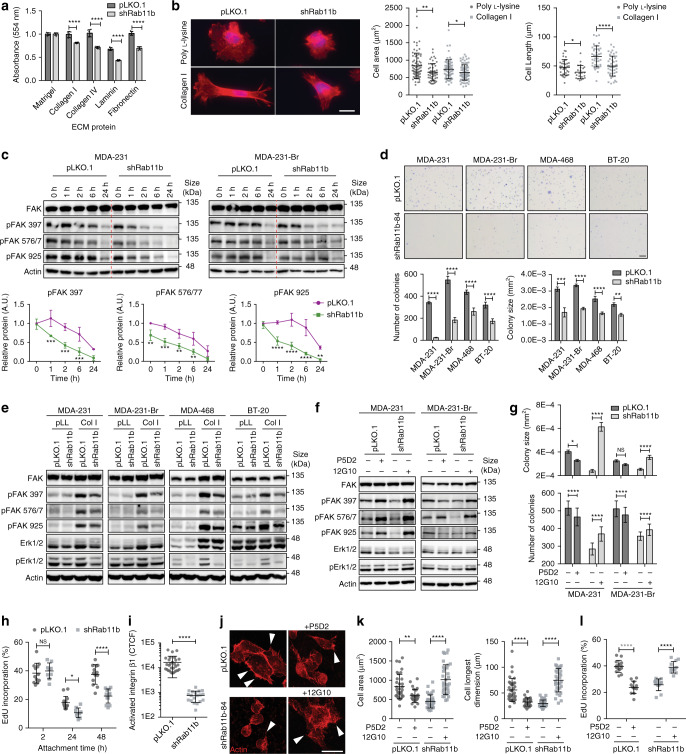
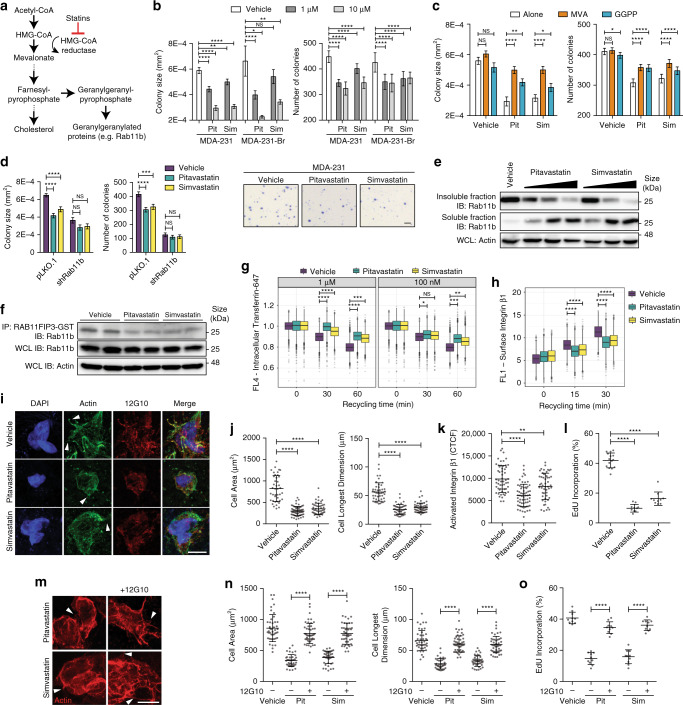
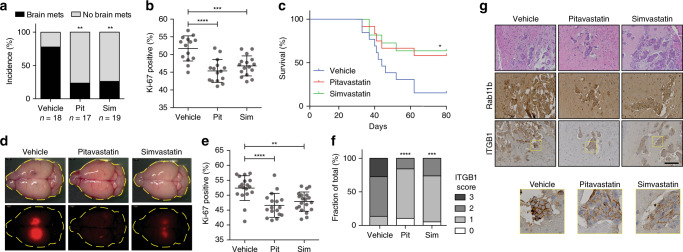
Breast cancer brain metastases (BCBM) have a 5-20 year latency and account for 30% of mortality; however, mechanisms governing adaptation to the brain microenvironment remain poorly defined. We combine time-course RNA-sequencing of BCBM development with a Drosophila melanogaster genetic screen, and identify Rab11b as a functional mediator of metastatic adaptation. Proteomic analysis reveals that Rab11b controls the cell surface proteome, recycling proteins required for successful interaction with the microenvironment, including integrin β1. Rab11b-mediated control of integrin β1 surface expression allows efficient engagement with the brain ECM, activating mechanotransduction signaling to promote survival. Lipophilic statins prevent membrane association and activity of Rab11b, and we provide proof-of principle that these drugs prevent breast cancer adaptation to the brain microenvironment. Our results identify Rab11b-mediated recycling of integrin β1 as regulating BCBM, and suggest that the recycleome, recycling-based control of the cell surface proteome, is a previously unknown driver of metastatic adaptation and outgrowth.


Conflict of interest statement

The authors declare no competing interests.

Figures

Fig. 1
Fig. 1. Identification of functional mediators of brain metastasis.
a Schematic of experimental design to generate temporal transcriptome of breast cancer brain metastases. b Representative images of brain mets at 7 or 40 dpi, as indicated. Tissues were H&E stained and cytokeratin 8 (K8) stained to show tumor tissue. Scale bar 200 µm. c Heatmap showing expression of 125 genes differentially expressed between 7 and 40 dpi. Fisher’s combined test, Bonferroni-corrected p-value < 0.05. d Schematic of selection of Drosophila homologs, the genotype and phenotype of the Drosophila screening line, and the functional screening model used. e Data are presented as strictly standardized mean difference (SSMD) calculated with respect to the negative control (yw, no RNAi construct) shown in green, and the positive control (PTENRNAi) shown in purple for a minimum of 15 larvae per cross. Hits are characterized as moderate or strong positives as indicated. Representative images for both controls, and a strong positive hit are shown. f For each RNAi line that yielded a strong, moderate or weak negative phenotype, the number of RNAi lines for that gene is plotted against the average integrated intensity SSMD. Datapoints are colored by average integrated intensity SSMD, with orange indicating a negative average SSMD, and gray indicating a positive average SSMD. g qRT-PCR for 20 genes with lowest average integrated intensity SSMD scores in MDA-231 primary mammary fat pad tumors (Primary Tumor, white), and brain metastases (Brain Met, orange to gray). Brain metastasis samples are colored to correspond to the gene’s average integrated intensity SSMD, as in F. n = 7 animals/group. Boxes, first to third interquartile range, line, mean, whiskers, minimum and maximum values. Pairwise comparisons made as indicated using Student’s t test. *p < 0.05, **p < 0.01.
Fig. 2
Fig. 2. Rab11b is up-regulated during metastatic adaptation to the brain microenvironment.
a Representative images of H&E (top) or Rab11 immunohistochemical staining of human primary breast cancer or breast cancer brain metastases (arrowheads). Left, Rab11 IHC scoring. Analysis of contingency, Fisher’s exact test. Scale bar 100 μm. b qPCR for Rab11 isoforms in MDA-231 cells grown in culture, primary tumors (21 dpi), or brain metastases (21 dpi). Values for each isoform normalized to cells in culture. n = 3 independent cell samples, 7 animals/group. Boxes, first to third interquartile range, line, mean, whiskers, minimum and maximum values. ANOVA, Dunnett’s multiple comparison. c qPCR for Rab11b in cells in culture versus brain metastases. Values are normalized to MDA-231 cells in culture. n = 3 independent cell samples, 4 animals/group Line, mean. Student’s t test. d Representative H&E and Rab11b immunohistochemical staining of brain metastases, and MDA-231 primary tumor or murine brain. Scale bar 100 μm. e Top, qPCR for Rab11b in cell lines co-cultured with primary murine glia for 2 days. All values normalized to single culture. Bars, mean ± s.d. ANOVA, Dunnett’s multiple comparison. Bottom, immunostaining for Rab11b (green, red) and nuclei (DAPI, blue) in cell lines cultured alone or co-cultured with primary murine glia for 5 days. n = 3. Scale bar 50 μm. f qPCR for Rab11b in MDA-231 primary tumors or metastases as indicated, collected at time points indicated. All values are normalized to MDA-231 cells in culture. n = 3. Boxes, first to third interquartile range, line, mean, whiskers, minimum and maximum values. Two-way ANOVA with Tukey’s multiple comparison test. g Representative H&E, cytokeratin 8 (K8), and Rab11b immunohistochemical staining of MDA-231 primary tumors, brain or lung metastases, at 7 dpi. Scale bar 20 μm. h MDA-231 cells were intracranially injected and brain metastases dissected at 7 dpi using fluorescence signal as a guide. Metastases dissociated and brain parenchymal cells were removed using magnetic bead-based stromal cell depletion. Naive brain (brain), or stroma depleted brain met (7 dpi brain met) samples were lysed and subjected to Rab11b activation assay, followed by immunoblotting. For all panels, *p < 0.05, **p < 0.01, ***p < 0.001, ****p < 0.0001.
Fig. 3
Fig. 3. Rab11b is required for breast cancer brain metastasis.
a Normalized mean RAB11B expression in MDA-231 cells, relative to pLKO.1 empty vector. Three independent experiments. Bars, mean ± s.d. ANOVA, Dunnett’s multiple comparison. b Rab11b immunoblots for MDA-231 cells expressing indicated constructs. c Rab11b-GTP immunoblot for MDA-231 cells. d Normalized RAB11B expression in MDA-231 cells cultured alone or with primary murine glia for three days, relative to pLKO.1 alone. n = 3 independent experiments. Bars, mean ± s.d. Two-way ANOVA, Tukey’s multiple comparison. e Rab11b immunoblots for MDA-231 cells cultured alone or with primary murine glia for five days followed by removal of glial cells. f Representative H&E and IHC images for mice intracranially injected with MDA-231-tdTomato control or shRab11b cells. Scale bar 100 μm. g Representative H&E and IHC images for mice intracardially injected with MDA-231-Br-EGFP control or shRab11b cells. Scale bar 100 μm. h Quantitation of Ki-67 staining. n = 2 independent experiments. Bars, mean ± s.d. ANOVA, Dunnett’s multiple comparison. i Incidence of MDA-231-Br brain metastasis determined by visible GFP signal at 28 dpi. Analysis of contingency, Fisher’s exact test. For all panels, *p < 0.05, **p < 0.01, ***p < 0.001, ****p < 0.0001.
Fig. 4
Fig. 4. Rab11b recycling alters the surface proteome and controls integrin β1 localization and activation.
a Transferrin receptor recycling in MDA-231 cells. n = 3 independent experiments. Two-way ANOVA, Sidak’s multiple comparison. b Transferrin receptor recycling in MDA-231 cells co-cultured for two days. Cancer cells were selected on expression of CD-44. n = 3 independent experiments. Two-way ANOVA, Sidak’s multiple comparison. c Schematic of surface biotinylation. d Association of Rab11b with biotinylated surface proteins determined by immunoprecipitation and immunoblotting. e Retention of total or surface biotin following surface biotinylation with biotin-PE. n = 2 independent experiments. Two-way ANOVA, Sidak’s multiple comparison. f Schematic of biotinylated surface protein isolation and proteomics. g Correlation matrix of all measured samples based on Pearson’s correlation values. h Cleveland plot of top GO terms enriched in proteins that were decreased on the surface of shRab11b cells. i Heatmap of proteins annotated with GO term cell adhesion, containing at least one predicted transmembrane domain. j Representative images of H&E and IHC for mice intracranially injected with MDA-231-tdTomato cells. IHC for cytokeratin 8 (K8), Rab11b and integrin β1 (ITGB1). Scale bar 50 μm. k Immunoblotting of total and surface lysates. l Surface integrin β1 recycling in MDA-231 cells. n = 2 independent experiments. Two-way ANOVA, Sidak’s multiple comparison. m Linear regression of data in (p). Points, mean ± s.d., color shading, 95% confidence interval. Analysis of covariance. np MDA-231 cells stained for integrin β1 and actin (phalloidin, to delineate cell boundaries) (n), or active integrin β1 and actin (o). p Corrected total cellular active integrin β1 fluorescence (CTCF) was determined for individual cells. n = 3 independent experiments. Bars, mean ± s.d. Two-sided t-test. Scale bar 15 μm. For panels (a, b, e, and l) Boxes, first to third interquartile range, line, mean, points, outliers. For all panels, *p < 0.05, **p < 0.01, ***p < 0.001, ****p < 0.0001.
Fig. 5
Fig. 5. Rab11b recycling of integrin β1 is necessary for survival in the brain microenvironment.
a Cell attachment at 6 h, normalized to Matrigel control. n = 3 independent experiments. Bars, mean ± s.d. Two-way ANOVA, Sidak’s multiple comparison. b Representative images of actin (phalloidin, red) and nuclei (DAPI, blue) for cells plated on poly-l-lysine or Collagen I for 24 h. Scale bar 20 μm. Right, quantification of cell area and longest dimension. n = 3 independent experiments. Bars, mean ± s.d. ANOVA, Tukey’s multiple comparison. c Cells suspended for 1 h at 37 °C, then plated to allow adhesion complex formation. Immunoblots showing signaling during adhesion. Bottom, quantification of pFAK in MDA-231, presented relative to FAK normalized to actin. n = 3. d Top, representative images of cells grown in soft agar for three weeks. Bottom, quantification of colony number and size. n = 10 fields per 3 independent experiments. Scale bar 1 mm. e Immunoblots showing signaling after 6 h adhesion to poly-l-lysine (pLL) or Collagen I (Col I). f Immunoblots showing signaling after 1 h incubation with P5D2 or 12G10, followed by 6 h adhesion to Col I. g Quantification of colony number and size for cells treated with P5D2 or 12G10 and grown in soft agar for two weeks. Ten fields per condition. h Quantification of EdU incorporation for cells adhering to decellularized brain matrix. Ten fields per condition. i Corrected total cellular active integrin β1 fluorescence (CTCF). n = 3 independent experiments. Bars, mean ± s.d. Two-sided t-test. (jl). j Representative images of actin (phalloidin, red) protrusions (arrowheads) for cells treated with P5D2 or 12G10 and allowed to adhere to decellularized brain matrix for 48 h. Scale bar 25 μm. k Actin staining used to quantify cell area and longest dimension. Bars, mean ± s.d. ANOVA, Tukey’s multiple comparison. l Quantification of EdU incorporation. Ten fields per condition. Bars, mean ± s.d. ANOVA, Tukey’s multiple comparison. For panels (c, d, g, h), bars, mean ± s.d. Two-way ANOVA, Sidak’s multiple comparison. For all panels, *p < 0.05, **p < 0.01, ***p < 0.001, ****p < 0.0001.
Fig. 6
Fig. 6. Statins decrease Rab11b localization and function.
a Schematic of the mevalonate pathway leading to Rab11b geranylgeranylation. b Quantification of cells grown in soft agar. Bottom, representative images. Scale bar 1 mm. c Quantification of colony size and number for MDA-231 cells grown in soft agar with 1 μM pitavastatin/simvastatin, with 100 μM mevalonic acid or 10 μM geranylgeranylpyrophosphate. d Quantification of MDA-231 cells grown in soft agar with vehicle or 1 μM pitavastatin or simvastatin. e MDA-231 cells grown with vehicle or 10 μM-100 nM pitavastatin/simvastatin for 24 h. Immunoblotting of soluble and insoluble fractions separated with Triton X-114. f Rab11b activation assay for MDA-231 cells treated with vehicle or 1 μM pitavastatin/simvastatin for 24 h, followed by immunoblotting. g Transferrin receptor recycling in MDA-231 cells treated with vehicle or 1 μM pitavastatin or simvastatin. h Surface integrin β1 recycling in MDA-231 cells treated with vehicle or 1 μM pitavastatin/simvastatin. (i-l) MDA-231 cells treated with 1 μM pitavastatin or simvastatin and adhered to decellularized murine brain matrix for 48 h. (I) Representative images of actin (phalloidin, green) protrusions (arrowheads), active integrin β1 (12G10, red), and nuclei (DAPI, blue). Scale bar 10 μm. j Quantification of cell area and longest dimension. k Corrected total cellular active integrin β1 fluorescence (CTCF). l Quantification of EdU. mo MDA-231 cells treated with 1 μM pitavastatin or simvastatin and 12G10, and adhered to decellularized murine brain matrix for 48 h. m Representative images of actin (phalloidin, red) protrusions (arrowheads). Scale bar 10 μm. n Quantification of cell area and longest dimension. o Quantification of EdU. For panels (b, c), n = 10 fields per 3 independent experiments. Bars, mean ± s.d. Two-way ANOVA, Sidak’s multiple comparison. For panels g, h, n = 2 independent experiments. Boxes, first to third interquartile range, line, mean, points, outliers. Two-way ANOVA, Sidak’s multiple comparison. For panels (j, k, n), n = 3 independent experiments. Bars, mean ± s.d. ANOVA, Tukey’s multiple comparison. For panels (l, o), n = 10 fields per 3 independent experiments. Bars, mean ± s.d. ANOVA, Tukey’s multiple comparison. For all panels, *p < 0.05, **p < 0.01, ***p < 0.001, ****p < 0.0001.
Fig. 7
Fig. 7. Statins decrease breast cancer brain metastasis and improve survival.
ac MDA-231-Br-GFP cells were intracardially injected, and given daily intraperitoneal injections of vehicle or 1 mg/kg pitavastatin or 5 mg/kg simvastatin. a Incidence of brain metastasis determined by visible GFP signal at 28 dpi. Analysis of contingency, Fisher’s exact test. b Quantification of Ki-67 staining for proliferation. n = 2 independent experiments. Bars, mean ± s.d. ANOVA, Tukey’s multiple comparison. c Survival determined by daily monitoring for the apearance of neurological symptoms or euthanasia criteria. Log rank test. dg MDA-231-tdTomato cells were intracranially injected, and given daily intraperitoneal injections of vehicle or 1 mg/kg pitavastatin or 5 mg/kg simvastatin. d Representative images of brain metastasis at 34 dpi. e Quantification of Ki-67 staining for proliferation. n = 2 independent experiments. Bars, mean ± s.d. ANOVA, Tukey’s multiple comparison. f Scoring of ITGB1 immunostaining. n = 2 independent experiments. Analysis of contingency, Fisher’s exact test. g Representative images of Rab11b and ITGB1 immunostaining. Scale bar 100 μm. For all panels, *p < 0.05, **p < 0.01, ***p < 0.001, ****p < 0.0001.

References

    1. Carson MJ, Doose JM, Melchior B, Schmid CD, Ploix CC. CNS immune privilege: hiding in plain sight. Immunol. Rev. 2006;213:48–65. - PMC - PubMed
    1. Kotecki N, Lefranc F, Devriendt D, Awada A. Therapy of breast cancer brain metastases: challenges, emerging treatments and perspectives. Ther. Adv. Med. Oncol. 2018;10:1758835918780312. - PMC - PubMed
    1. Massagué J, Obenauf AC. Metastatic colonization by circulating tumour cells. Nature. 2016;529:298–306. - PMC - PubMed
    1. Sosa MS, Bragado P, Aguirre-Ghiso JA. Mechanisms of disseminated cancer cell dormancy: an awakening field. Nat. Rev. Cancer. 2014;14:611–622. - PMC - PubMed
    1. Celià-Terrassa T, Kang Y. Metastatic niche functions and therapeutic opportunities. Nat. Cell Biol. 2018;20:868–877. - PubMed

Publication types

MeSH terms