. 2020 Jun 15;10(1):9649.
doi: 10.1038/s41598-020-66202-7.

3D Magnetic Resonance Spirometry

Affiliations

3D Magnetic Resonance Spirometry

Tanguy Boucneau et al. Sci Rep. .

Erratum in

Abstract

Spirometry is today the gold standard technique for assessing pulmonary ventilatory function in humans. From the shape of a flow-volume loop measured while the patient is performing forced respiratory cycles, the Forced Vital Capacity (FVC) and the Forced Expiratory Volume in one second (FEV1) can be inferred, and the pulmonologist is able to detect and characterize common respiratory afflictions. This technique is non-invasive, simple, widely available, robust, repeatable and reproducible. Yet, its outcomes rely on the patient's cooperation and provide only global information over the lung. With 3D Magnetic Resonance (MR) Spirometry, local ventilation can be assessed by MRI anywhere in the lung while the patient is freely breathing. The larger dimensionality of 3D MR Spirometry advantageously allows the extraction of original metrics that characterize the anisotropic and hysteretic regional mechanical behavior of the lung. Here, we demonstrated the potential of this technique on a healthy human volunteer breathing along different respiratory patterns during the MR acquisition. These new results are discussed with lung physiology and recent pulmonary CT data. As respiratory mechanics inherently support lung ventilation, 3D MR Spirometry may open a new way to non-invasively explore lung function while providing improved diagnosis of localized pulmonary diseases.


Conflict of interest statement

Dr. Tanguy Boucneau and Dr. Brice Fernandez are today employees of the company GE Healthcare. The other authors declare no conflicts of interest.

Figures
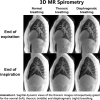
Figure 1
Figure 1
Sagittal views of the thoracic images retrospectively gated at the end of expiration (top) and at the end of inspiration (bottom) for the normal (left), thoracic (middle) and diaphragmatic (right) breathing patterns. On every image at the end of inspiration, the red curve depicts the border of the lung observed in the corresponding expiratory state shown above. As pointed out by the red arrows, it clearly stresses the respective motions of the diaphragm and the thoracic wall for each breathing pattern. The respiratory dynamics are provided as supplementary materials.
Figure 2
Figure 2
Sagittal (top) and coronal (bottom) views of the trajectories followed by elementary volumes of the right lung parenchyma, located at red dots positions at the end of expiration. For the sake of clarity, only one percent of the trajectories is shown. These trajectories are pictured for the normal (left), thoracic (middle) and diaphragmatic (right) breathing patterns. In each trajectory, the inspiration phase is represented in yellow and the expiration phase is represented in blue. In the top left-hand corner of each represented breathing pattern, a focus on one representative trajectory (location depicted by the small red squares) is given. A UTE MR image is given on the right of each row as an anatomical reference.
Figure 3
Figure 3
Representation of 8 out of 32 sagittal views (every 4th) showing the evolution of the J map throughout the gated time-average respiratory cycle for the normal (top), thoracic (middle) and diaphragmatic (bottom) breathing patterns.
Figure 4
Figure 4
Coronal views of the different components of the Green-Lagrange strain tensor εxxG (along the superior-inferior direction), εyyG (along the left-right direction), εzzG (along the anterior-posterior direction), εxyG, εyzG, and εxzG for normal, thoracic and diaphragmatic breathing patterns.
Figure 5
Figure 5
Coronal views of the three principal strain components, εIG, εIIG, and εIIIG, for normal, thoracic, and diaphragmatic breathing patterns.
Figure 6
Figure 6
Coronal views of Fractional Anisotropy, FA, maps for normal, thoracic, and diaphragmatic breathing patterns.
Figure 7
Figure 7
Axial, sagittal and coronal views from the 3D UTE dataset at the end of expiration, and over which are superimposed the regional flow-volume loops estimated with 3D MR Spirometry (only one every 20th) for thoracic breathing. For each local loop, the global loop representing the flow-volume for the entire lung is also drawn for reference (green). In the bottom right-hand corner, we showed the color and axis conventions for the local and global loops.

References

    1. Miller MR, et al. Standardisation of spirometry. European Respiratory Journal. 2005;26:319–338. doi: 10.1183/09031936.05.00034805. - DOI - PubMed
    1. Deninger AJ, et al. Quantitative measurement of regional lung ventilation using 3He MRI. Magnetic Resonance in Medicine. 2002;48:223–232. doi: 10.1002/mrm.10206. - DOI - PubMed
    1. Patz S, et al. Hyperpolarized 129Xe MRI: A viable functional lung imaging modality? European Journal of Radiology. 2007;64:335–344. doi: 10.1016/j.ejrad.2007.08.008. - DOI - PMC - PubMed
    1. Couch MJ, et al. Inert fluorinated gas MRI: a new pulmonary imaging modality. NMR in Biomedicine. 2014;27:1525–1534. doi: 10.1002/nbm.3165. - DOI - PubMed
    1. Edelman RR, Hatabu H, Tadamura E, Li W, Prasad PV. Noninvasive assessment of regional ventilation in the human lung using oxygen–enhanced magnetic resonance imaging. Nature Medicine. 1996;2:1236. doi: 10.1038/nm1196-1236. - DOI - PubMed

Publication types