. 2020 Aug;21(8):880-891.
doi: 10.1038/s41590-020-0697-2. Epub 2020 Jun 15.

Guanylate-binding proteins convert cytosolic bacteria into caspase-4 signaling platforms

Affiliations

Guanylate-binding proteins convert cytosolic bacteria into caspase-4 signaling platforms

Michal P Wandel et al. Nat Immunol. 2020 Aug.

Abstract

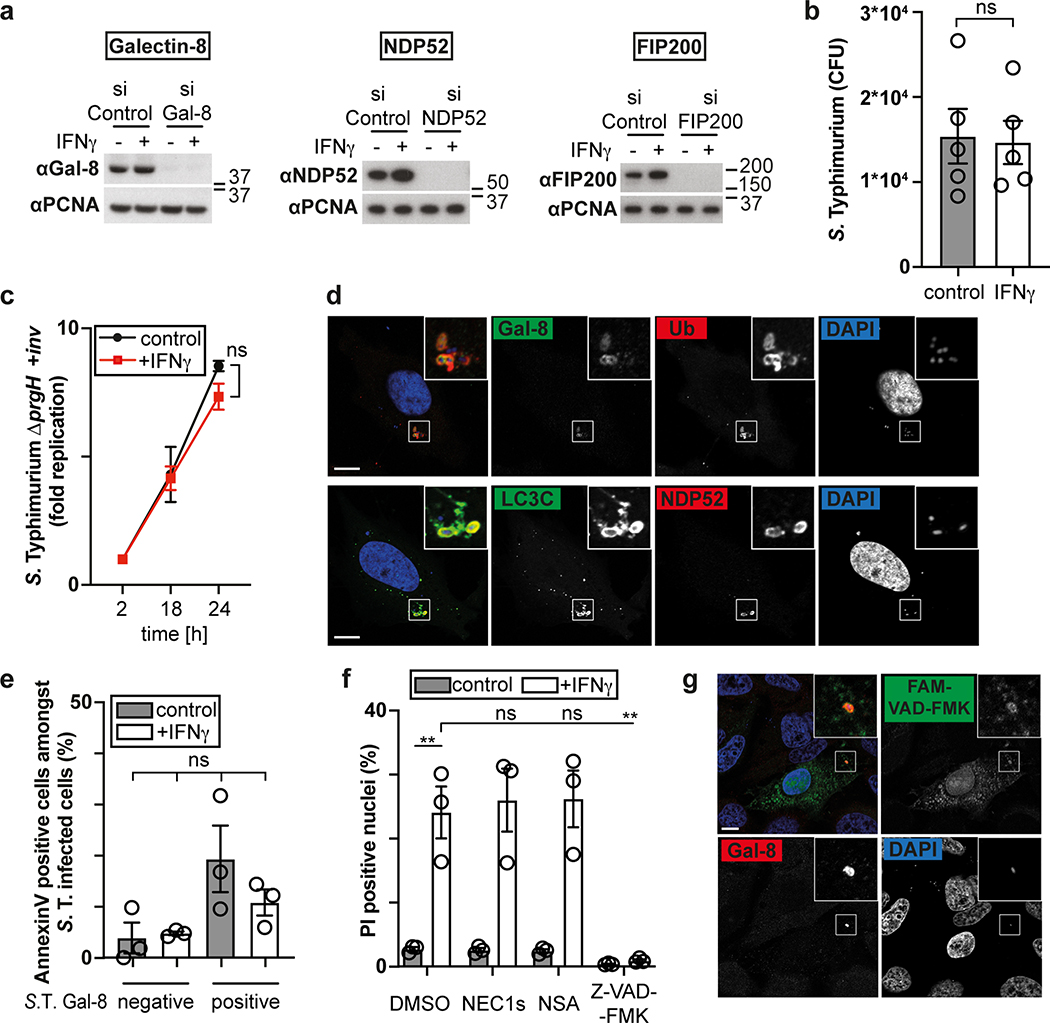
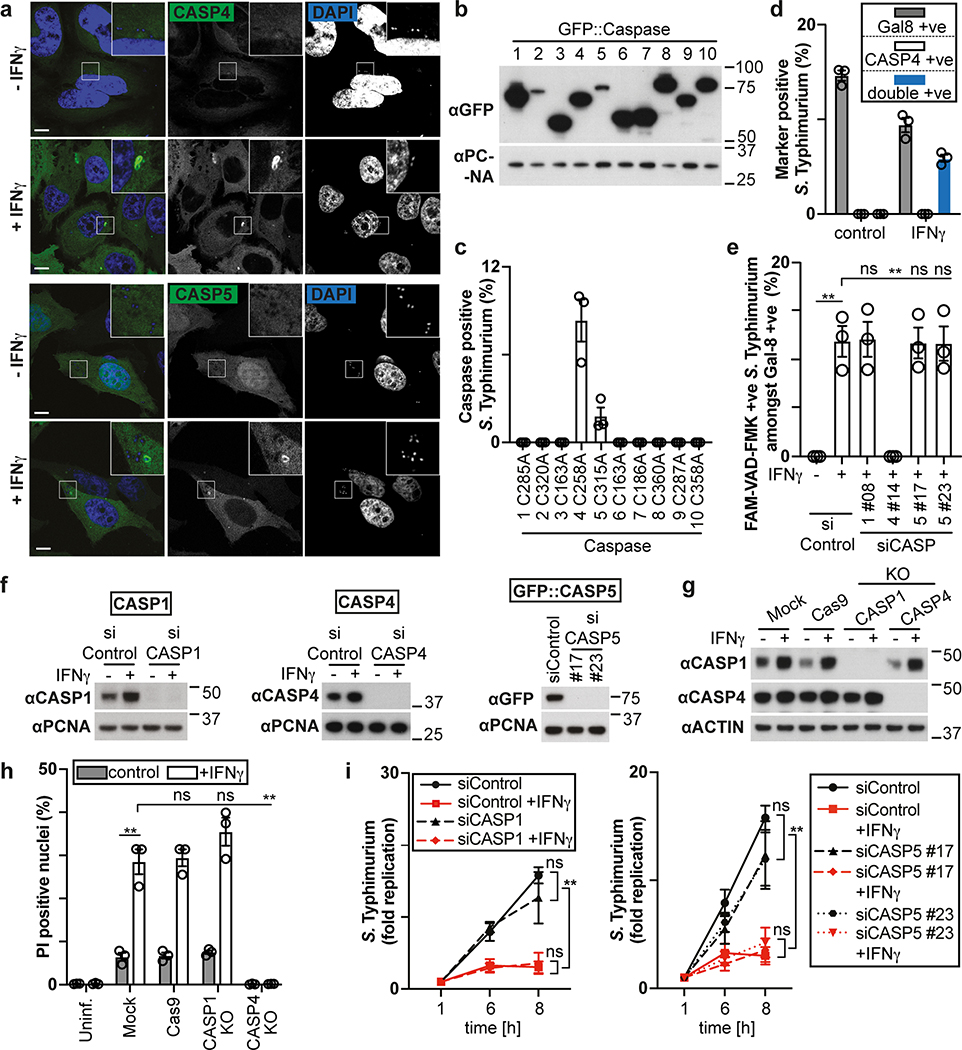
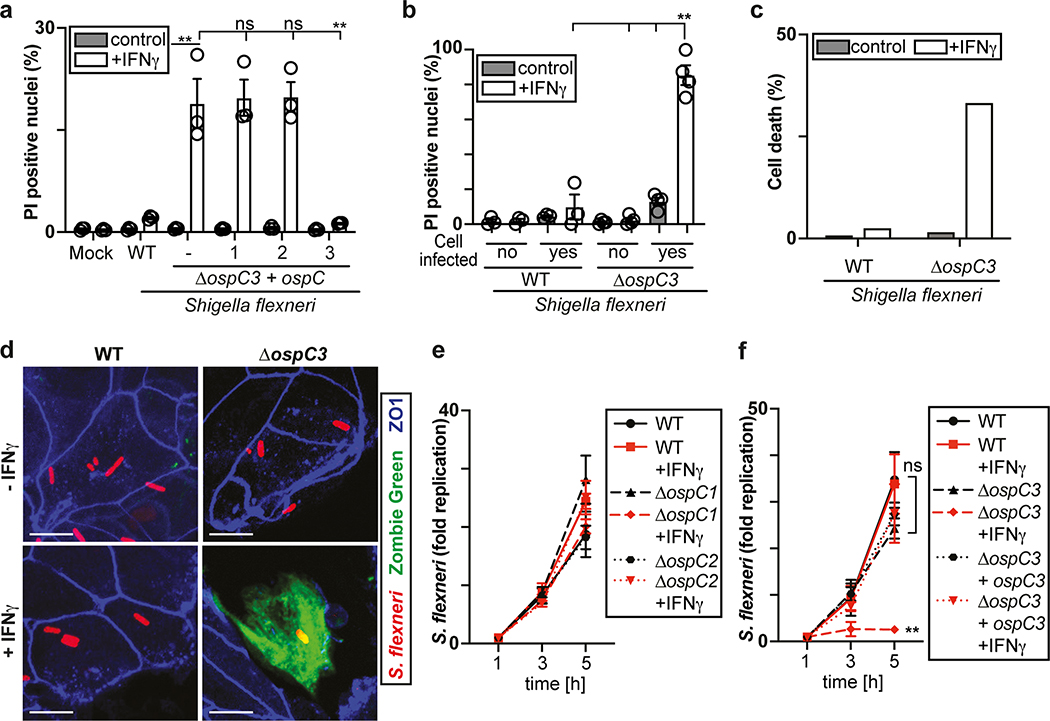
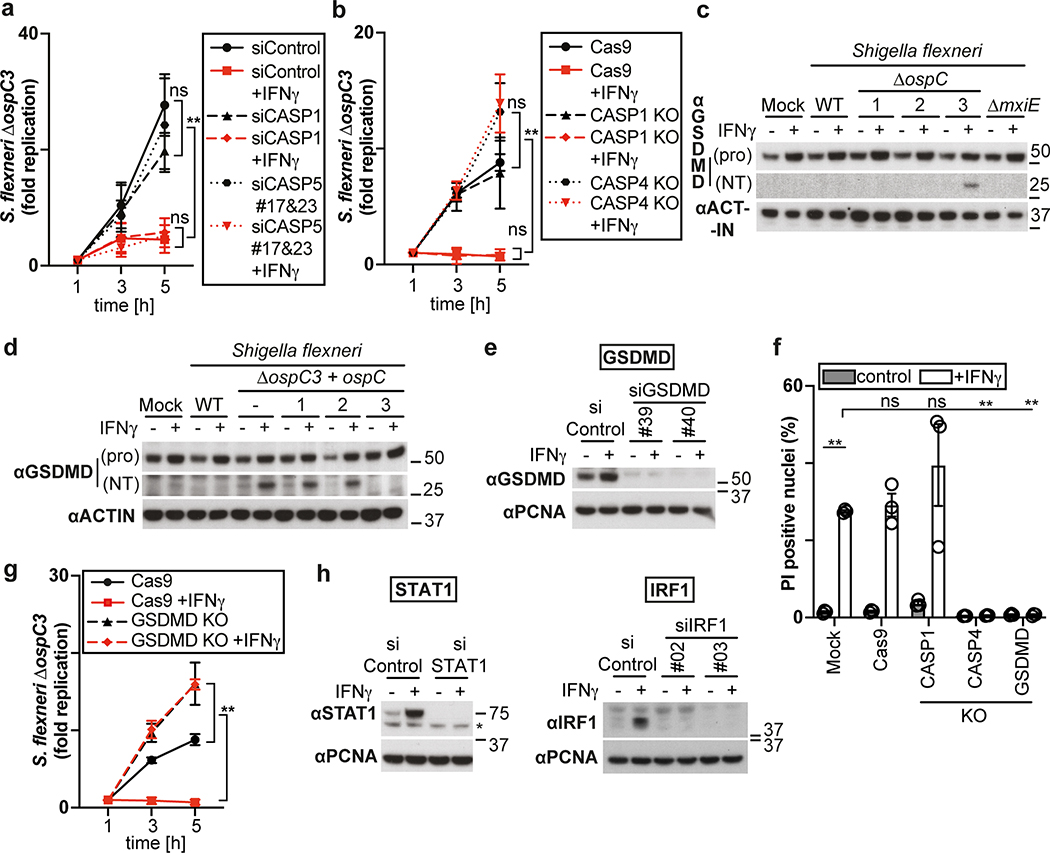
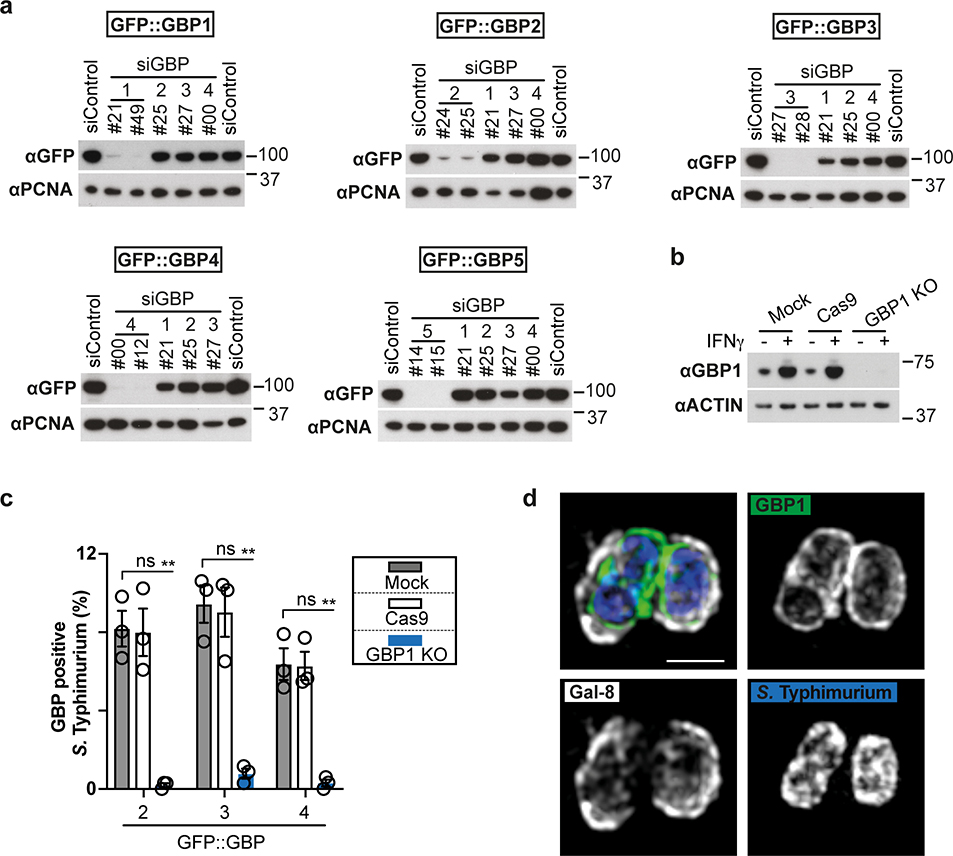
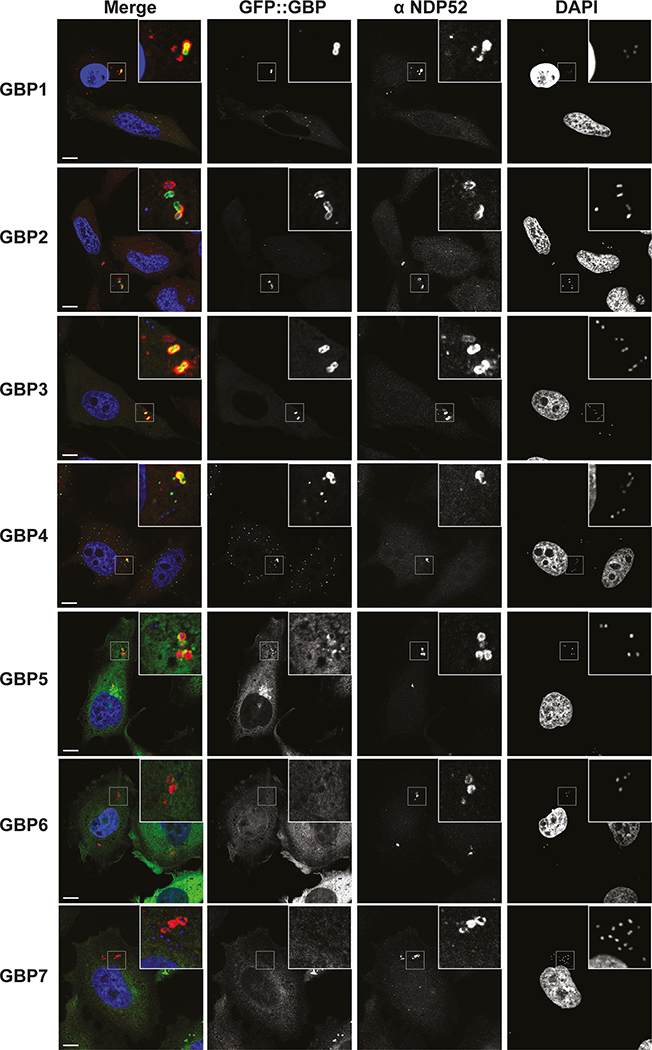
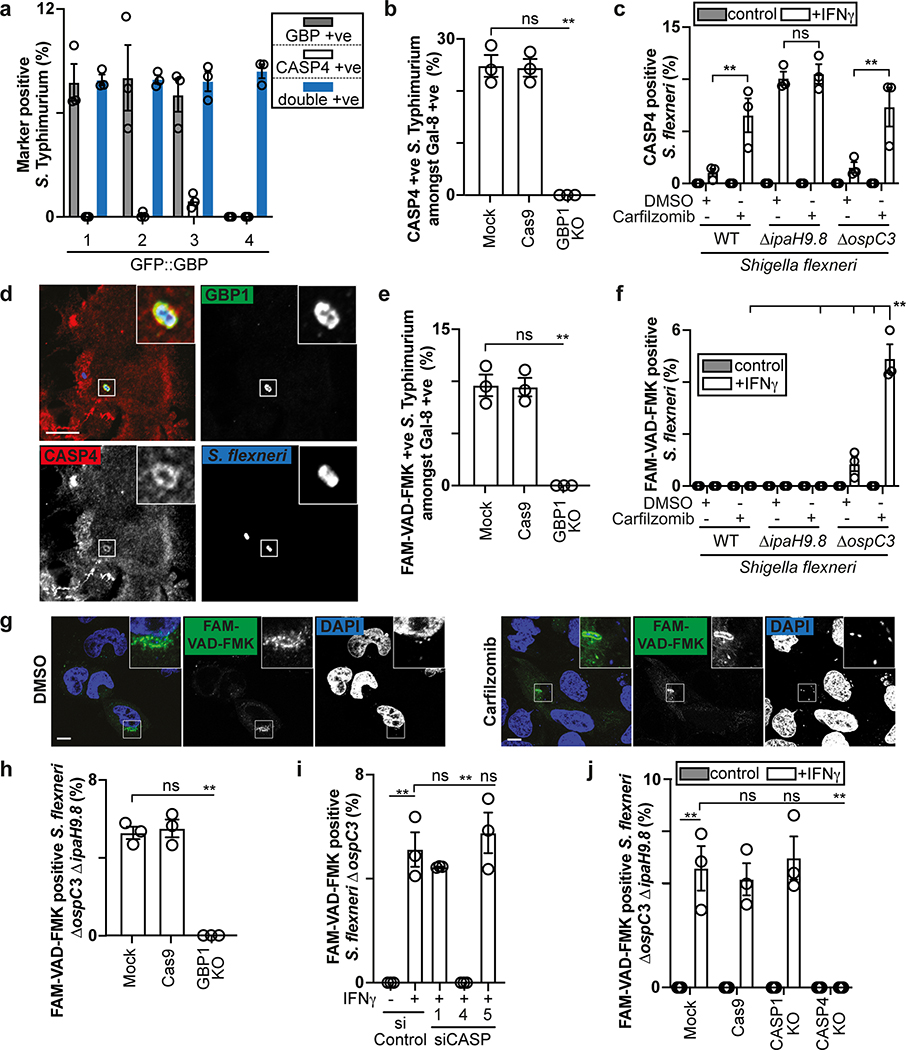
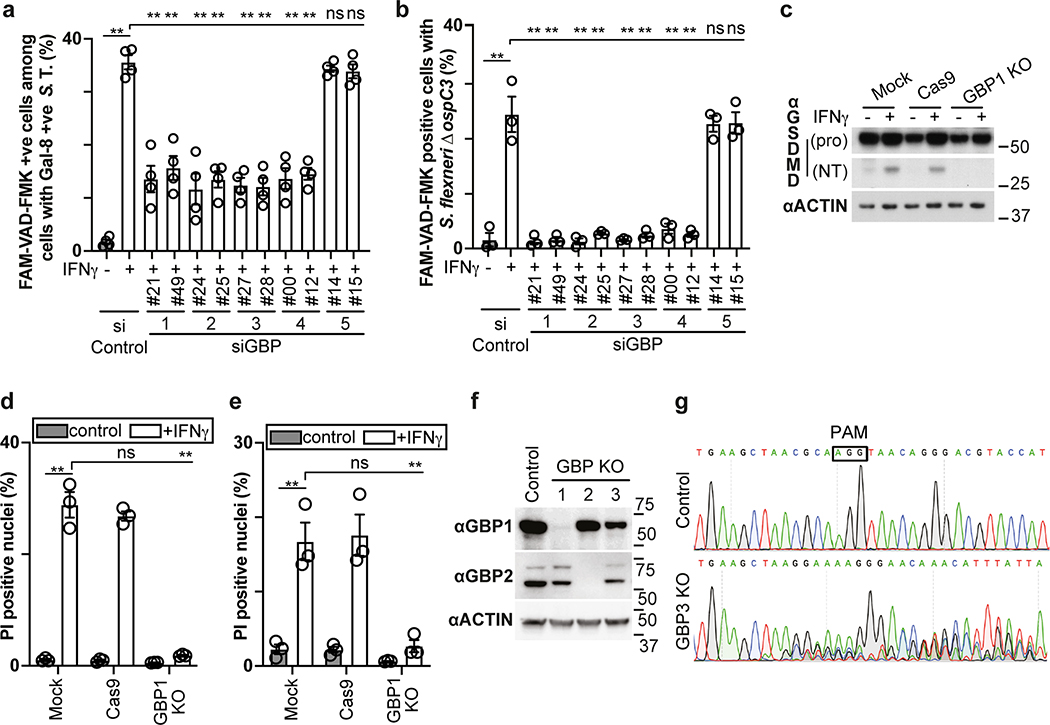
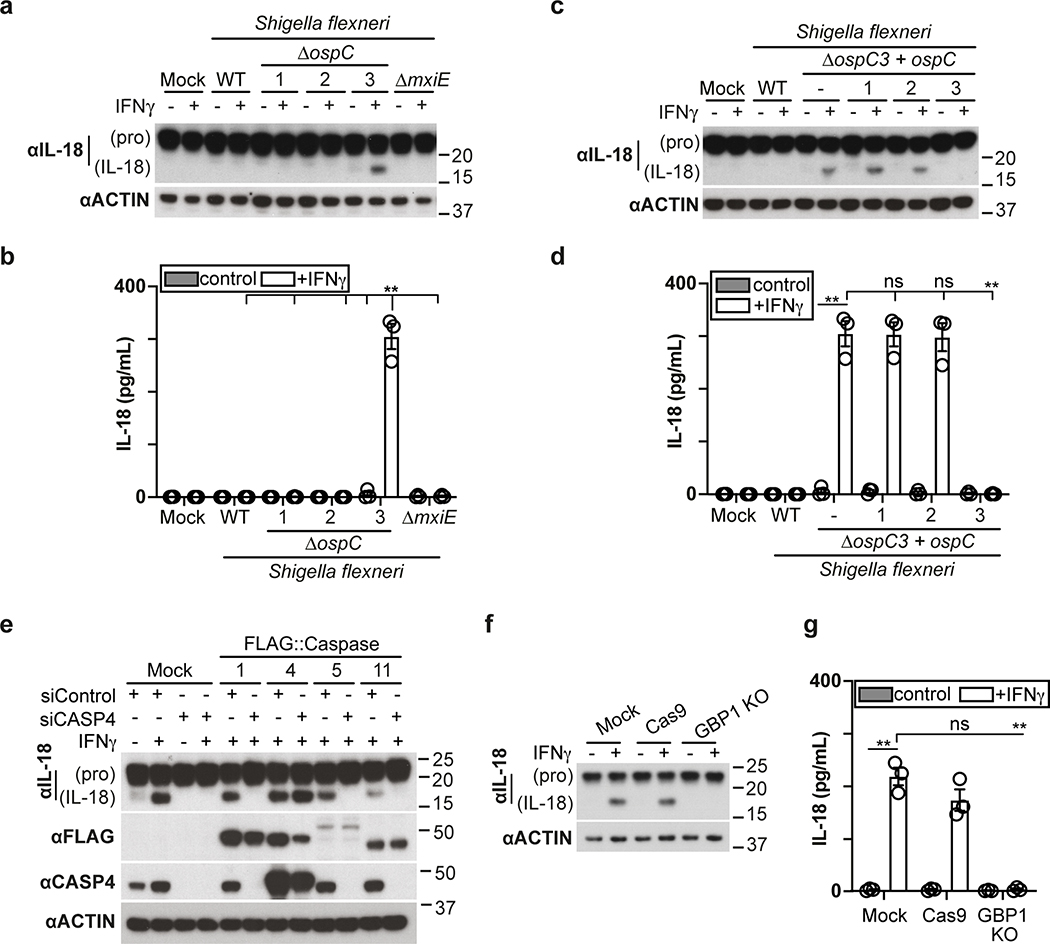
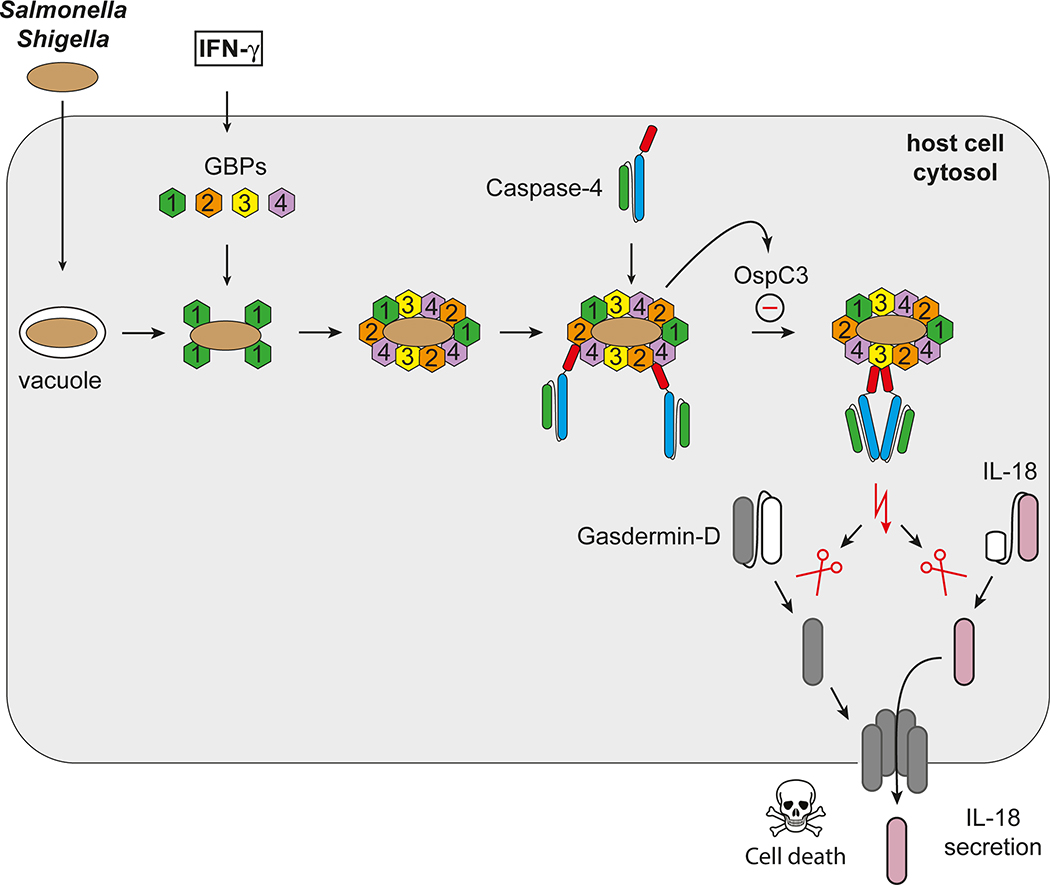
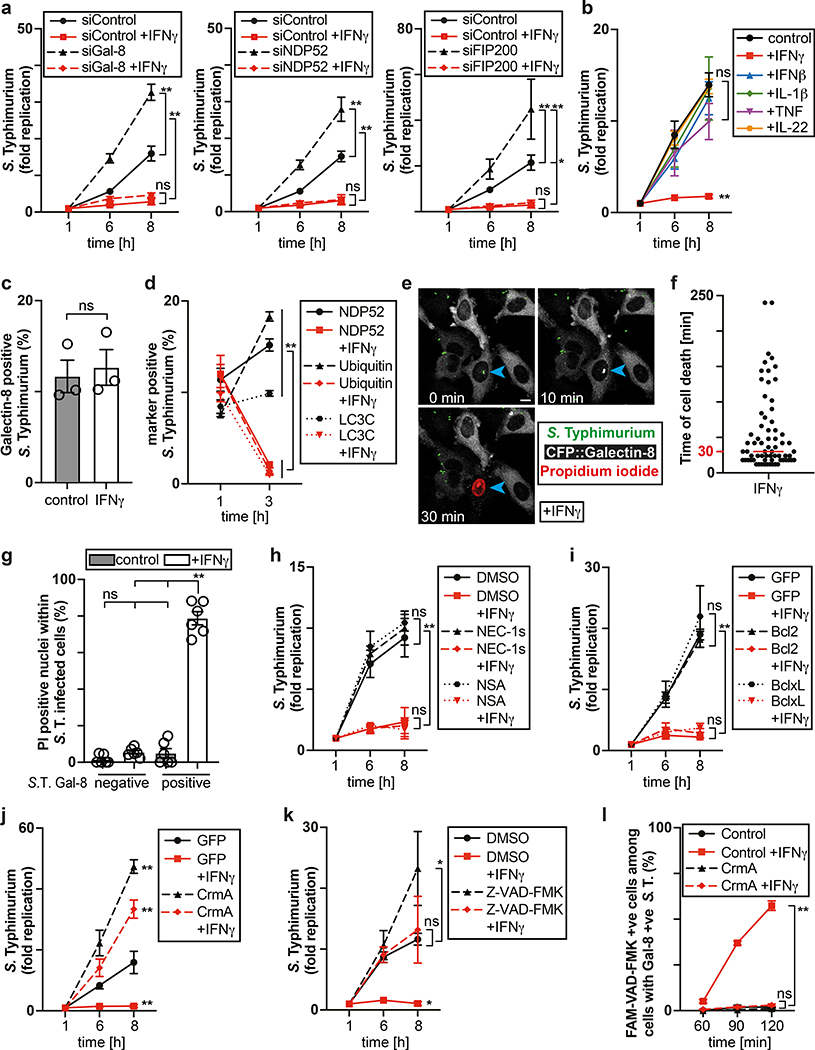
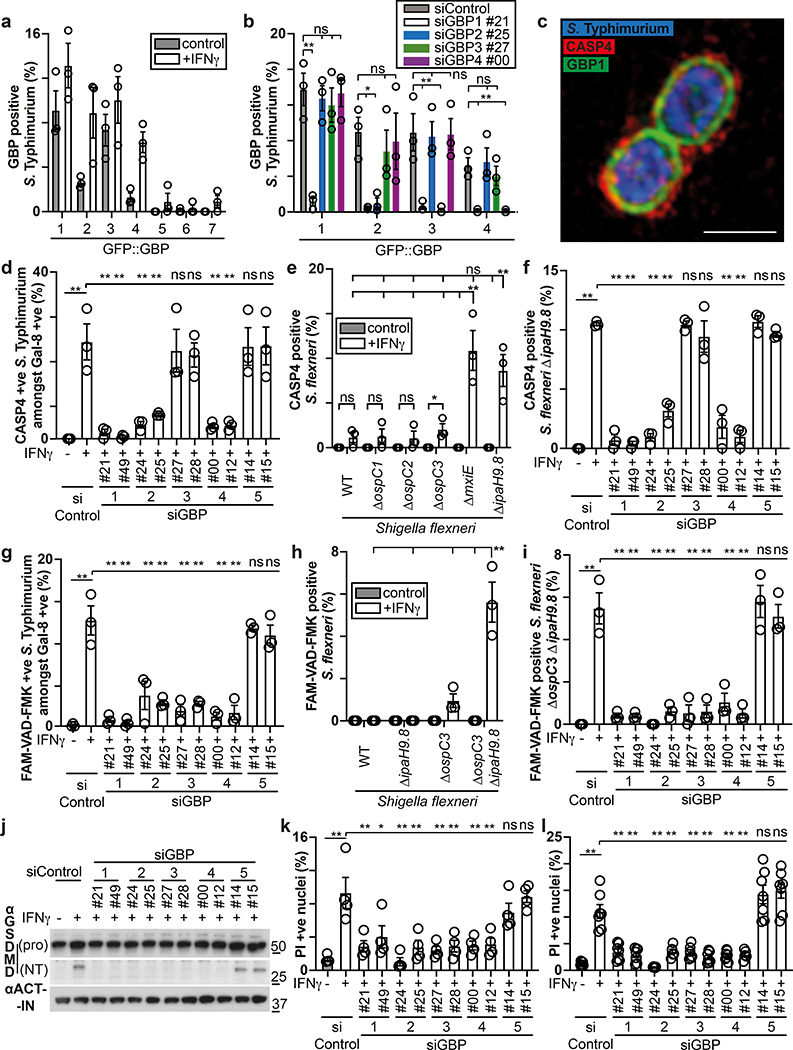
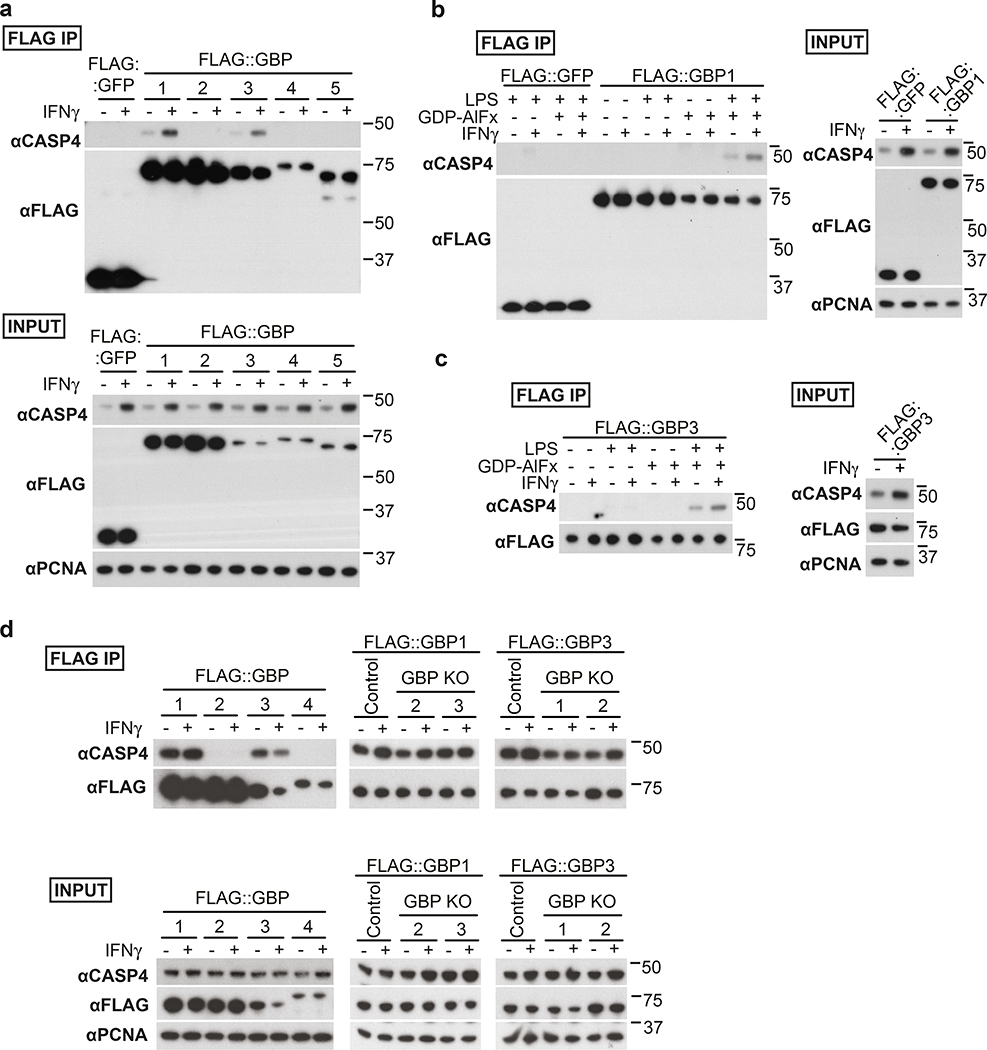
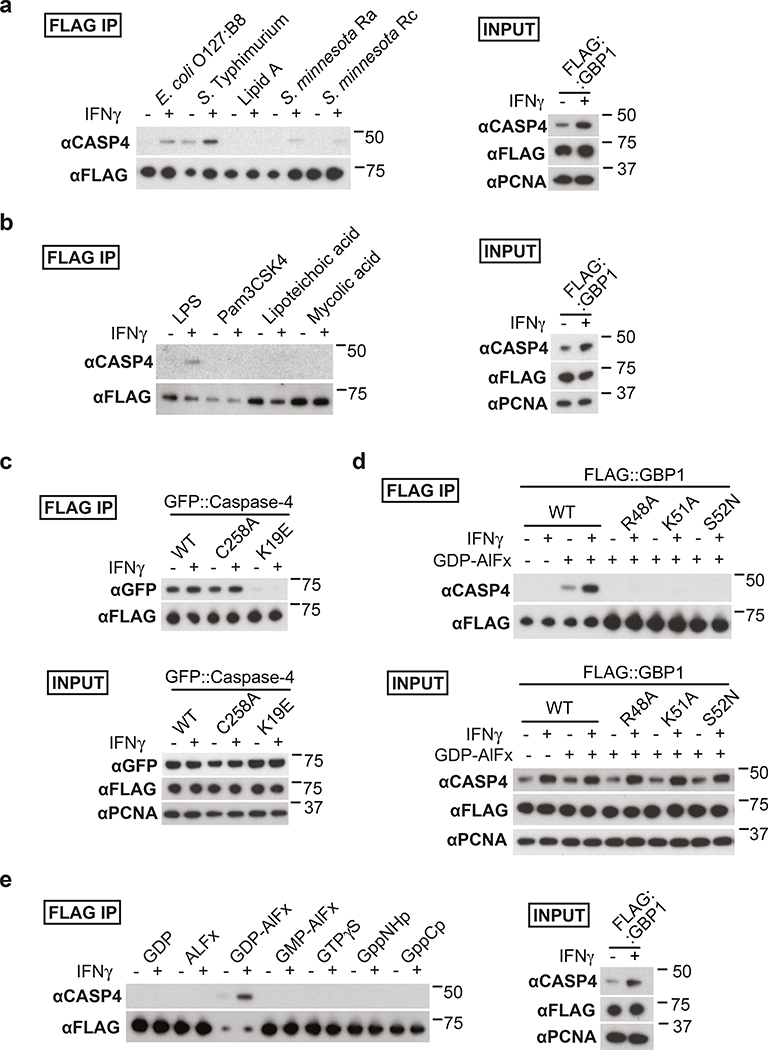
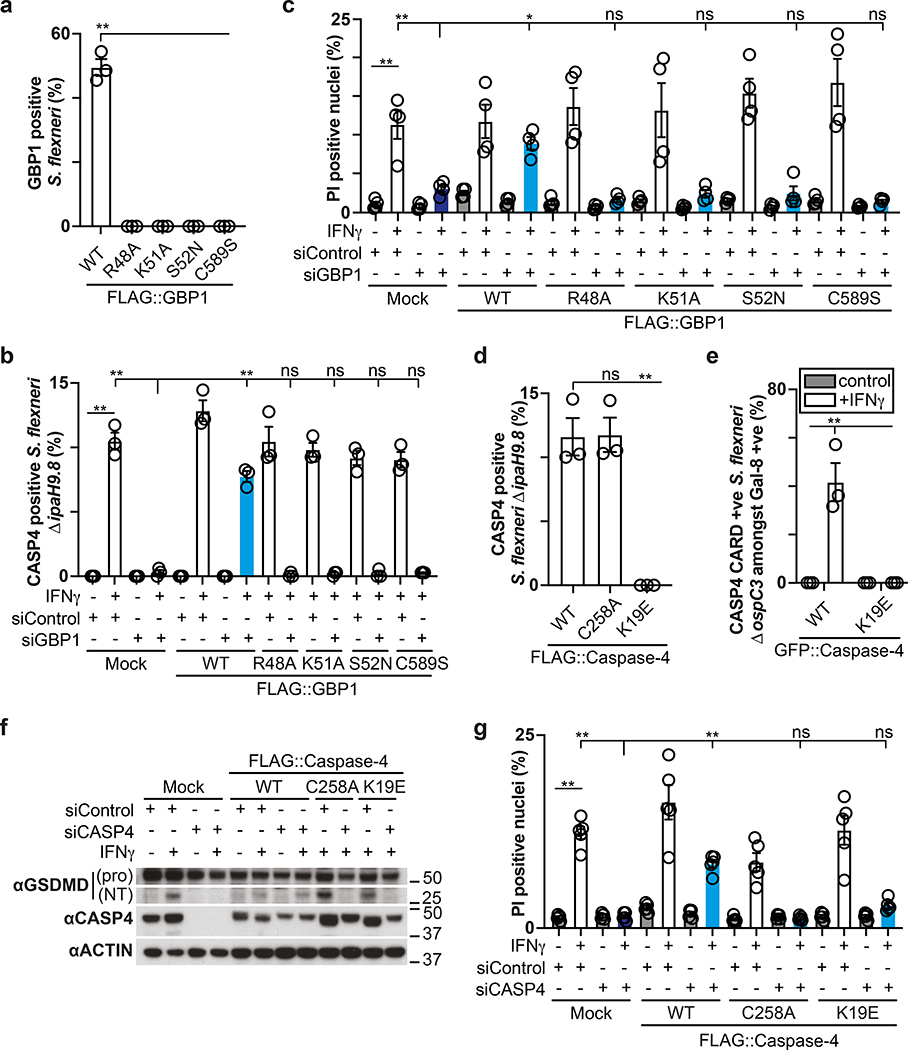
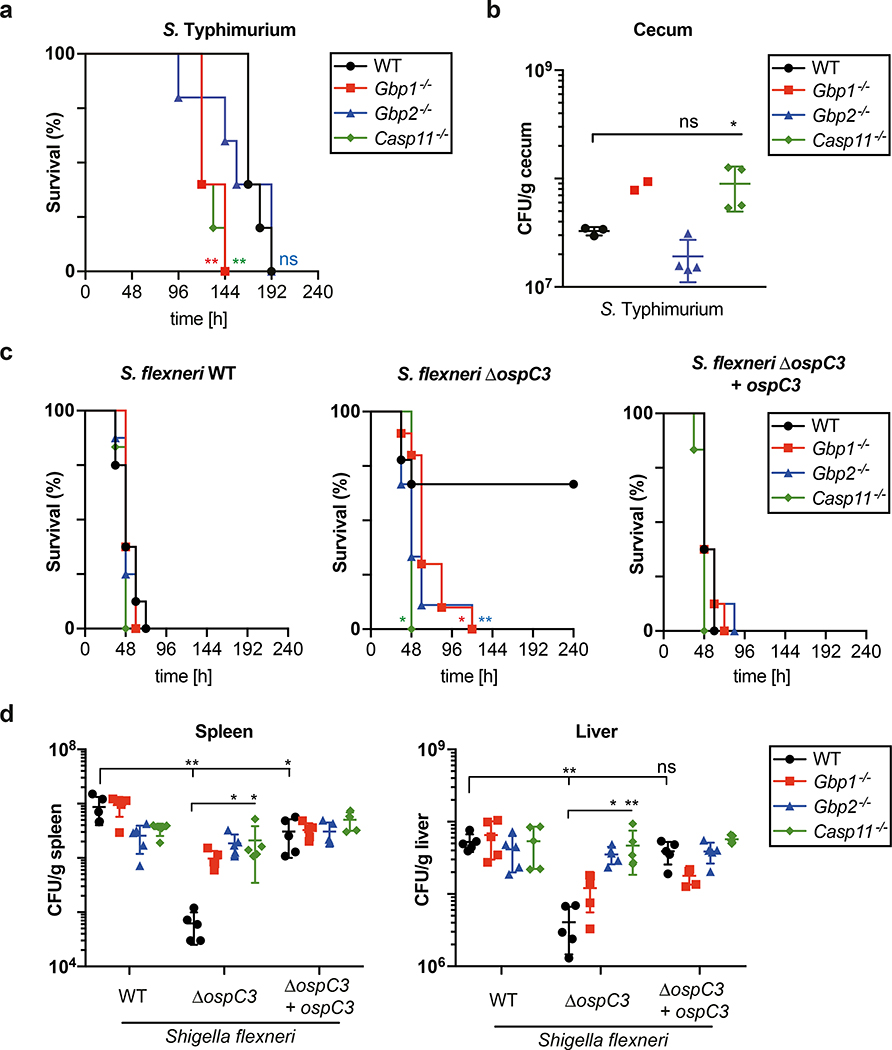
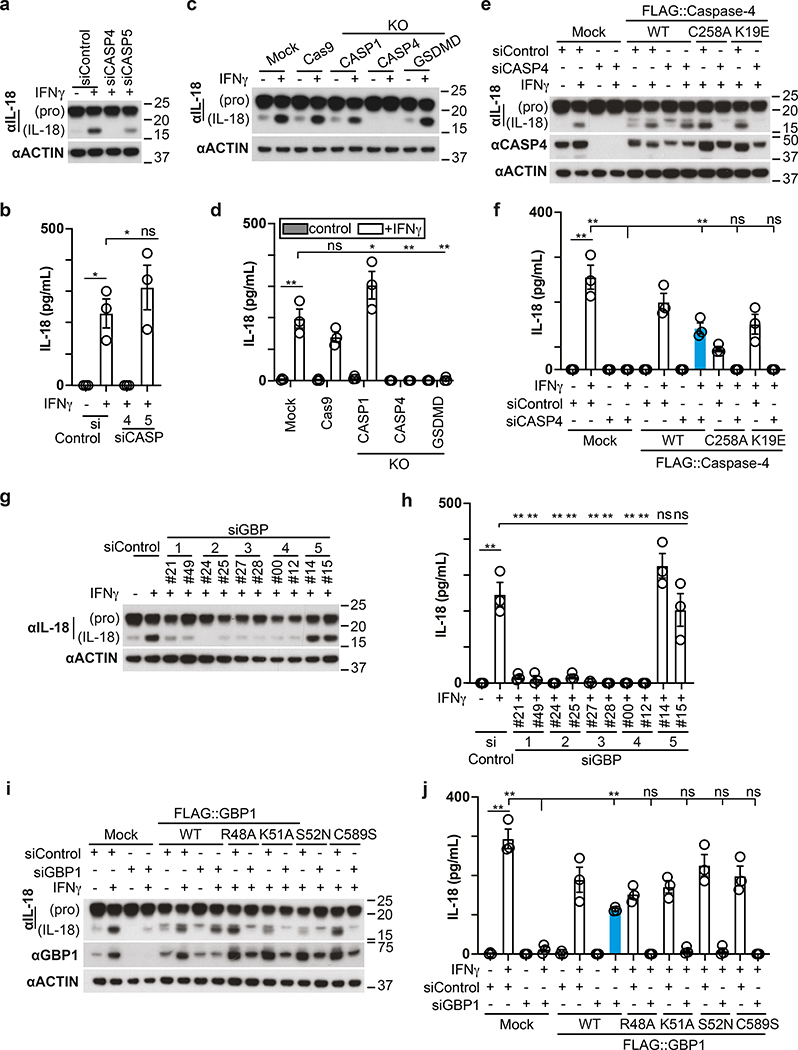
Bacterial lipopolysaccharide triggers human caspase-4 (murine caspase-11) to cleave gasdermin-D and induce pyroptotic cell death. How lipopolysaccharide sequestered in the membranes of cytosol-invading bacteria activates caspases remains unknown. Here we show that in interferon-γ-stimulated cells guanylate-binding proteins (GBPs) assemble on the surface of Gram-negative bacteria into polyvalent signaling platforms required for activation of caspase-4. Caspase-4 activation is hierarchically controlled by GBPs; GBP1 initiates platform assembly, GBP2 and GBP4 control caspase-4 recruitment, and GBP3 governs caspase-4 activation. In response to cytosol-invading bacteria, activation of caspase-4 through the GBP platform is essential to induce gasdermin-D-dependent pyroptosis and processing of interleukin-18, thereby destroying the replicative niche for intracellular bacteria and alerting neighboring cells, respectively. Caspase-11 and GBPs epistatically protect mice against lethal bacterial challenge. Multiple antagonists of the pathway encoded by Shigella flexneri, a cytosol-adapted bacterium, provide compelling evolutionary evidence for the importance of the GBP-caspase-4 pathway in antibacterial defense.


Conflict of interest statement

Competing interests

The authors declare no competing interests

Figures

Extended Data Fig. 1
Extended Data Fig. 1. IFN-γ prevents proliferation of cytosol-invading S. Typhimurium
a, Lysates of HeLa cells treated with the indicated siRNAs. Blots were probed with the indicated antibodies, PCNA – loading control. b, Colony-forming units (CFU) of S. Typhimurium in HeLa cells at 1h p.i.. c, Fold replication of S. Typhimurium ΔprgH +inv in HeLa cells. d, Confocal micrographs of HeLa cells infected with S. Typhimurium taken at 1 h p.i. stained with DAPI and antibodies against Galectin-8 and ubiquitin (FK2 antibody) (top panel) or over-expressing GFP::LC3C and stained with DAPI and antibody against NDP52 (bottom panel). e, Percentage of Annexin V positive Hela cells expressing CFP::Galectin-8 amongst cells harbouring intracellular S. Typhimurium. Negative or positive – none or at least one bacterium per cell positive for CFP::Galectin-8. Live imaged every 6 min for 6 h, 12 fields per condition. f, Percentage of PI positive nuclei in HeLa cells infected with S. Typhimurium at 2h p.i.. Cells were treated with DMSO, 50 μM NEC-1s, 10 μM NSA or 50 μM Z-VAD-FMK as indicated. g, Confocal micrograph of HeLa cells infected with S. Typhimurium in the presence of FAM-VAD-FMK and stained with DAPI and antibody against Galectin-8. Image taken at 90 min p.i.. Statistical significance was assessed by two-tailed unpaired Student’s t-test (b), one-way (e,f) or two-way (c) analysis of variance (ANOVA) with Tukey’s multiple comparisons test; ns, not significant, **P < 0.01 (exact p values are provided in Supplementary Table 1). Data are expressed as the Mean ± SEM of three (c,e,f) or five (b) independent experiments, or representative of two (a) or three (d,g) independent experiments. HeLa cells were treated with IFN-γ (g) or treated with IFN-γ as indicated (a-c,e,f). Bacteria were counted based on their ability to grow on agar plates (b,c). Scale bar, 10 μm (d,g). Uncropped blots (a) are shown in the Source Data. PI - propidium iodide, p.i. - post-infection, S.T. - S. Typhimurium.
Extended Data Fig. 2
Extended Data Fig. 2. Cytosol-invading bacteria recruit caspase-4
a, Confocal micrographs of HeLa cells over-expressing GFP::Caspase-4 or −5 at 1 h p.i. with S. Typhimurium and stained with DAPI. Scale bar, 10 μm. b,f,g, Lysates of HeLa cells expressing the indicated GFP::Caspase constructs (b), of cells treated with the indicated siRNAs (f), or of the indicated control or knock-out cells (g). Blots were probed with indicated antibodies, PCNA (b,f), Actin (g) – loading control. Samples in Extended Data Fig. 2g, Fig. 2p and Fig. 8c were obtained from the same experiment. c,d, Percentage of S. Typhimurium positive for the indicated GFP::Caspase constructs (c) or staining positive for endogenous Galectin-8 and/or Caspase-4 (d) in HeLa cells at 1 h p.i.. n > 100 bacteria per coverslip, in triplicate. e, Percentage of FAM-VAD-FMK positive S. Typhimurium amongst bacteria staining positive for endogenous Galectin-8 at 90 min p.i. in HeLa cells treated with siRNAs against caspases as indicated. n > 100 Galectin-8 +ve bacteria per coverslip, in triplicate. h, Percentage of PI positive nuclei in the indicated control or knock-out HeLa cells uninfected or infected with S. Typhimurium at 2h p.i.. i, Fold replication of S. Typhimurium in HeLa cells treated with the indicated siRNAs against caspases. Bacteria were counted based on their ability to grow on agar plates. Statistical significance was assessed by one-way (e,h) or two-way (i) analysis of variance (ANOVA) with Tukey’s multiple comparisons test; ns, not significant, **P < 0.01 (exact p values are provided in Supplementary Table 1). Data are expressed as the Mean ± SEM of three (c,d,e,i) independent experiments, or representative of two (b,f,g) or three (a) independent experiments. HeLa cells were treated with IFN-γ (c) or treated with IFN-γ as indicated (a,d-i). Uncropped blots (b,f,g) are shown in the Source Data. PI - propidium iodide, p.i. - post-infection, +ve – positive.
Extended Data Fig. 3
Extended Data Fig. 3. The S. flexneri effector OspC3 inhibits interferon-induced pyroptosis
a, PI positive nuclei in HeLa cells infected with the indicated S. flexneri strains at 2h p.i.. b, Percentage of PI positive nuclei in CFP::Galectin-8 expressing HeLa cells infected with the indicated S. flexneri strains in the presence of PI. n = three (WT) and four (ΔospC3) independent repeats. Live imaged every 5 min for 5 h, 10 fields per condition. c, Percentage of Zombie Green positive (i.e. dead) cells in monolayers of differentiated human epithelial organoids at 2 h p.i. with the indicated S. flexneri strains. n > 50 infected cells per coverslip. d, Confocal micrograph of a monolayer of differentiated human epithelial organoids stained with Zombie Green and antibody against ZO-1 at 1 h p.i. with the indicated S. flexneri strains. Scale bar, 10 μm. e,f, Fold replication of the indicated S. flexneri strains in HeLa cells. Bacteria were counted based on their ability to grow on agar plates. Statistical significance was assessed by one-way (a,b) or two-way (e,f) analysis of variance (ANOVA) with Tukey’s multiple comparisons test; ns, not significant, **P < 0.01 (exact p values are provided in Supplementary Table 1). Data are expressed as the Mean ± SEM of three (a,b,e,f) or four (b) independent experiments, or representative of two (d) independent experiments. HeLa cells were treated with IFN-γ as indicated (a-f). PI - propidium iodide, p.i. - post-infection.
Extended Data Fig. 4
Extended Data Fig. 4. Cytosol-invading bacteria trigger caspase-4 and gasdermin-D dependent pyroptosis
a,b,g, Fold replication of S. flexneri ΔospC3 in HeLa cells treated with the indicated siRNAs against caspases (a) and in control or knock-out HeLa cells (b, g). Bacteria were counted based on their ability to grow on agar plates. c, d, Lysates of HeLa cells at 1 h p.i. with the indicated S. flexneri strains. Pro - full length pro-form of GSDMD (shorter exposure), NT - N-terminal domain of GSDMD (longer exposure). Samples in Extended Data Fig. 4c,d and Extended Data Fig. 9a,c were obtained from the same experiment. e,h, Lysates of HeLa cells treated with the indicated siRNAs. * unspecific band. f, PI positive nuclei in the indicated control or knock-out HeLa cells at 2 h p.i. with S. flexneri ΔospC3. Statistical significance was assessed by one-way (f) or two-way (a,b,g) analysis of variance (ANOVA) with Tukey’s multiple comparisons test; ns, not significant, **P < 0.01 (exact p values are provided in Supplementary Table 1). Data are expressed as the Mean ± SEM of three (b,g,f) or four (a) independent experiments, or representative of two (e,h) or three (c,d) independent experiments. HeLa cells were treated with IFN-γ as indicated (a-h). Blots were probed with indicated antibodies, PCNA (e,h), Actin (c,d) – loading control. Uncropped blots (c-e,h) are shown in the Source Data. PI - propidium iodide, p.i. - post-infection.
Extended Data Fig. 5
Extended Data Fig. 5. GBP1 recruits GBP2–4 to S. Typhimurium
a,b, Lysates of HeLa cells treated with the indicated siRNAs (a), or from the indicated control or knock-out cells (b). Blots were probed with indicated antibodies, PCNA (a), Actin (b) – loading control. Samples in Extended Data Fig. 5b, Extended Data Fig. 8c and Extended Data Fig. 9f were obtained from the same experiment. c, Percentage of S. Typhimurium positive for the indicated GFP::GBP constructs at 1 h p.i. in the indicated control or knock-out HeLa cells. n > 100 bacteria per coverslip, in triplicate. d, Structured illumination micrograph of HeLa cells expressing GFP::GBP1 and antibody-stained for Galectin-8 at 1 h p.i. with S. Typhimurium. Scale bar, 1 μm. Statistical significance was assessed by one-way analysis of variance (ANOVA) with Tukey’s multiple comparisons test (c); ns, not significant, **P < 0.01 (exact p values are provided in Supplementary Table 1). Data are expressed as the Mean ± SEM of three (c) independent experiments, or representative of two (a,b) or three (d) independent experiments. HeLa cells were treated with IFN-γ (c,d) or treated with IFN-γ as indicated (b). Uncropped blots (a,b) are shown in the Source Data. p.i. - post-infection.
Extended Data Fig. 6
Extended Data Fig. 6. GBPs target cytosol-invading S. Typhimurium
Confocal micrographs of HeLa cells over-expressing GFP::GBP1–7 and stained with DAPI and antibody against NDP52 at 1 h p.i. with S. Typhimurium. Representative of three independent experiments. Scale bar, 10 μm.
Extended Data Fig. 7
Extended Data Fig. 7. GBPs recruit and activate caspase-4
a, Percentage of S. Typhimurium positive for GFP::GBP1–4 and/or staining positive for endogenous Caspase-4 in HeLa cells at 1 h p.i.. n > 100 bacteria per coverslip, in triplicate. b,e, Percentage of endogenous Caspase-4 (b) or FAM-VAD-FMK (e) positive S. Typhimurium amongst bacteria staining positive for endogenous Galectin-8 in the indicated control or knock-out HeLa cells at 1h (b) or 90 min (e) p.i.. n > 100 Galectin-8 +ve bacteria per coverslip, in triplicate. c,f Percentage of endogenous Caspase-4 (c) or FAM-VAD-FMK (f) positive bacteria of the indicated S. flexneri strains in HeLa cells at 1 h p.i.. n > 100 bacteria per coverslip, in triplicate. d, Confocal micrograph of a monolayer of differentiated human epithelial organoids antibody-stained for GBP1 and Caspase-4 at 1 h p.i. with S. flexneri ΔipaH9.8. g, Confocal micrographs of HeLa cells treated with DMSO or Carfilzomib as indicated at 1h p.i. with S. flexneri ΔospC3 in the presence of FAM-VAD-FMK and stained with DAPI. h-j, Percentage of FAM-VAD-FMK positive S. flexneri ΔospC3 ΔipaH9.8 (h, j) or S. flexneri ΔospC3 (i) at 1 h p.i. in the indicated control or knock-out HeLa cells (h,j) or in HeLa cells treated with the indicated siRNAs against caspases and 1 μM Carfilzomib (i). n > 100 bacteria per coverslip, in triplicate. Statistical significance was assessed by one-way analysis of variance (ANOVA) with Tukey’s multiple comparisons test (b,c,e,f,h-j); ns, not significant, **P < 0.01 (exact p values are provided in Supplementary Table 1). Data are expressed as the Mean ± SEM of three (a-c,e,f,h-j) independent experiments, or representative of two (d,g) independent experiments. HeLa cells were treated with IFN-γ (a,b,d,e,g,h) or treated with IFN-γ as indicated (c,f,i,j). Cells were treated with DMSO or 1 μM Carfilzomib as indicated (c,f,g). Scale bar, 10 μm (d,g). p.i. - post-infection, +ve – positive.
Extended Data Fig. 8
Extended Data Fig. 8. GBPs govern gasdermin-D dependent pyroptosis
a,b, Percentage of FAM-VAD-FMK positive cells among HeLa cells containing S. Typhimurium positive for endogenous Galectin-8 at 90 min p.i. (a) or containing S. flexneri ΔospC3 at 1 h p.i. (b); cells treated with siRNAs against GBPs as indicated. n > 100 cells with Galectin-8 +ve bacteria (a) or n > 100 infected cells (b) per coverslip, in triplicate. c, Lysates of the indicated control or knock-out HeLa cells infected with S. flexneri ΔospC3 for 1h. Pro - full length pro-form of GSDMD (shorter exposure), NT - N-terminal domain of GSDMD (longer exposure). Samples in Extended Data Fig. 8c, Extended Data Fig. 5b and Extended Data Fig. 9f were obtained from the same experiment. d,e, Percentage of PI positive nuclei in the indicated control or knock-out HeLa cells at 2 h p.i. with S. Typhimurium (e) or S. flexneri ΔospC3 (d). f, Lysates of the indicated control or knock-out U937 cells. g, Sanger sequencing chromatogram of control and GBP3 knock-out U937 cells. Statistical significance was assessed by one-way analysis of variance (ANOVA) with Tukey’s multiple comparisons test (a,b,d,e); ns, not significant, **P < 0.01 (exact p values are provided in Supplementary Table 1). Data are expressed as the Mean ± SEM of three (b,d,e) or four (a) independent experiments, or representative of two (c,f) independent experiments. HeLa cells were treated with IFN-γ as indicated (a-f). Blots were probed with indicated antibodies, Actin – loading control (c,f). Uncropped blots (c,f) are shown in the Source Data. PI - propidium iodide, p.i. - post-infection, +ve – positive. S. T - S. Typhimurium.
Extended Data Fig. 9
Extended Data Fig. 9. Processing and secretion of IL-18 during S. flexneri infection
a,c, Lysates of HeLa cells prepared at 1 h p.i. with the indicated S. flexneri strains. Samples in Extended Data Fig. 9a,c and Extended Data Fig. 4c,d were obtained from the same experiment. b,d, Release of IL-18 from HeLa cells infected with the indicated S. flexneri strains for 1h. e, Lysates of HeLa cells expressing the indicated FLAG-tagged caspase alleles and treated with the indicated siRNAs prepared at 1 h p.i. with S. flexneri ΔospC3. f, Lysates of the indicated control or knock-out HeLa cells prepared at 1 h p.i. with S. flexneri ΔospC3. Samples in Extended Data Fig. 9f, Extended Data Fig. 5b and Extended Data Fig. 8c and were obtained from the same experiment. g, Release of IL-18 from the indicated control or knock-out HeLa cells infected with S. flexneri ΔospC3 for 1h. Statistical significance was assessed by one-way analysis of variance (ANOVA) with Tukey’s multiple comparisons test (b,d,g); ns, not significant, *P < 0.05, **P < 0.01 (exact p values are provided in Supplementary Table 1). Data are expressed as the Mean ± SEM of three (b,d,g) independent experiments, or representative of two (e,f) or three (a,c) independent experiments. HeLa cells were treated with IFN-γ as indicated (a-g). Blots were probed with indicated antibodies, Actin – loading control (a,c,e,f). Uncropped blots (a,c,e,f) are shown in the Source Data.
Extended Data Fig. 10
Extended Data Fig. 10. Schematic illustration of the GBP-CASP4 pathway
Interferon-induced guanylate-binding proteins (GBPs) transform Gram-negative bacteria into a caspase activation platform by coating their surface with a polyvalent protein array. The bacterial GBP coat may serve to foster contacts between CASP4 and its microbial ligand, the hydrophobic lipid A moiety of LPS, an integral and otherwise inaccessible component of the bacterial outer membrane. GBPs control CASP4 activation in a hierarchical manner; GBP1 initiates platform assembly, GBP2 and GBP4 control CASP4 recruitment, whereas GBP3 governs CASP4 activation. Once activated CASP4 cleaves GSDMD and IL-18 to cause pyroptotic cell death and cytokine release, thereby destroying the bacterial niche and alerting neighbouring cells of imminent danger. The cytosol-adapted bacterium Shigella flexneri antagonizes the pathway through secretion of the CASP4 inhibitor OspC3.
Figure 1.
Figure 1.. IFN-γ prevents proliferation of cytosol-invading S. Typhimurium
a,b Fold replication of S. Typhimurium in HeLa cells. Cells were treated with siRNAs (a) or cytokines (b) as indicated. c,d, Percentage of S. Typhimurium positive for YFP::Galectin-8 at 1 h p.i. (c) and endogenous NDP52, ubiquitin (FK2 staining) or GFP::LC3C at 1 and 3 h p.i. in HeLa cells (d). n > 100 (for 1 h p.i.), n > 200 (for 3 h p.i.) bacteria per coverslip, in triplicate. e-g, Live microscopy of HeLa cells expressing CFP::Galectin-8 and infected with S. Typhimurium in medium containing PI. Frames from Supplementary Video 2 (e), time between recruitment of Galectin-8 to bacteria and nuclei of host cell becoming PI positive (f), percentage of PI positive nuclei among infected cells (g). Imaged every 6 min for 6 h, 12 fields per condition. Blue arrowhead – point of interest. Time p.i. as indicated; scale bar, 10 μm (e). Median in red (f). h,k, Fold replication of S. Typhimurium in HeLa cells treated with DMSO, 50 μM NEC-1s, 10 μM NSA or 50 μM Z-VAD-FMK as indicated. i,j, Fold replication of S. Typhimurium in HeLa cells expressing the indicated FLAG-fusion proteins. l, Percentage of FAM-VAD-FMK positive cells among HeLa cells harbouring S. Typhimurium positive for endogenous Galectin-8 at 90 min p.i.; cells expressing FLAG::CrmA as indicated. n > 100 cells with Galectin-8 +ve bacteria per coverslip, in triplicate. Statistical significance was assessed by two-tailed unpaired Student’s t-test (c), one-way (g,l) or two-way (a,b,d,h-k) analysis of variance (ANOVA) with Tukey’s multiple comparisons test; ns, not significant, *P < 0.05, **P < 0.01 (exact p values are provided in Supplementary Table 1). Data are expressed as the Mean ± SEM of three (a-d,h-l) or six (g) independent experiments, representative of six (e) independent experiments, or pooled from three independent experiments (f). HeLa cells were treated with IFN-γ (e,f) or treated with IFN-γ as indicated (a,c,d,g-l). Bacteria were counted based on their ability to grow on agar plates (a,b,h-k). PI - propidium iodide, p.i. - post-infection, +ve – positive, S. T - S. Typhimurium.
Figure 2.
Figure 2.. Cytosol-invading bacteria recruit caspase-4 for gasdermin-D dependent pyroptosis
a, Percentage of FAM-VAD-FMK positive S. Typhimurium among bacteria positive for endogenous Galectin-8 at 90 min p.i. in HeLa cells expressing FLAG::CrmA as indicated. n > 100 Galectin-8 +ve bacteria per coverslip, in triplicate. b, Confocal micrographs of HeLa cells, taken at 90 min p.i. with S. Typhimurium in the presence of FAM-VAD-FMK and stained with DAPI and antibody against Galectin-8. c-e, Percentage of S. Typhimurium positive for the indicated GFP::Caspase constructs at 1 h p.i. in HeLa cells. n > 100 bacteria per coverslip, in triplicate. f, Confocal micrographs of HeLa cells, taken at 90 min p.i. with S. Typhimurium and stained with DAPI and antibodies against Caspase-4 and Galectin-8. g, Lysates of HeLa cells expressing GFP::Caspase-4 as indicated. Blots were probed with indicated antibodies, PCNA – loading control. h, Percentage of FAM-VAD-FMK positive cells among HeLa cells containing S. Typhimurium positive for endogenous Galectin-8 at 90 min p.i.; cells treated with siRNAs against caspases as indicated. n > 100 cells with Galectin-8 +ve bacteria per coverslip, in triplicate. i,l,q, Percentage of PI positive nuclei among HeLa cells infected with S. Typhimurium (i), the indicated S. flexneri strains (l) or S. flexneri ΔospC3 (q) at 2h p.i. Cells were treated with siRNAs as indicated (i,q). j,k,n, Fold replication of S. Typhimurium (j), the indicated S. flexneri strains (k) or S. flexneri ΔospC3 (n) in HeLa cells. Cells were treated with siRNAs against Caspase-4 (j,n). m, Time between recruitment of Galectin-8 to S. flexneri ΔospC3 and nuclei of infected cell becoming PI positive in CFP::Galectin-8 expressing HeLa cells. Median in red. Live imaged every 5 min for 5 h. o,p Lysates of HeLa cells treated with the indicated siRNAs (o) or of control and knock-out HeLa cells (p) and infected with S. flexneri ΔospC3 for 1h. Blots were probed with the indicated antibodies, Actin – loading control. Pro - full length pro-form of GSDMD (shorter exposure), NT - N-terminal domain of GSDMD (longer exposure). Samples in Fig. 2p, Fig. 8c and Extended Data Fig. 2g were obtained from the same experiment. Statistical significance was assessed by two-tailed unpaired Student’s t-test (d), one-way (a,h,i,l,q) or two-way (j,k,n) analysis of variance (ANOVA) with Tukey’s multiple comparisons test; ns, not significant, *P < 0.05, **P < 0.01 (exact p values are provided in Supplementary Table 1). Data are expressed as the Mean ± SEM of three (a,c-e,h,k,l,n) or four (i,j,q) independent experiments, representative of two (p), three (b,f,g,o) independent experiments, or pooled from four independent experiments (m). HeLa cells were treated with IFN-γ (c,e,m) or treated with IFN-γ as indicated (a,b,d,f-l,n-q). Bacteria were counted based on their ability to grow on agar plates (j,k,n). Uncropped blots (g,o,p) are shown in the Source Data. Scale bar, 10 μm (b,f). PI - propidium iodide, p.i. - post-infection, +ve – positive, S. T - S. Typhimurium.
Figure 3.
Figure 3.. GBPs recruit and activate caspase-4 at the surface of cytosol-invading bacteria
a,b, Percentage of S. Typhimurium positive at 1 h p.i. for the indicated GFP::GBP constructs expressed in HeLa cells. Cells were treated with the indicated siRNAs (b). n > 100 bacteria per coverslip, in triplicate. c, Structured illumination micrograph of HeLa cells expressing GFP::GBP1 at 1 h p.i. with S. Typhimurium and antibody-stained for Caspase-4. Scale bar, 1 μm. d-f, Percentage of endogenous Caspase-4 positive bacteria among S. Typhimurium positive for endogenous Galectin-8 (d), indicated S. flexneri strains (e) or S. flexneri ΔipaH9.8 (f) at 1 h p.i. in HeLa cells. Cells were treated with the indicated siRNAs against GBPs (d,f). n > 100 Galectin-8 positive bacteria (d) or n > 100 bacteria (e,f) per coverslip, in triplicate. g-i, Percentage of FAM-VAD-FMK positive S. Typhimurium among bacteria positive for endogenous Galectin-8 at 90 min p.i. (g) FAM-VAD-FMK positive S. flexneri of the indicated strains (h) or S. flexneri ΔospC3 ΔipaH9.8 (i) at 1 h p.i. in HeLa cells. Cells were treated with the indicated siRNAs against GBPs (g,i). n > 100 Galectin-8 positive bacteria (g) or n > 100 bacteria (h, i) per coverslip, in triplicate. j, Lysates of HeLa cells treated with the indicated siRNAs and infected with S. flexneri ΔospC3 for 1h. Blots were probed with the indicated antibodies, Actin – loading control. Pro - full length pro-form of GSDMD (shorter exposure), NT - N-terminal domain of GSDMD (longer exposure). k,l, Percentage of PI positive nuclei in HeLa cells treated with the indicated siRNAs at 2h p.i. with S. Typhimurium (k) or S. flexneri ΔospC3 (l). Statistical significance was assessed by two-tailed unpaired Student’s t-test (e), one-way analysis of variance (ANOVA) with Dunnett’s multiple comparisons test versus siControl (b) or Tukey’s multiple comparisons test (d-i,k,l); ns, not significant, *P < 0.05, **P < 0.01 (exact p values are provided in Supplementary Table 1). Data are expressed as the Mean ± SEM of three (a,b,d-i), four (k) or five (l) independent experiments, or representative of three (c,j) independent experiments. HeLa cells were treated with IFN-γ (b,c) or treated with IFN-γ as indicated (a,d-l). Uncropped blots (j) are shown in the Source Data. PI - propidium iodide, p.i. - post-infection, +ve – positive.
Figure 4.
Figure 4.. Formation of LPS-dependent GBP-CASP4 complexes
a-c, Pulldown of endogenous Caspase-4 by FLAG-tagged GBPs from HeLa cell lysates complemented with 10 μg ml−1 S. Typhimurium LPS and GDP-AlFx (a) or as indicated (b,c). d, Pulldown of endogenous Caspase-4 by FLAG-tagged GBPs from lysates of control or the indicated GBP knock-out U937 cells. Lysates were complemented with 10 μg ml−1 S. Typhimurium LPS and GDP-AlFx. Data are representative of two independent experiments (a-d). HeLa cells were treated with IFN-γ as indicated (a-d). Flag-tagged proteins were pulled down using magnetic beads and eluted with FLAG peptide. Blots were probed with the indicated antibodies, PCNA – loading control. Uncropped blots (a-d) are shown in the Source Data.
Figure 5.
Figure 5.. Analysis of LPS-dependent GBP-CASP4 complexes
a,b,e, Pulldown of endogenous Caspase-4 by FLAG-tagged GBP1 from HeLa cell lysates complemented with GDP-AlFx and 10 μg ml−1 of LPS from the indicated bacterial species or LipidA (a), with GDP-AlFx and 10 μg ml−1 of the indicated agonist (b) or with 10 μg ml−1 S. Typhimurium LPS and the indicated reagents i.e. 200 μM GDP, 300 μM AlCl3, 10 mM NaF, 200 μM GMP, 0.5 mM GTP-γ-S, 0.5 mM GppNHp or 0.5 mM GppCp (e). c,d, Pulldown of GFP-tagged alleles of Caspase-4 (c) or endogenous Caspase-4 (d) by FLAG-tagged WT GBP1 (c) or the indicated GBP1 alleles (d) from HeLa cell lysates. Lysates were complemented with 10 μg ml−1 of S. Typhimurium LPS (c,d) and with GDP-AlFx (c) or with GDP-AlFx as indicated (d). Data are representative of two independent experiments (a-e). HeLa cells were treated with IFN-γ as indicated (a-e). Flag-tagged proteins were pulled down using magnetic beads and eluted with FLAG peptide. Blots were probed with the indicated antibodies, PCNA – loading control. Uncropped blots (a-e) are shown in the Source Data.
Figure 6.
Figure 6.. Structure function analysis of the GBP-dependent caspase-4 signalling platform
a,d, Percentage of S. flexneri positive for the indicated FLAG::GBP1 (a) or FLAG::Caspase-4 (d) alleles at 1 h p.i. HeLa cells were treated with the GBP1 #49 (a) or CASP4 #14 (d) siRNA and GBP1 (a) or Caspase-4 (d) expression was complemented with siRNA-resistant FLAG::GBP1 or FLAG::Caspase-4 alleles as indicated. n > 100 bacteria per coverslip, in triplicate. b, Percentage of endogenous Caspase-4 positive S. flexneri ΔipaH9.8 at 1 h p.i.. HeLa cells were treated with GBP1 #49 siRNA and GBP1 expression was complemented with siRNA-resistant FLAG::GBP1 alleles as indicated. n > 100 bacteria per coverslip, in triplicate. c,g, Percentage of PI positive nuclei in cells infected with S. flexneri ΔospC3 at 2h p.i. HeLa cells were treated with the indicated siRNAs and GBP1 (c) or Caspase-4 (g) expression was complemented with siRNA-resistant FLAG::GBP1 or FLAG::Caspase-4 alleles as indicated. e, Percentage of GFP::Caspase-4 CARD domain (aa1–104) positive S. flexneri ΔospC3 amongst Galectin-8 positive bacteria in HeLa cells expressing CFP::Galectin-8 and the indicated GFP::Caspase-4 CARD domain alleles. Live imaged every 4 min for 2 h, 5 fields per condition. f, Lysates of cells infected with S. flexneri ΔospC3 for 1h. HeLa cells were treated with the indicated siRNAs and Caspase-4 expression was complemented with siRNA-resistant FLAG::Caspase-4 alleles as indicated. Blots were probed with the indicated antibodies, Actin – loading control. Pro - full length pro-form of GSDMD (shorter exposure), NT - N-terminal domain of GSDMD (longer exposure). Samples in Fig. 6f and Fig. 8e were obtained from the same experiment. Statistical significance was assessed by one-way analysis of variance (ANOVA) with Dunnett’s (c) or Tukey’s (a,b,d,e,g) multiple comparisons test; ns, not significant, *P < 0.05, **P < 0.01 (exact p values are provided in Supplementary Table 1). Data are expressed as the Mean ± SEM of three (a,b,d,e), four (c) or five (g) independent experiments, or representative of two (f) independent experiments. HeLa cells were treated with IFN-γ (a,d) or treated with IFN-γ as indicated (b,c,e-g). Uncropped blots (f) are shown in the Source Data. PI - propidium iodide, p.i. - post-infection, +ve – positive.
Figure 7.
Figure 7.. Gbps and Caspase-11 protect mice epistatically against bacterial infection
a, Kaplan-Meier survival plots of wild-type (WT) or the indicated knock-out mice infected orogastrically with Streptomycin-resistant S. Typhimurium at a MOI of 7 ×10³. Sample sizes – 5 animals per group. b, Bacterial burden during S. Typhimurium infection in mice. Wild-type (WT) or the indicated knock-out mice were infected orogastrically with Streptomycin-resistant S. Typhimurium at a MOI of 7 ×10³. CFUs of S. Typhimurium in cecum assessed at 96 h p.i.. Sample sizes (n = number of animals); n = 3 for WT, n = 2 for Gbp1−/−, n = 4 for Gbp2−/− and Casp11−/−. c, Kaplan-Meier survival plots of wild-type (WT) or the indicated knock-out mice infected intraperitoneally with the indicated S. flexneri strains at a MOI of 7.6 ×10⁷. Sample sizes (n = number of animals) and genotypes Shigella/mice); n = 8 for WT/WT, WT/Gbp1−/− and WT/Gbp2−/−, n = 6 for WT/Casp11−/−, n = 9 for ΔospC3/WT and ΔospC3/Gbp2−/−, n=10 ΔospC3/Gbp1−/−, n = 9 for ΔospC3/Casp11−/−, n = 8 for ΔospC3+ospC3/WT, ΔospC3+ospC3/Gbp1−/− and ΔospC3+ospC3/Gbp2−/−, n = 6 for ΔospC3+ospC3/Casp11−/−. d, Bacterial burden during S. flexneri infection in mice. Wild-type (WT) or the indicated knock-out mice were infected intraperitoneally with the indicated S. flexneri strains at a MOI of 7.6 ×10⁷. CFUs of S. flexneri in spleen (left) or liver (right) were determined at 24 h p.i.. Sample sizes – 5 animals per group. Statistical significance was assessed by two-tailed Log-rank (Mantel-Cox) test compared to WT group (a,c) or one-way ANOVA with Dunnett’s multiple comparison test versus WT mice group (b,d); ns, not significant, *P < 0.05, **P < 0.01 (exact p values are provided in Supplementary Table 1). Data are shown as the Mean ± SD (b,d). Data are representative of two independent experiments (a-d). p.i. - post-infection, MOI - multiplicity of infection.
Figure 8.
Figure 8.. Processing and secretion of IL-18 requires GBP-dependent caspase-4 activity
a,c,g, Lysates of HeLa cells treated with the indicated siRNAs (a,g) or of the indicated control or knock-out HeLa cells (c) harvested at 1h p.i. with S. flexneri ΔospC3. Samples in Fig. 8c, Fig. 2p and Extended Data Fig. 2g were obtained from the same experiment. b,d,h, Release of IL-18 from HeLa cells treated with the indicated siRNAs (b,h) or from the indicated control or knock-out HeLa cells (d) at 1h p.i. with S. flexneri ΔospC3. e, i, Lysates of cells at 1h p.i. with S. flexneri ΔospC3. HeLa cells were treated with the indicated siRNAs and GBP1 (i) or Caspase-4 (e) expression was complemented with FLAG::GBP1 or FLAG::Caspase-4 alleles as indicated. Samples in Fig. 8e and Fig. 6f were obtained from the same experiment. f,j, Release of IL-18 from cells treated with the indicated siRNAs at 1h p.i. with S. flexneri ΔospC3. HeLa cells were treated with the indicated siRNAs and GBP1 (j) or Caspase-4 (f) expression was complemented with FLAG::GBP1 or FLAG::Caspase-4 alleles as indicated. Statistical significance was assessed by one-way analysis of variance (ANOVA) with Tukey’s multiple comparisons test (b,d,f,h,j); ns, not significant, *P < 0.05, **P < 0.01 (exact p values are provided in Supplementary Table 1). Data are expressed as the Mean ± SEM of three (b,d,f,h,j) independent experiments, or representative of two (c,e,i) or three (a,g) independent experiments. HeLa cells were treated with IFN-γ as indicated (a-j). Blots were probed with the indicated antibodies, Actin – loading control (a,c,e,g,i). Uncropped blots (a,c,e,g,i) are shown in the Source Data. p.i. - post-infection.

Comment in

References

    1. Poltorak A. et al. Defective LPS signaling in C3H/HeJ and C57BL/10ScCr mice: mutations in Tlr4 gene. Science 282, 2085–2088 (1998). - PubMed
    1. Takeuchi O & Akira S Pattern recognition receptors and inflammation. Cell 140, 805–20 (2010). - PubMed
    1. Park BS et al. The structural basis of lipopolysaccharide recognition by the TLR4-MD-2 complex. Nature 458, 1191–5 (2009). - PubMed
    1. Hagar JA, Powell DA, Aachoui Y, Ernst RK & Miao EA Cytoplasmic LPS activates caspase-11: implications in TLR4-independent endotoxic shock. Science 341, 1250–1253 (2013). - PMC - PubMed
    1. Shi J et al. Inflammatory caspases are innate immune receptors for intracellular LPS. Nature 514, 187–192 (2014). - PubMed

Methods-only References

    1. Miao EA et al. Caspase-1-induced pyroptosis is an innate immune effector mechanism against intracellular bacteria. Nat Immunol 11, 1136–1142 (2010). - PMC - PubMed
    1. Randow F & Sale JE Retroviral transduction of DT40. Sub-cellular biochemistry 40, 383–386 (2006). - PubMed
    1. Nowarski R et al. Epithelial IL-18 Equilibrium Controls Barrier Function in Colitis. Cell 163, 1444–1456 (2015). - PMC - PubMed
    1. Kraiczy J et al. DNA methylation defines regional identity of human intestinal epithelial organoids and undergoes dynamic changes during development. Gut 68, 49 (2019). - PMC - PubMed
    1. Ettayebi K et al. Replication of human noroviruses in stem cell-derived human enteroids. Sci New York N Y 353, 1387–1393 (2016). - PMC - PubMed

Publication types