. 2020 Jun 15;10(1):9599.
doi: 10.1038/s41598-020-66305-1.

Anticipatory control of human gait following simulated slip exposure

Affiliations

Anticipatory control of human gait following simulated slip exposure

Sander B Swart et al. Sci Rep. .

Abstract

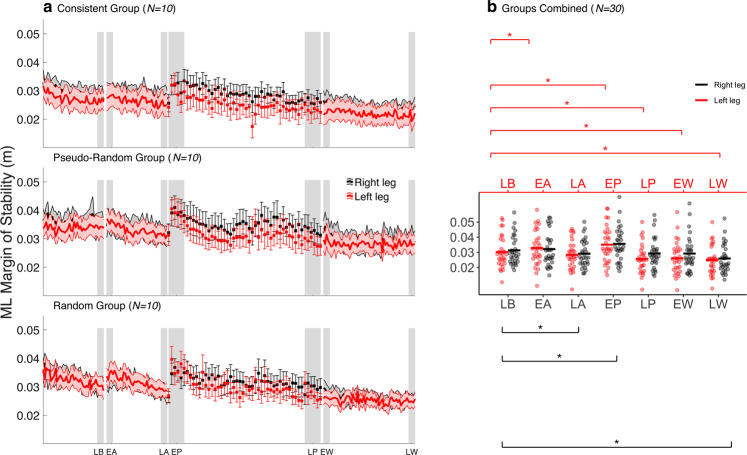
A cautious gait (CG), marked by wider and shorter steps, is typically employed to mitigate expected perturbations proactively. However, it is not well understood if and how CG is informed by the task requirements. Therefore, we assessed how CG is adjusted to these requirements. Three groups of ten healthy young adults were exposed to a single uninterrupted protocol of treadmill walking that consisted of three distinct phases. Spatiotemporal step characteristics and margins of stability of the unperturbed strides were compared when participants were (i) only warned of a perturbation, (ii) exposed to fifty unilateral (right) slip-like perturbations and (iii) kept unaware of perturbation removal. Only the perturbation intensity predictability differed between groups. This was either kept consistent or pseudo-randomly or randomly varied. Participants walked with wider and shorter steps following the perturbation warning. However, this extinguished in continuing perturbation absence. Next, during perturbation exposure, participants shortened the step of the perturbed but increased the step of the unperturbed leg. This did not differ between groups. Finally, participants persisted in displaying CG on perturbation removal, but this extinguished over time. Collectively, we show that CG is functionally adjusted to the task requirements. These findings may have practical implications for fall-prevention training.


Conflict of interest statement

The authors declare no competing interests.

Figures

Figure 1
Figure 1
Overview of the experimental paradigm. (a) Perturbation method, participants walked on a split-belt treadmill at a velocity of -1 m/s (black arrow), at perturbation onset both belts accelerated to a velocity of 0.35 m/s (red arrow). (b) Perturbations were (i) induced shortly after the right foot heel strike (Supplementary Table S1). Perturbation profile, the intensity of the perturbation (ii) was either randomly or systematically varied between 0.1 and 0.5 seconds (red solid line), (iii) represents the total perturbation intensity (Supplementary Table S1). (c) Experimental paradigm, the experiment consisted of four phases: the baseline, perturbation warning, perturbation, and wash-out phase. Only the perturbation phase differed between experimental groups. The treadmill was only stopped after the baseline (red vertical lines), subsequently a predefined protocol commenced, without manual interference.
Figure 2
Figure 2
Step length during the experiment. (a) Normalized step length during the experiment is shown for the consistent (top) (N = 10), the pseudo-random (middle) (N = 10) and the random group (bottom) (N = 10). Left and right step lengths were averaged in bins of 5 strides during the baseline, warning, and wash-out phase. During the perturbation phase, the left and right step lengths of the unperturbed strides between two consecutive perturbations were averaged. Shaded areas and whiskers around the mean represent the standard error. Grey shaded blocks represent the different phases throughout the experiment: late baseline (LB), early anticipation (EA), late anticipation (LA), early perturbation (EP), late perturbation (LP), early wash-out (EW) and late wash-out (LW). (b) Individual data points of all participants (N = 30) during the experimental phases. Black and red horizontal lines, respectively, represent the group mean. Significant post hoc comparisons for the within factor PHASE are shown with the asterisk.
Figure 3
Figure 3
Anteroposterior (AP) margin of stability (MoS) at contralateral toe-off during the experiment. (a) AP MoS during the experiment is shown for the consistent (top) (N = 10), the pseudo-random (middle) (N = 10) and the random group (bottom) (N = 10). Left and right AP MoS were averaged within bins of 5 strides during the baseline, the warning, and the wash-out phase. During the perturbation phase, the left and right AP MoS of the unperturbed strides between two consecutive perturbations were averaged. Shaded areas and whiskers around the mean represent the standard error. Grey shaded blocks represent the different phases throughout the experiment: late baseline (LB), early anticipation (EA), late anticipation (LA), early perturbation (EP), late perturbation (LP), early wash-out (EW) and late wash-out (LW). (b) Individual data points of all participants (N = 30) during the experimental phases. Black and red horizontal lines, respectively, represent the group mean. Significant post hoc comparisons for the within factor PHASE are shown with the asterisk.
Figure 4
Figure 4
Mediolateral (ML) margin of stability (MoS) at contralateral toe-off during the experiment. (a) ML MoS during the experiment is shown for the consistent (top) (N = 10), the pseudo-random (middle) (N = 10) and the random group (bottom) (N = 10). Left and right ML MoS were averaged within bins of 5 strides during the baseline, the warning, and the wash-out phase. During the perturbation phase, the left and right ML MoS of the unperturbed strides between two consecutive perturbations were averaged. Shaded areas and whiskers around the mean represent the standard error. Grey shaded blocks represent the different phases throughout the experiment: late baseline (LB), early anticipation (EA), late anticipation (LA), early perturbation (EP), late perturbation (LP), early wash-out (EW) and late wash-out (LW). (b) Individual data points of all participants (N = 30) during the experimental phases. Black and red horizontal lines, respectively, represent the group mean. Significant post hoc comparisons for the within factor PHASE are shown with the asterisk.

References

    1. Winter DA. Human balance and posture control during standing and walking. Gait Posture. 1995;3:193–214. doi: 10.1016/0966-6362(96)82849-9. - DOI
    1. Patla AE. Strategies for dynamic stability during adaptive human locomotion. IEEE Eng. Med. Biol. Mag. 2003;22:48–52. doi: 10.1109/MEMB.2003.1195695. - DOI - PubMed
    1. Kovacs CR. Age-related changes in gait and obstacle avoidance capabilities in older adults: a review. J. Appl. Gerontol. 2005;24(1):21–34. doi: 10.1177/0733464804271279. - DOI
    1. Giladi N, Herman T, Reider-Groswasser II, Gurevich T, Hausdorff JM. Clinical characteristics of elderly patients with a cautious gait of unknown origin. J. Neurol. 2005;252:300–306. doi: 10.1007/s00415-005-0641-2. - DOI - PubMed
    1. Delbaere K, Sturnieks DL, Crombez G, Lord SR. Concern about falls elicits changes in gait parameters in conditions of postural threat in older people. J. Gerontol. A Biol. Sci. Med. Sci. 2009;64:237–242. doi: 10.1093/gerona/gln014. - DOI - PMC - PubMed