. 2020 Sep;30(9):763-778.
doi: 10.1038/s41422-020-0353-2. Epub 2020 Jun 15.

Reconstruction of cell spatial organization from single-cell RNA sequencing data based on ligand-receptor mediated self-assembly

Affiliations

Reconstruction of cell spatial organization from single-cell RNA sequencing data based on ligand-receptor mediated self-assembly

Xianwen Ren et al. Cell Res. 2020 Sep.

Erratum in

Abstract

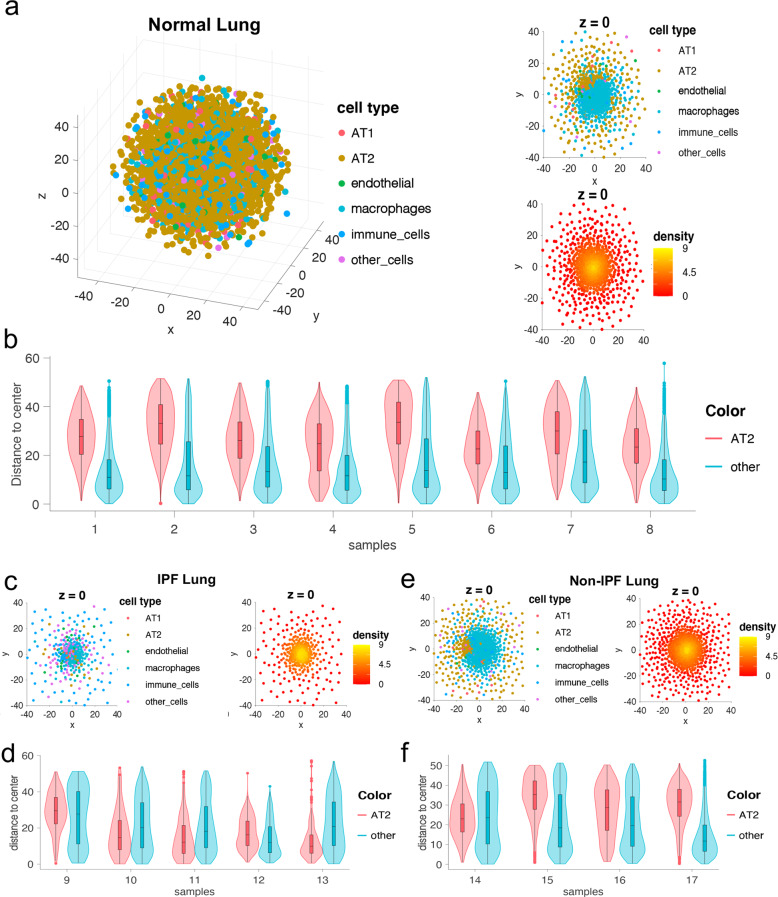
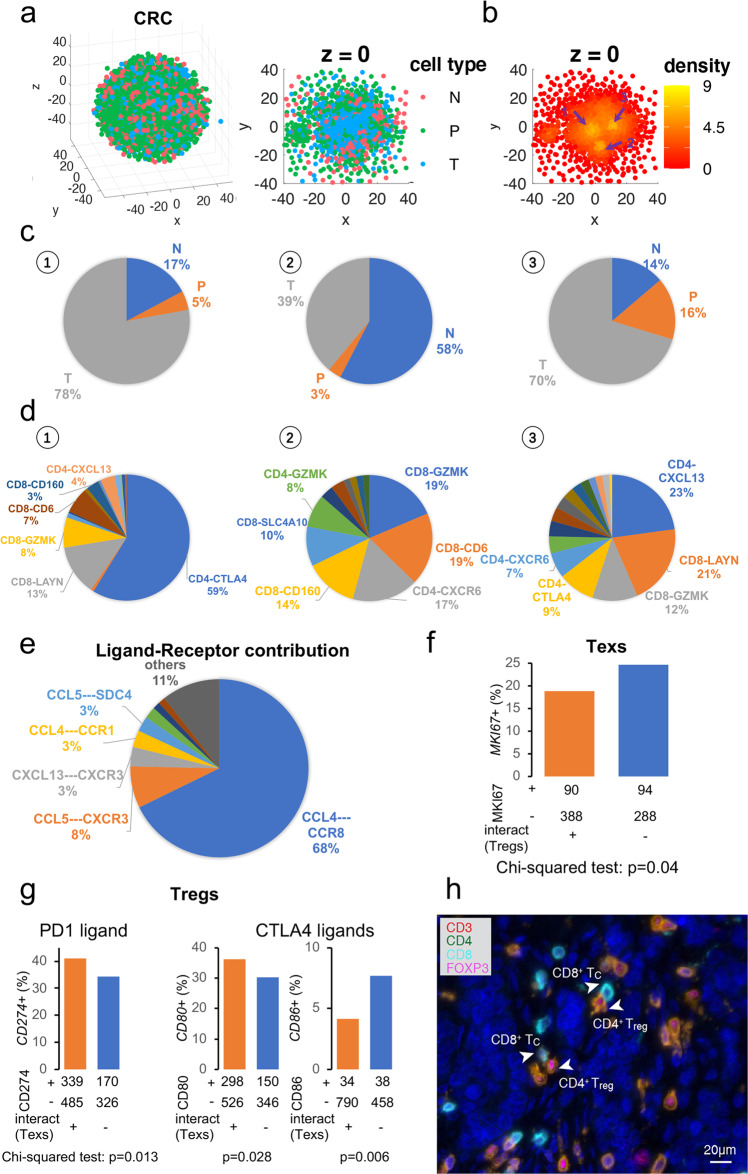
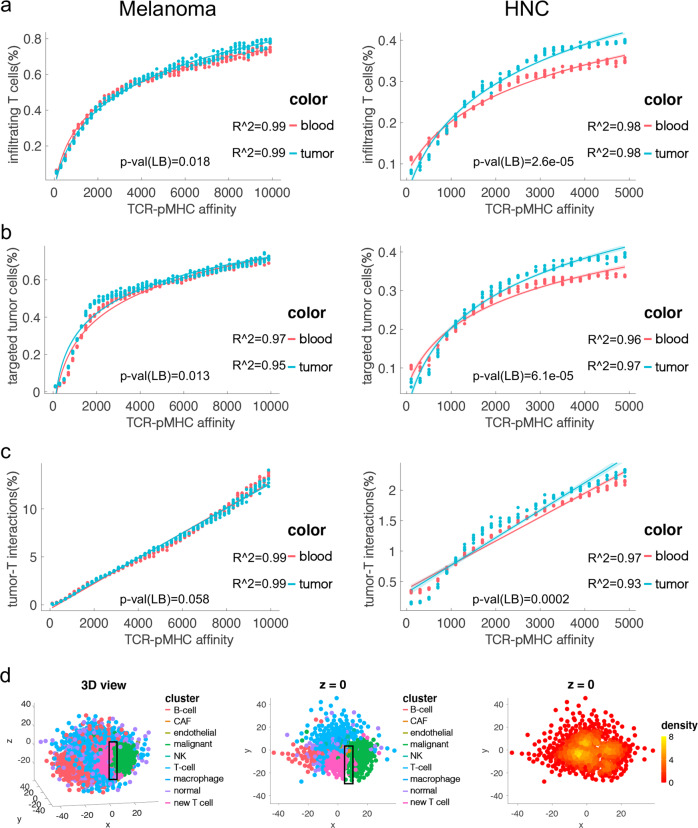
Single-cell RNA sequencing (scRNA-seq) has revolutionized transcriptomic studies by providing unprecedented cellular and molecular throughputs, but spatial information of individual cells is lost during tissue dissociation. While imaging-based technologies such as in situ sequencing show great promise, technical difficulties currently limit their wide usage. Here we hypothesize that cellular spatial organization is inherently encoded by cell identity and can be reconstructed, at least in part, by ligand-receptor interactions, and we present CSOmap, a computational tool to infer cellular interaction de novo from scRNA-seq. We show that CSOmap can successfully recapitulate the spatial organization of multiple organs of human and mouse including tumor microenvironments for multiple cancers in pseudo-space, and reveal molecular determinants of cellular interactions. Further, CSOmap readily simulates perturbation of genes or cell types to gain novel biological insights, especially into how immune cells interact in the tumor microenvironment. CSOmap can be a widely applicable tool to interrogate cellular organizations based on scRNA-seq data for various tissues in diverse systems.


Conflict of interest statement

Z.Z. is a founder of Analytical Biosciences Limited. Other authors declare no competing interests.

Figures

Fig. 1
Fig. 1. Schematics of single-cell spatial reconstruction by CSOmap.
a CSOmap takes the gene-by-cell expression matrix generated by scRNA-seq and the known ligand-receptor network as inputs, upon which a cell-by-cell affinity matrix is estimated. b The inherently high-dimensional cell-by-cell affinity matrix is embedded into a three-dimensional space via resolving cell competitions. c Density can be estimated for individual cells based on their three-dimensional coordinates obtained from b, which allows the identification of spatially-defined cell clusters. d Given the cell cluster labels, the number of connections among cell clusters and their statistical significance can be summarized and evaluated by CSOmap. e For a pair of cell clusters, the contributions of each ligand-receptor pair to their interactions can be calculated. f CSOmap allows in silico interference of the original dataset including gene knockdown/overexpression and cell depletion/adoptive transfer to examine the corresponding effects on cellular spatial organizations.
Fig. 2
Fig. 2. The exocrine and endocrine compartments of pancreas can be recapitulated by ligand-receptor based inference with CSOmap.
a The 3D visualization of CSOmap prediction of the human pancreatic scRNA-seq data (left), the cross-section of z = 0 of the 3D visualization (middle), and the statistical significance of interactions between different cell types (right). b The 3D visualization of CSOmap prediction of the mouse pancreatic scRNA-seq data (left), the cross-section of z = 0 of the 3D visualization (middle), and the statistical significance of interactions between different cell types (right). Enriched: cells of one cell type are enriched in the neighborhood of the other cell type, P (right tail) < 0.05 and q < 0.05; depleted: cells of one cell type are depleted in the neighborhood of the other cell type, P (left tail) < 0.05 and q < 0.05. Exocrine: acinar and ductal cells; endocrine: α, β, γ, δ and ε cells.
Fig. 3
Fig. 3. CSOmap recapitulates the spatial characteristics of normal alveoli of human lungs and the pathological characteristics of pulmonary fibrosis.
a The spatial organization of normal alveoli in the pseudo-space inferred by CSOmap based on the scRNA-seq data of donor 1. AT2: Type II alveolar cells; AT1: Type 1 alveolar cells. b The distance of AT2 cells to the center of the pseudo-space compared with other cells (P < 0.05, rank-sum test). c The section view at z = 0 of a patient with IPF. d Distance of AT2 cells to the center of the pseudo-space compared with other cells. e The section view at z = 0 of a patient with SSc-ILD. f Distance of AT2 cells to the center of the pseudo-space compared with other cells for one patient with hypersensitivity pneumonitis (Sample ID: 14) and three patients with SSc-ILD (Sample IDs: 15–17).
Fig. 4
Fig. 4. Performance of CSOmap in reconstructing the spatial organization of a liver tumor sample.
a, b Tumor core cells tend to locate in the center of the pseudo-space reconstructed by CSOmap. c The CSOmap reconstruction revealed that genes encoding HSPs show spatial preference. d IHC staining of independent liver tumor samples confirmed the spatial preference of Hsp70. Scale bar, 50 μm. e Quantification based on IHC images confirmed the statistical significance of the spatial preference of Hsp70 and Hsp90 (Student’s t-test, right tailed, *P < 0.05; ***P < 0.01). f 3D plot of the tumor sample by stacking 19 IHC images together after manual rotation, in which six major cell types were discriminated by the corresponding markers. g Spearman correlation between cell connections based on IHC images (X-axis) and the CSOmap prediction (Y-axis). Treg: regulatory T cells (Foxp3+); Tex: exhausted T cell (PD-1+); CD8: CD8+PD-1 T cells; cDC1: CLEC9A+ dendritic cells; M: macrophages (CD68+); O: other cells. The median distance of the 3rd nearest neighbor of all cells was used as the cutoff to determine whether two cells were spatially connected or not. The overwhelming number of “other cells” highlights the fact that millions of cells can crowd in a compact piece of tissue, posing great challenges for staining/imaging-based analysis.
Fig. 5
Fig. 5. Consistence between CSOmap prediction and IHC imaging of the tumor sample from HCC.
a Spearman correlation between cell connections based on IHC images (X-axis) and the CSOmap prediction (Y-axis) after normalizing the biases introduced by uneven cell counts among different cell types. Treg: regulatory T cell (Foxp3+); Tex: exhausted T cell (PD-1+); CD8: CD8+PD-1 T cells; cDC1: CLEC9A+ dendritic cells; M: macrophages (CD68+); O: other cells. b Example IHC image showing the interaction between CD8+PD-1 T cells and macrophages. c Enlarged illustrations of the selected windows in b (from left to right in order). d Example IHC images showing the interaction between Texs and Tregs.
Fig. 6
Fig. 6. CSOmap reveals CD63-TIMP1 as a critical ligand-receptor pair in determining the spatial characteristics of HNC and melanoma malignant cells.
a Cartoon illustration of spatial characteristics observed in IHC images of HNC patients. b Global (left) and cross-section (right) views of reconstructed spatial organization of HNC cells. c Compactness of different cell classes of HNC estimated by the density of each cell. d P-EMT cells showed significantly higher interactions with fibroblasts than other malignant cells. e Global (left) and cross-section (right) views of reconstructed spatial organization of melanoma cells. f Contributions of ligand-receptor pairs to the interactions among melanoma malignant cells. g Spatial characteristics of melanoma (left) and HNC (right) after altering the expression levels of CD63. h Cartoon illustration of spatial characteristics of melanoma on immunotherapies observed by IHC staining (left), reconstructed spatial organization (middle), comparison of interactions with T cells between treatment-naïve (TN) melanomas and melanomas with resistance to immune checkpoint blockade (ICR) (bottom right in the middle), and differential usage of JUN and CDK6 between T cell-interacting and not interacting malignant cells in the ICR dataset.
Fig. 7
Fig. 7. Spatial and molecular characteristics of CRC T cells.
a Global (left) and cross-section (right) views of the reconstructed spatial organization of CRC T cells (colored by the tissue origins, N: normal tissue; P: peripheral blood; T: tumor). b Compactness of individual cells estimated by density, with 1, 2, and 3 indicating three observed compact structures. c Tissue compositions of the three observed compact structures in b. d Cluster compositions of the three observed compact structures in b, where the cluster names follow the nomenclature of the original paper with CD4-CTLA4 indicating tumor Tregs, CD8-LAYN indicating Texs, and CD8-GZMK indicating Tems. e Contributions of ligand-receptor pairs to the interactions between Tregs and Texs. f Texs interacting with Tregs showed depletion of MKi67+ cells. g Tregs interacting with Texs showed enrichment of CD274+ and CD80+ cells and depletion of CD86+ cells. h Co-localization of Tregs and CD8+ T cells in CRC tumor samples revealed by IHC staining.
Fig. 8
Fig. 8. Tumor-T interactions with varying TCR-pMHC affinity after adoptive T cell transfer.
a The percentage of infiltrating T cells of the melanoma (left) and HNC (right) datasets. “Blood” and “tumor” indicate the tissue origins of the adoptively transferred T cells. b The percentage of targeted tumor cells of the melanoma (left) and HNC (right) datasets. c The percentage of tumor-T interactions relative to the theoretical numbers of the melanoma (left) and HNC (right) datasets. The R2 values in a and b indicated the goodness of fitting a logarithmic function to the observed values of each series. The R2 values in c indicated the goodness of fitting a linear function to the observed values of each series. The statistical significance of TCR-pMHC affinity and the tissue origins of adoptively transferred T cells to the percentages of infiltrating T cells, targeted tumor cells, and tumor-T interactions was evaluated by ANOVA analysis with repeated measures (by the ranova function of Matlab R2016b), and the lower bound (LB) of the P-values of the tissue origin was displayed. d The different dynamics of tumor-T interactions from infiltrating T cells and targeted tumor cells explain the visual patterns of tumor-T interfaces and tumor and T compartments frequently observed in IHC and multiplexed ion beam images. New T cell: adoptively transferred T cells.

References

    1. Tang F, et al. mRNA-Seq whole-transcriptome analysis of a single cell. Nat. Methods. 2009;6:377–382. doi: 10.1038/nmeth.1315. - DOI - PubMed
    1. Papalexi E, Satija R. Single-cell RNA sequencing to explore immune cell heterogeneity. Nat. Rev. Immunol. 2018;18:35–45. doi: 10.1038/nri.2017.76. - DOI - PubMed
    1. Lee JH. Quantitative approaches for investigating the spatial context of gene expression. Wiley Interdiscip. Rev. Syst. Biol. Med. 2017;9:e1369. doi: 10.1002/wsbm.1369. - DOI - PMC - PubMed
    1. Wang X, et al. Three-dimensional intact-tissue sequencing of single-cell transcriptional states. Science. 2018;361:eaat5691. doi: 10.1126/science.aat5691. - DOI - PMC - PubMed
    1. Coons AH, Creech HJ, Jones RN. Immunological properties of an antibody containing a fluorescent group. Proc. Soc. Exp. Biol. Med. 1941;47:200–202. doi: 10.3181/00379727-47-13084P. - DOI

Publication types

MeSH terms