. 2020 Jun 15;11(1):3023.
doi: 10.1038/s41467-020-16841-1.

Spectral cross-cumulants for multicolor super-resolved SOFI imaging

Affiliations

Spectral cross-cumulants for multicolor super-resolved SOFI imaging

K S Grußmayer et al. Nat Commun. .

Abstract

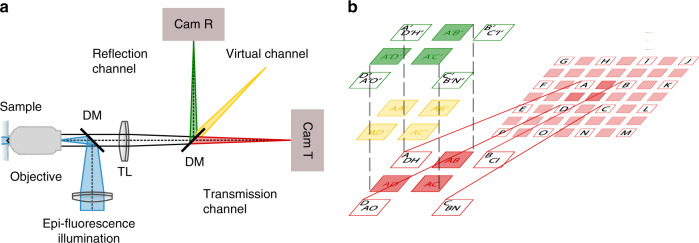
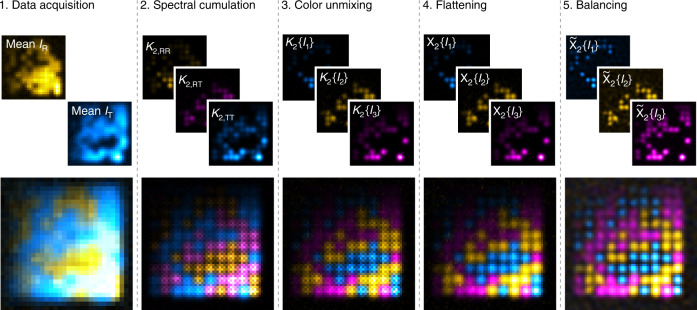
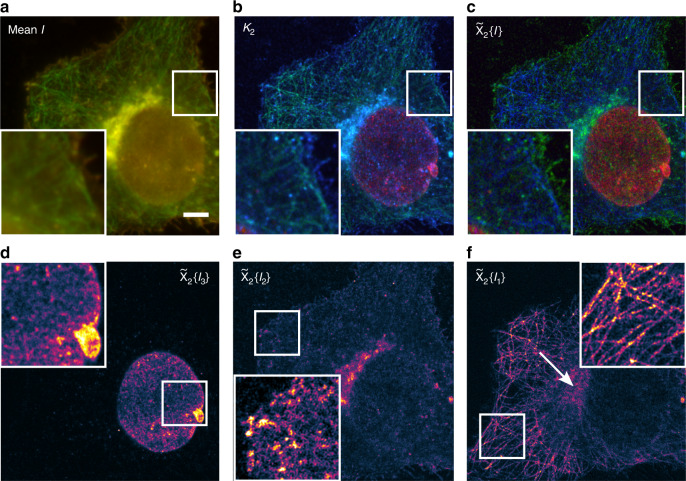
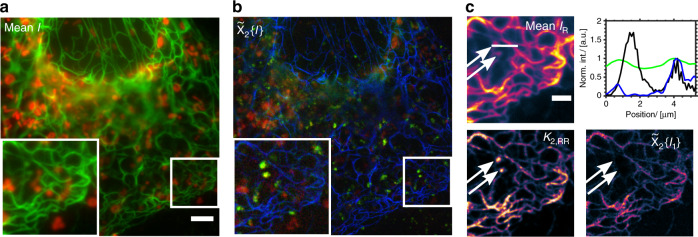
Super-resolution optical fluctuation imaging provides a resolution beyond the diffraction limit by analysing stochastic fluorescence fluctuations with higher-order statistics. Using nth order spatio-temporal cross-cumulants the spatial resolution and the sampling can be increased up to n-fold in all spatial dimensions. In this study, we extend the cumulant analysis into the spectral domain and propose a multicolor super-resolution scheme. The simultaneous acquisition of two spectral channels followed by spectral cross-cumulant analysis and unmixing increases the spectral sampling. The number of discriminable fluorophore species is thus not limited to the number of physical detection channels. Using two color channels, we demonstrate spectral unmixing of three fluorophore species in simulations and experiments in fixed and live cells. Based on an eigenvalue/vector analysis, we propose a scheme for an optimized spectral filter choice. Overall, our methodology provides a route for easy-to-implement multicolor sub-diffraction imaging using standard microscopes while conserving the spatial super-resolution property.


Conflict of interest statement

The authors declare no competing interests.

Figures

Fig. 1
Fig. 1. Cross-cumulant analysis between spectral channels.
a Simplified detection scheme with two physical spectral channels directed on two separate cameras (Cam R and Cam T, green and red). Spectral cross-cumulant analysis allows the generation of additional virtual spectral channels (yellow). DM dichroic mirror, TL tube lens, R reflection, T transmission. b Pixel combinations for the second-order cross-cumulant calculation. The cumulant analysis of each spectral channel (spectral auto-cumulant) is performed as described previously. By cross-correlating intensities from different spectral channels (red and green) analogous to the computation of ‘virtual’ planes in multi-plane 3D SOFI, the additional ‘virtual’ cross-cumulant channel is computed (yellow). Single letters denote the original pixel matrix whereas multiplets of letters symbolize cross-cumulant calculation from combinations of original pixel intensities.
Fig. 2
Fig. 2. Workflow of multicolor SOFI imaging by spectral cross-cumulant analysis followed by linear unmixing using simulations.
A 2.5 pixel grid of patches with ~20 nm radius and 2 fluorophores each (~1300 emitter μm−2) was simulated. Alexa488 (blue hot), Atto565 (yellow hot) or Alexa647 (magenta hot) spectral properties are randomly assigned to each patch. Ion varies from top to bottom (200–1100 photons) and the on-ratio varies from left to right (0.01–0.1). 4000 frames with negligible photobleaching were analyzed.
Fig. 3
Fig. 3. Multicolor SOFI of the cytoskeleton, nucleus and cellular membranes of HeLa cells.
a Overlay of the average intensity acquired in the reflection (green) and transmission (red) channel using 200 mM MEA with oxygen scavenging and about 0.5 kW cm−2 488 nm, 1.25 kW cm−2 561 nm and 1.3 kW cm−2 635 nm illumination intensity; 2000 frames and 20 ms exposure time. b RGB composite image of the second-order spectral cross-cumulant images with κ2,RR(green), κ2,RT(blue) and κ2,TT(red). c RGB composite image of the unmixed, flattened and deconvolved SOFI images with d Alexa Fluor 647 secondary antibody stained nuclear membrane (red.). e Wheat-germ agglutinin-Atto565 labeling (green, χ~2I2) and f Alexa Fluor 488 secondary antibody stained microtubules (blue, χ~2I1). The separate unmixed images are displayed using the morgenstemning colormap. Scale bar 5 μm and insets 8.64 μm x 8.64 μm. This figure is representative of more than 10 multicolor SOFI reconstructions obtained from at least two independent experiments.
Fig. 4
Fig. 4. Multicolor SOFI live-cell imaging of the cytoskeleton, mitochondria and wheat-germ agglutinin in COS-7 cells.
a Overlay of the average intensity acquired in the reflection (green) and transmission (red) channel of live cells in Hanks balanced salt solution and about 0.8 kW cm−2 488 nm, 0.8 W cm−2 561 nm and <1 kW cm−2 635 nm illumination intensity; 1000 frames and 20 ms exposure time. Scale bar 5 μm. b RGB composite image of the unmixed, flattened and deconvolved SOFI images with Mitotracker Deep Red FM stained mitochondria (red, χ~2I3), accumulated wheat-germ agglutinin-AbberiorFlip565 labeling (green, χ~2I2) and Vimentin–Dreiklang fluorescent protein expression (blue, χ~2I1). c Close-up of the ROI indicated in a and b showing the mean intensity in the reflection channel IR, the second-order spectral cross-cumulant image κ2,RR and the unmixed image in the Dreiklang channel χ~2I1, all displayed using the morgenstemning colormap and comparison of the normalized intensity profiles along the indicated line (green IR, black κ2,RR, blue χ~2I1). Scale bar 2 μm. This figure is representative of more than three multicolor SOFI reconstructions.

References

    1. Abbe E. Beiträge zur Theorie des Mikroskops und der mikroskopischen Wahrnehmung. Arch. Mikr. Anat. 1873;9:413–418. doi: 10.1007/BF02956173. - DOI
    1. Sahl SJ, Hell SW, Jakobs S. Fluorescence nanoscopy in cell biology. Nat. Rev. Mol. Cell Biol. 2017;18:685–701. doi: 10.1038/nrm.2017.71. - DOI - PubMed
    1. Sigal YM, Zhou R, Zhuang X. Visualizing and discovering cellular structures with super-resolution microscopy. Science. 2018;361:880–887. doi: 10.1126/science.aau1044. - DOI - PMC - PubMed
    1. Sauer M, Heilemann M. Single-molecule localization microscopy in eukaryotes. Chem. Rev. 2017;117:7478–7509. doi: 10.1021/acs.chemrev.6b00667. - DOI - PubMed
    1. Vicidomini G, Bianchini P, Diaspro A. STED super-resolved microscopy. Nat. Methods. 2018;15:173–182. doi: 10.1038/nmeth.4593. - DOI - PubMed

Publication types