Meta-Analysis
. 2020 Jul;52(7):680-691.
doi: 10.1038/s41588-020-0637-y. Epub 2020 Jun 15.

Discovery of 318 new risk loci for type 2 diabetes and related vascular outcomes among 1.4 million participants in a multi-ancestry meta-analysis

Collaborators, Affiliations
Meta-Analysis

Discovery of 318 new risk loci for type 2 diabetes and related vascular outcomes among 1.4 million participants in a multi-ancestry meta-analysis

Marijana Vujkovic et al. Nat Genet. 2020 Jul.

Abstract

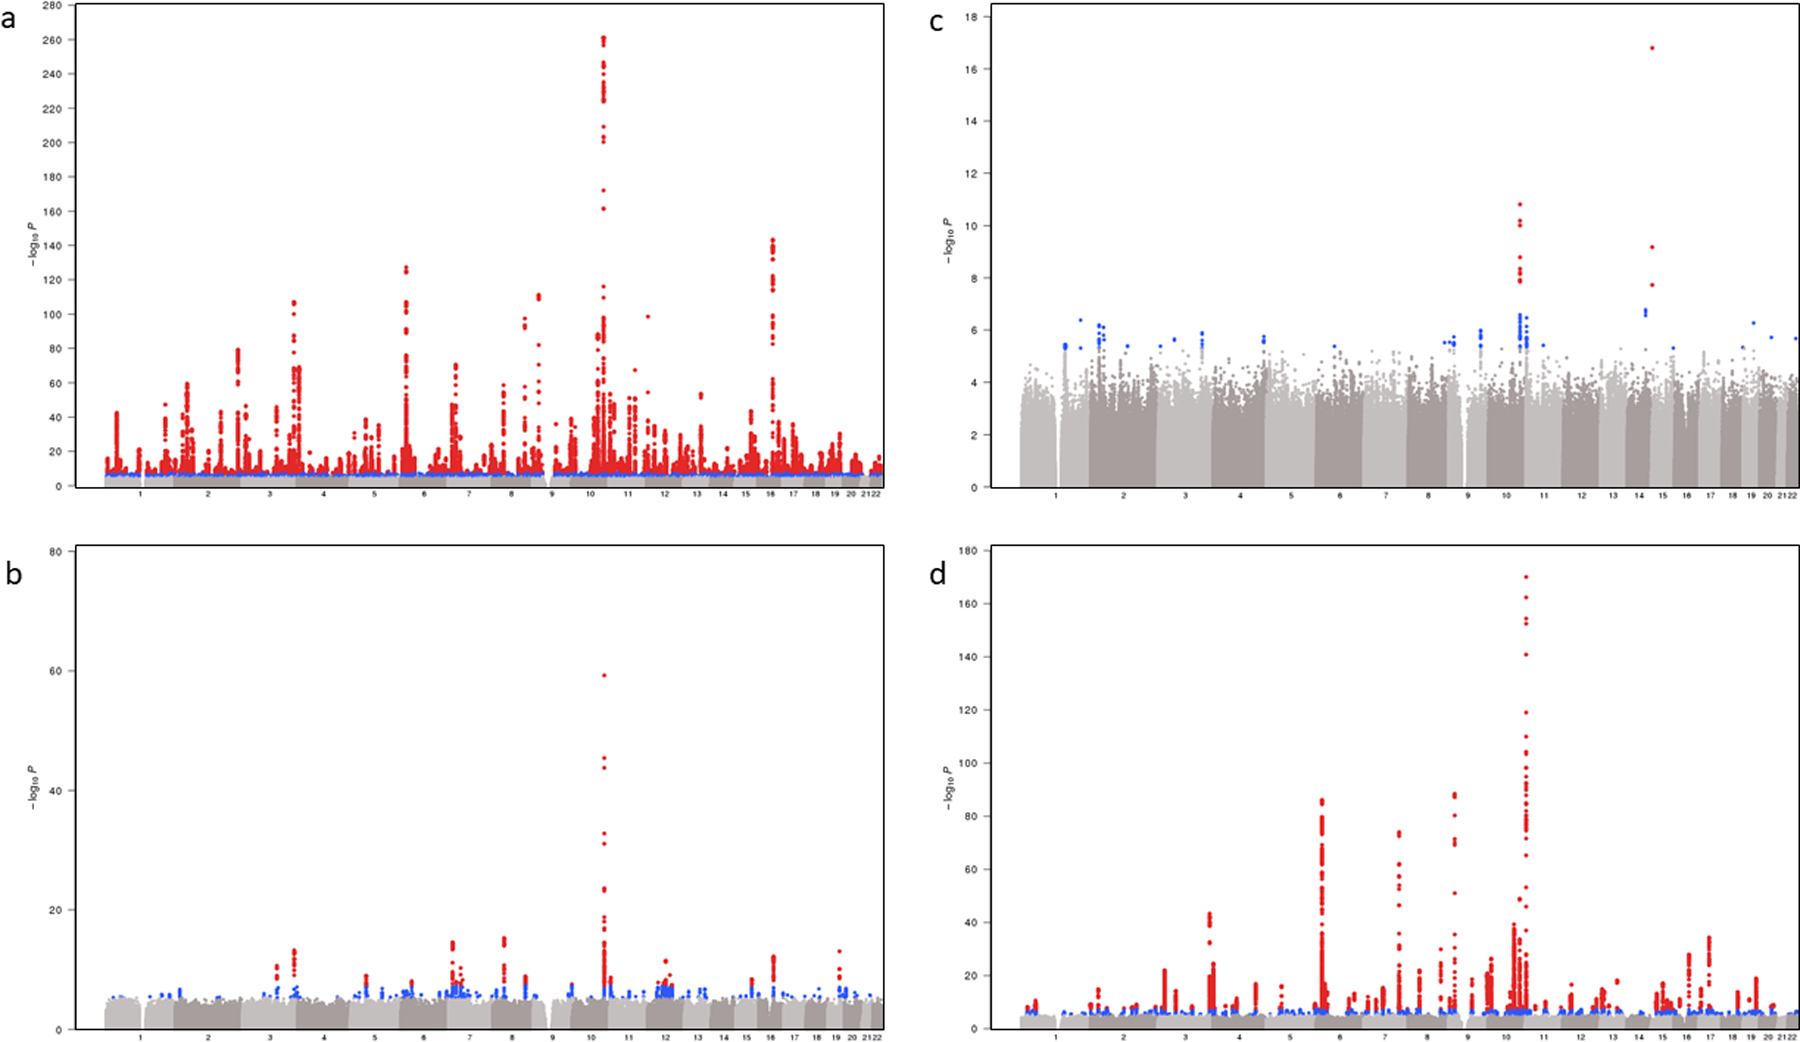
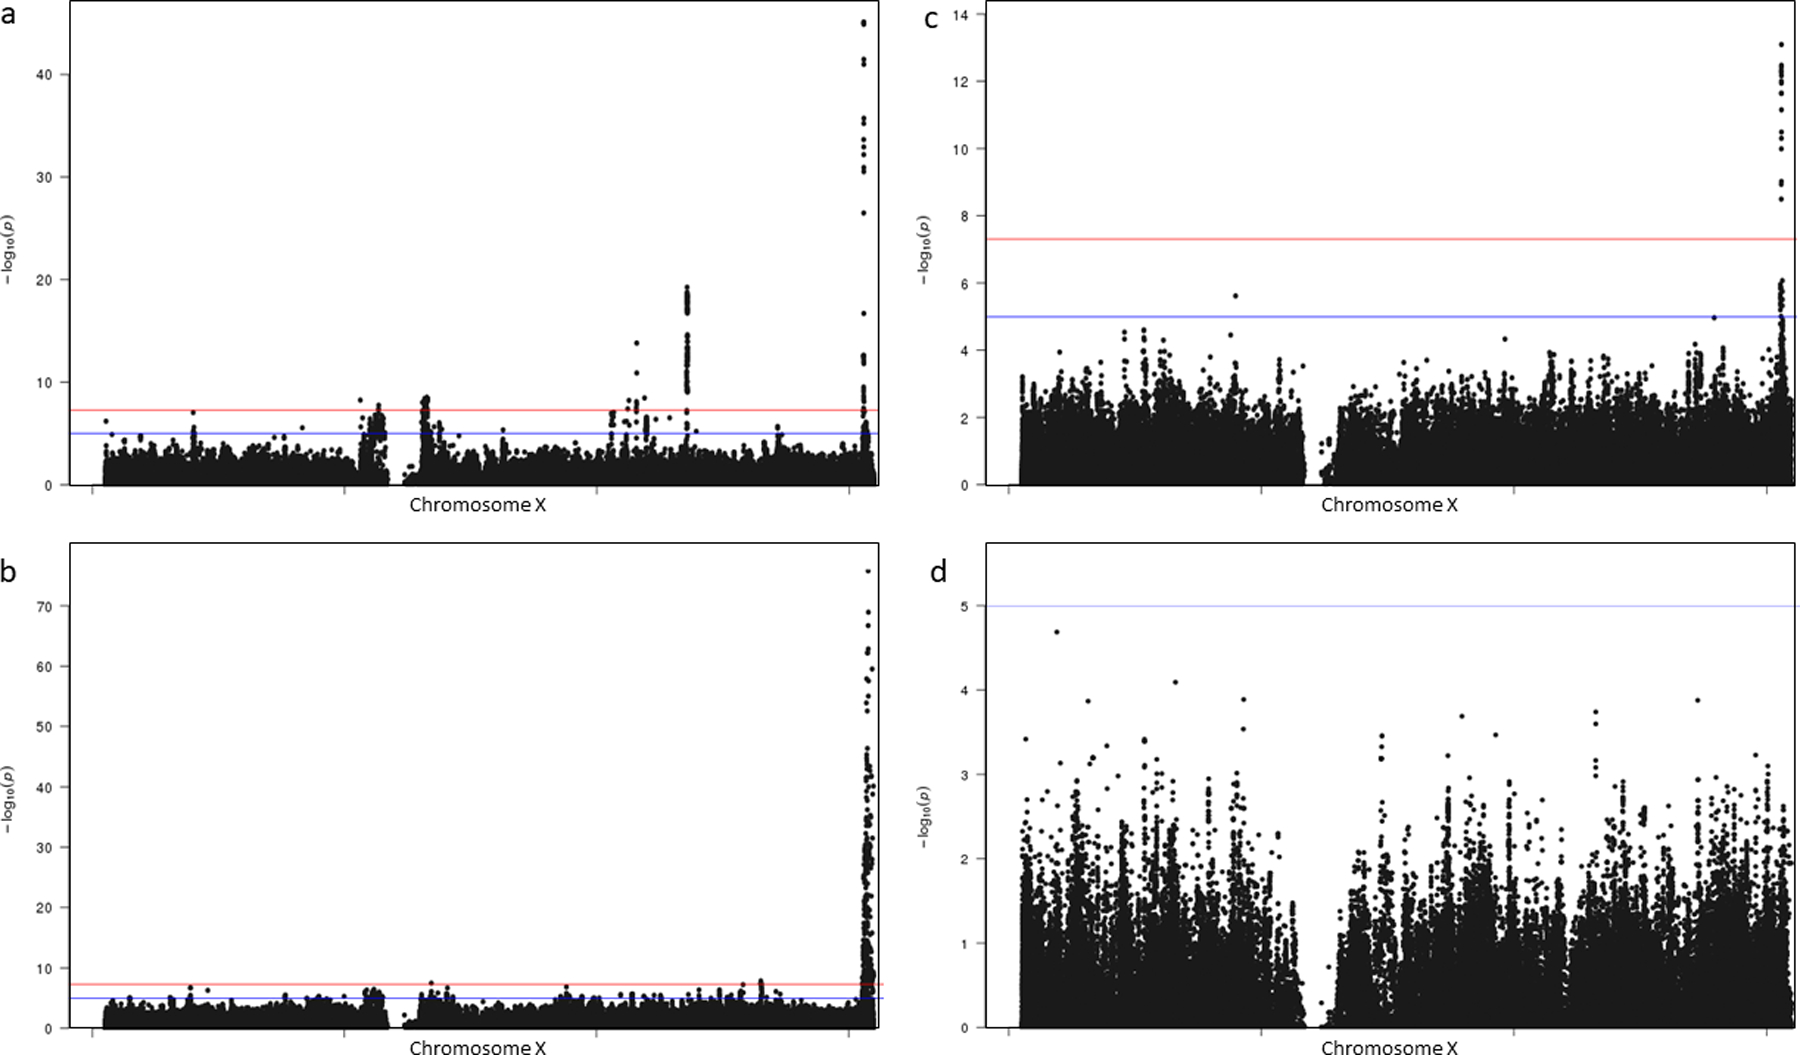
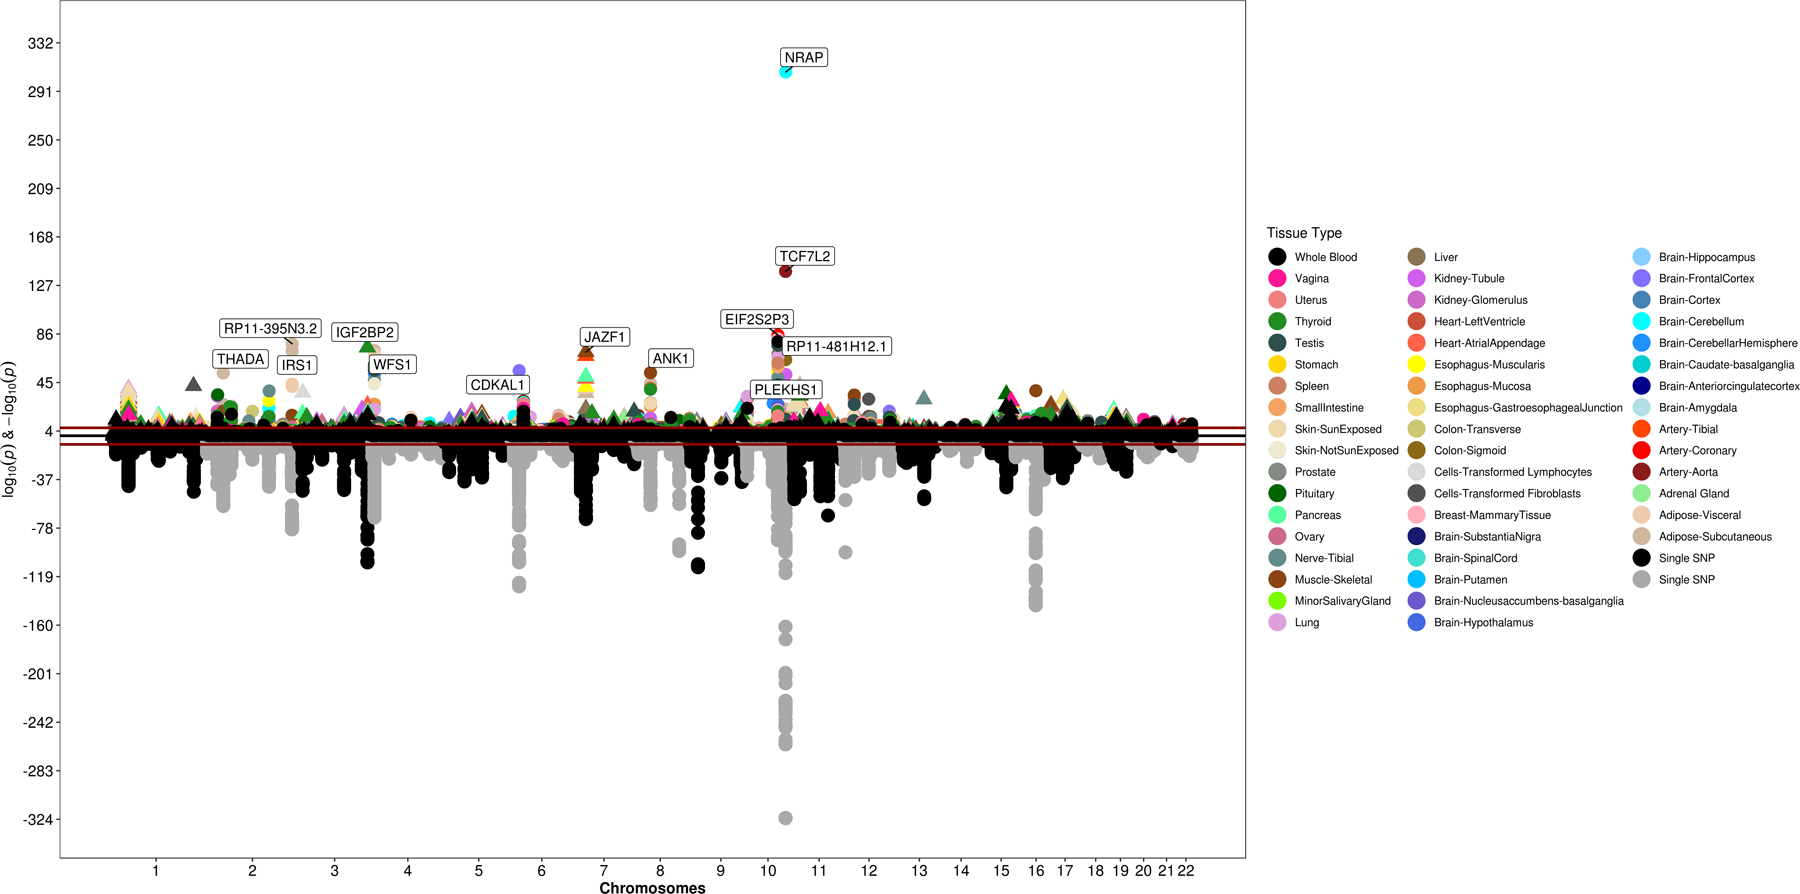
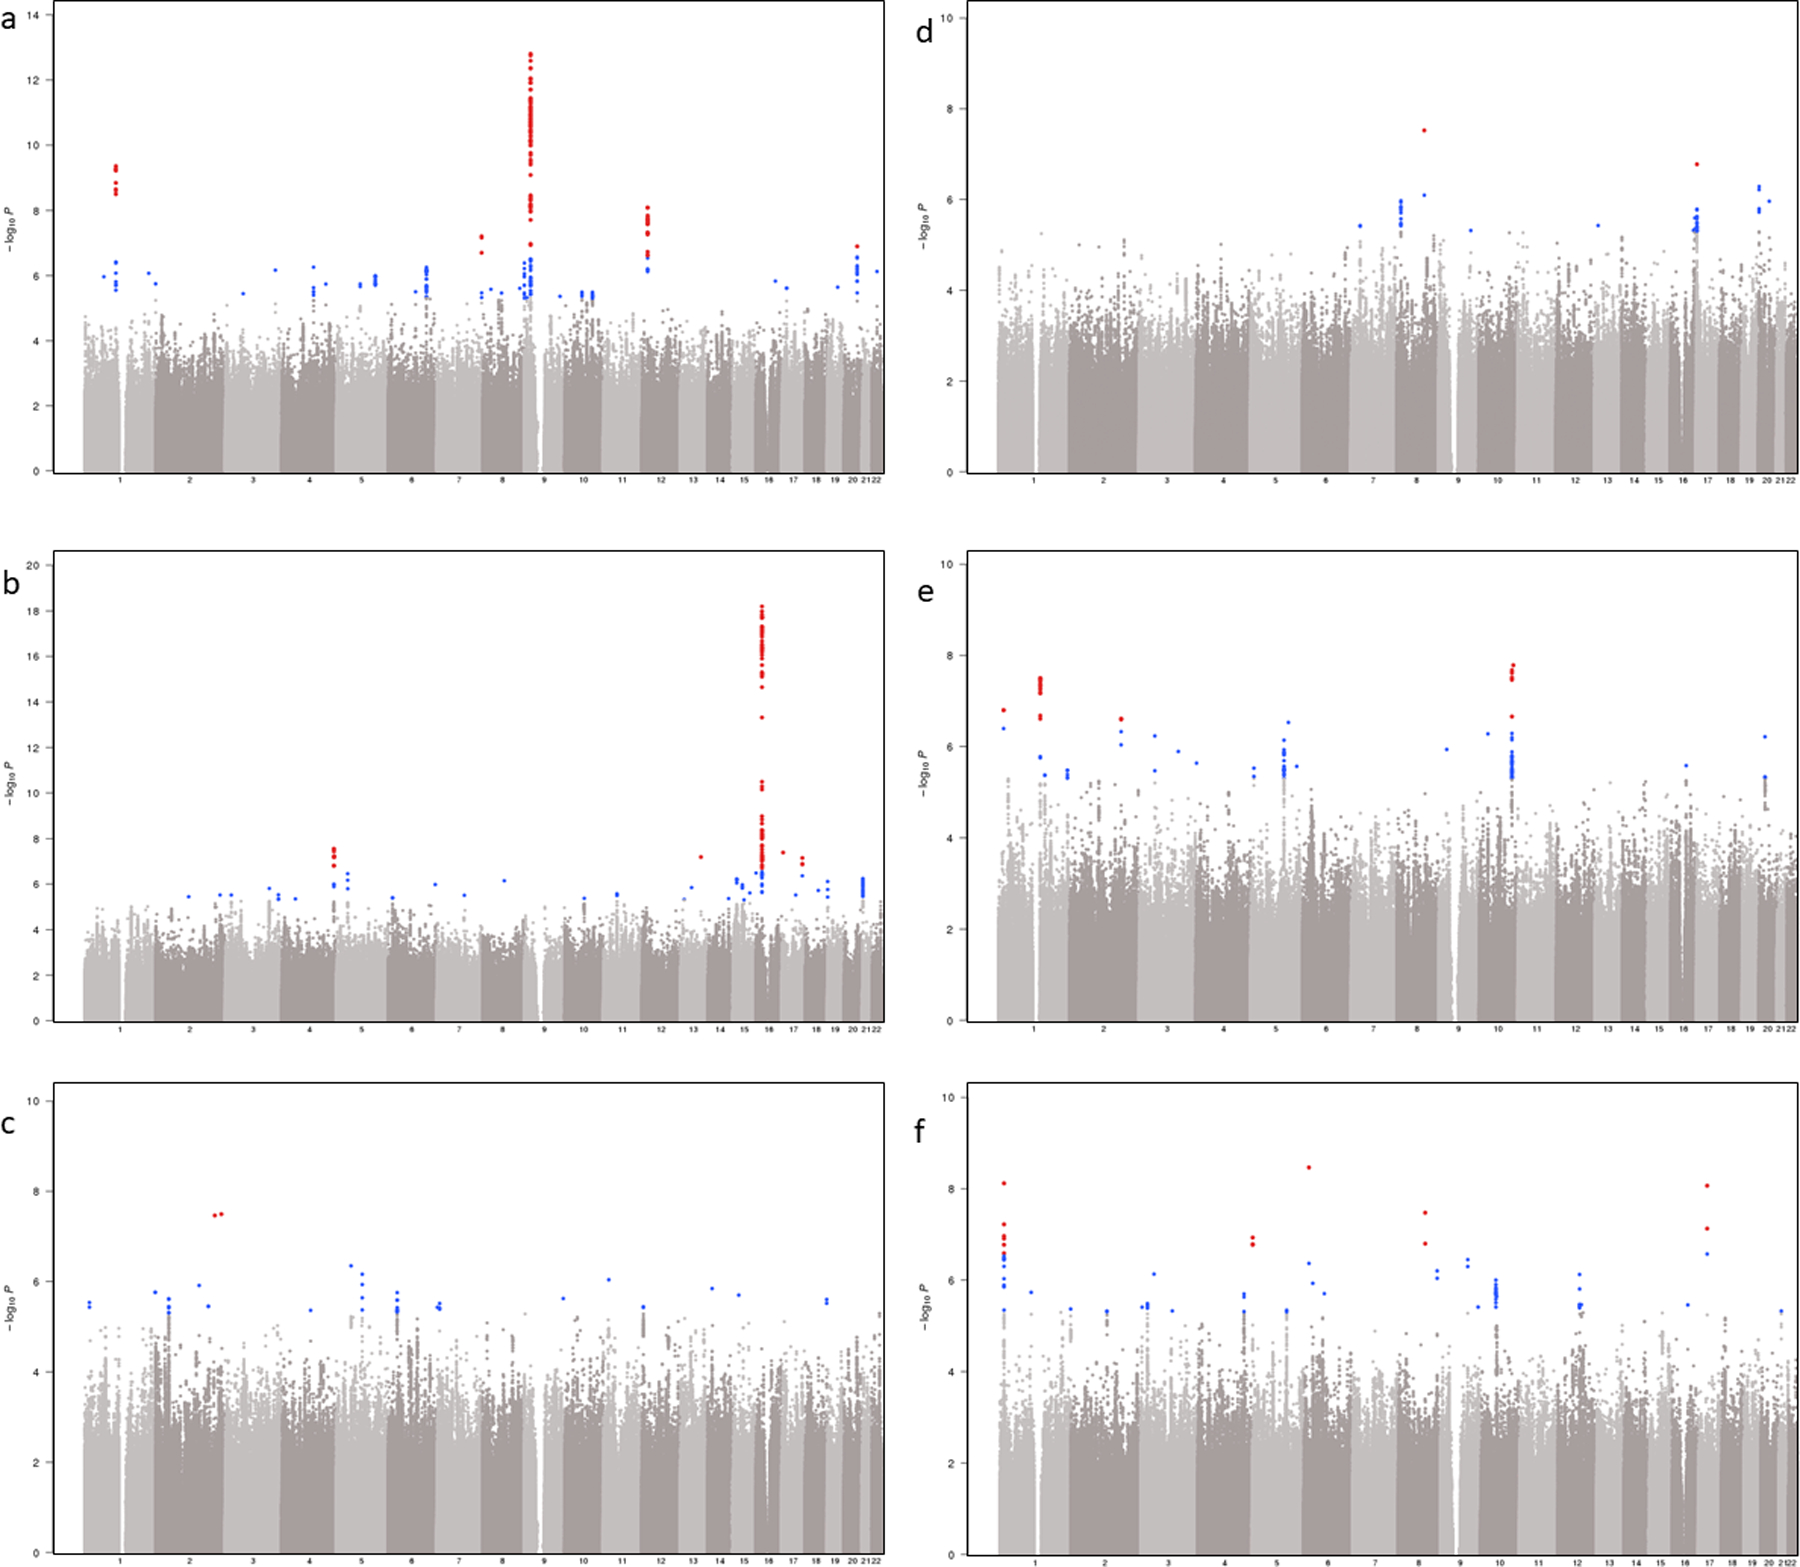
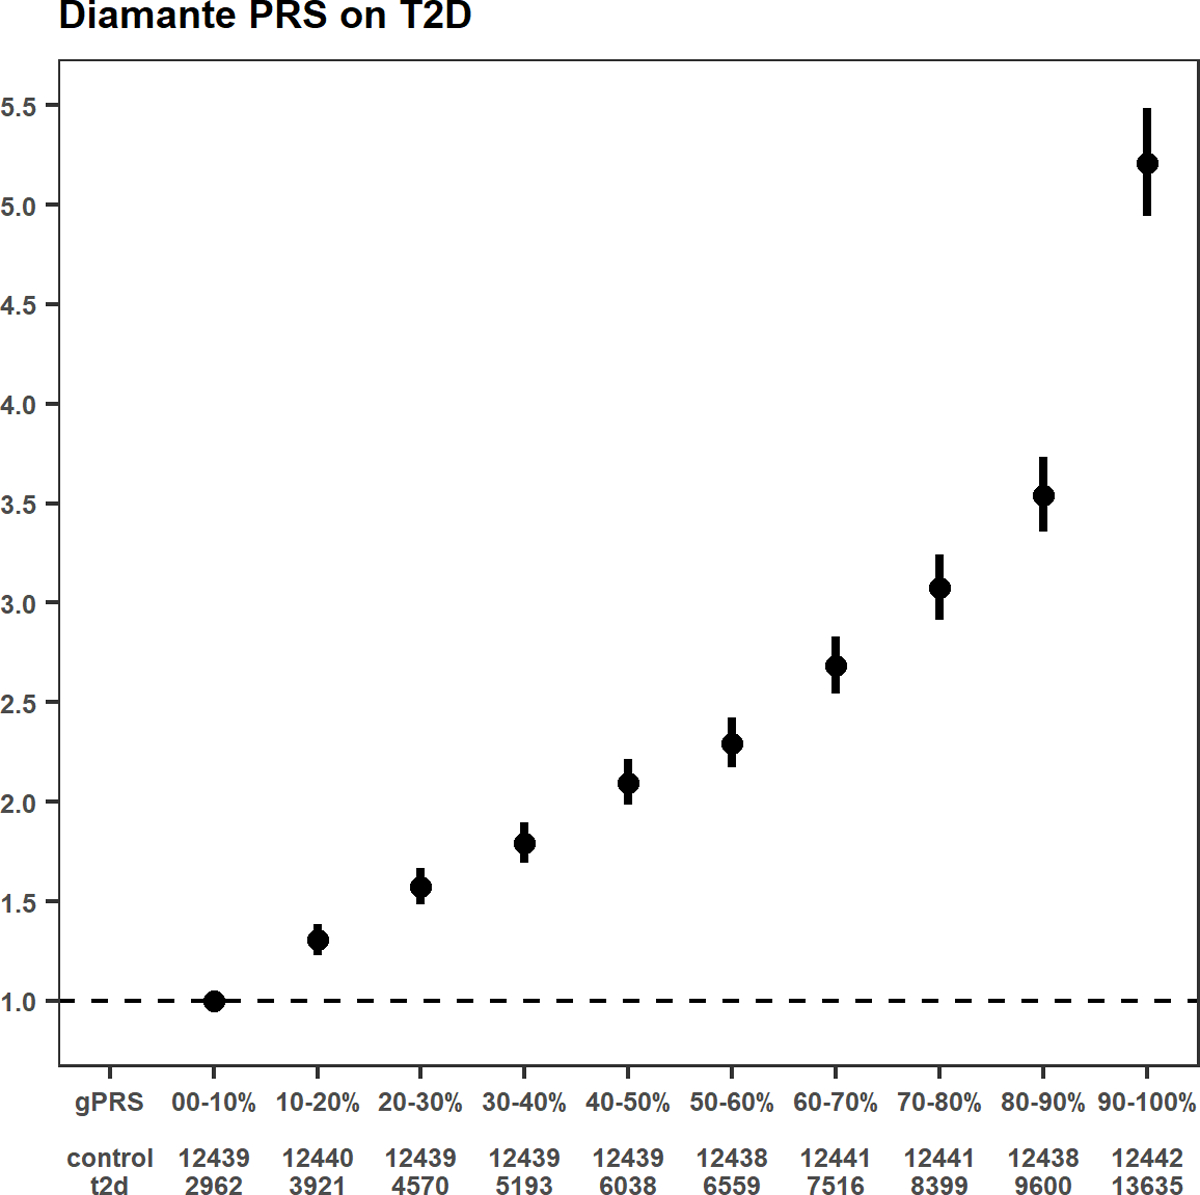
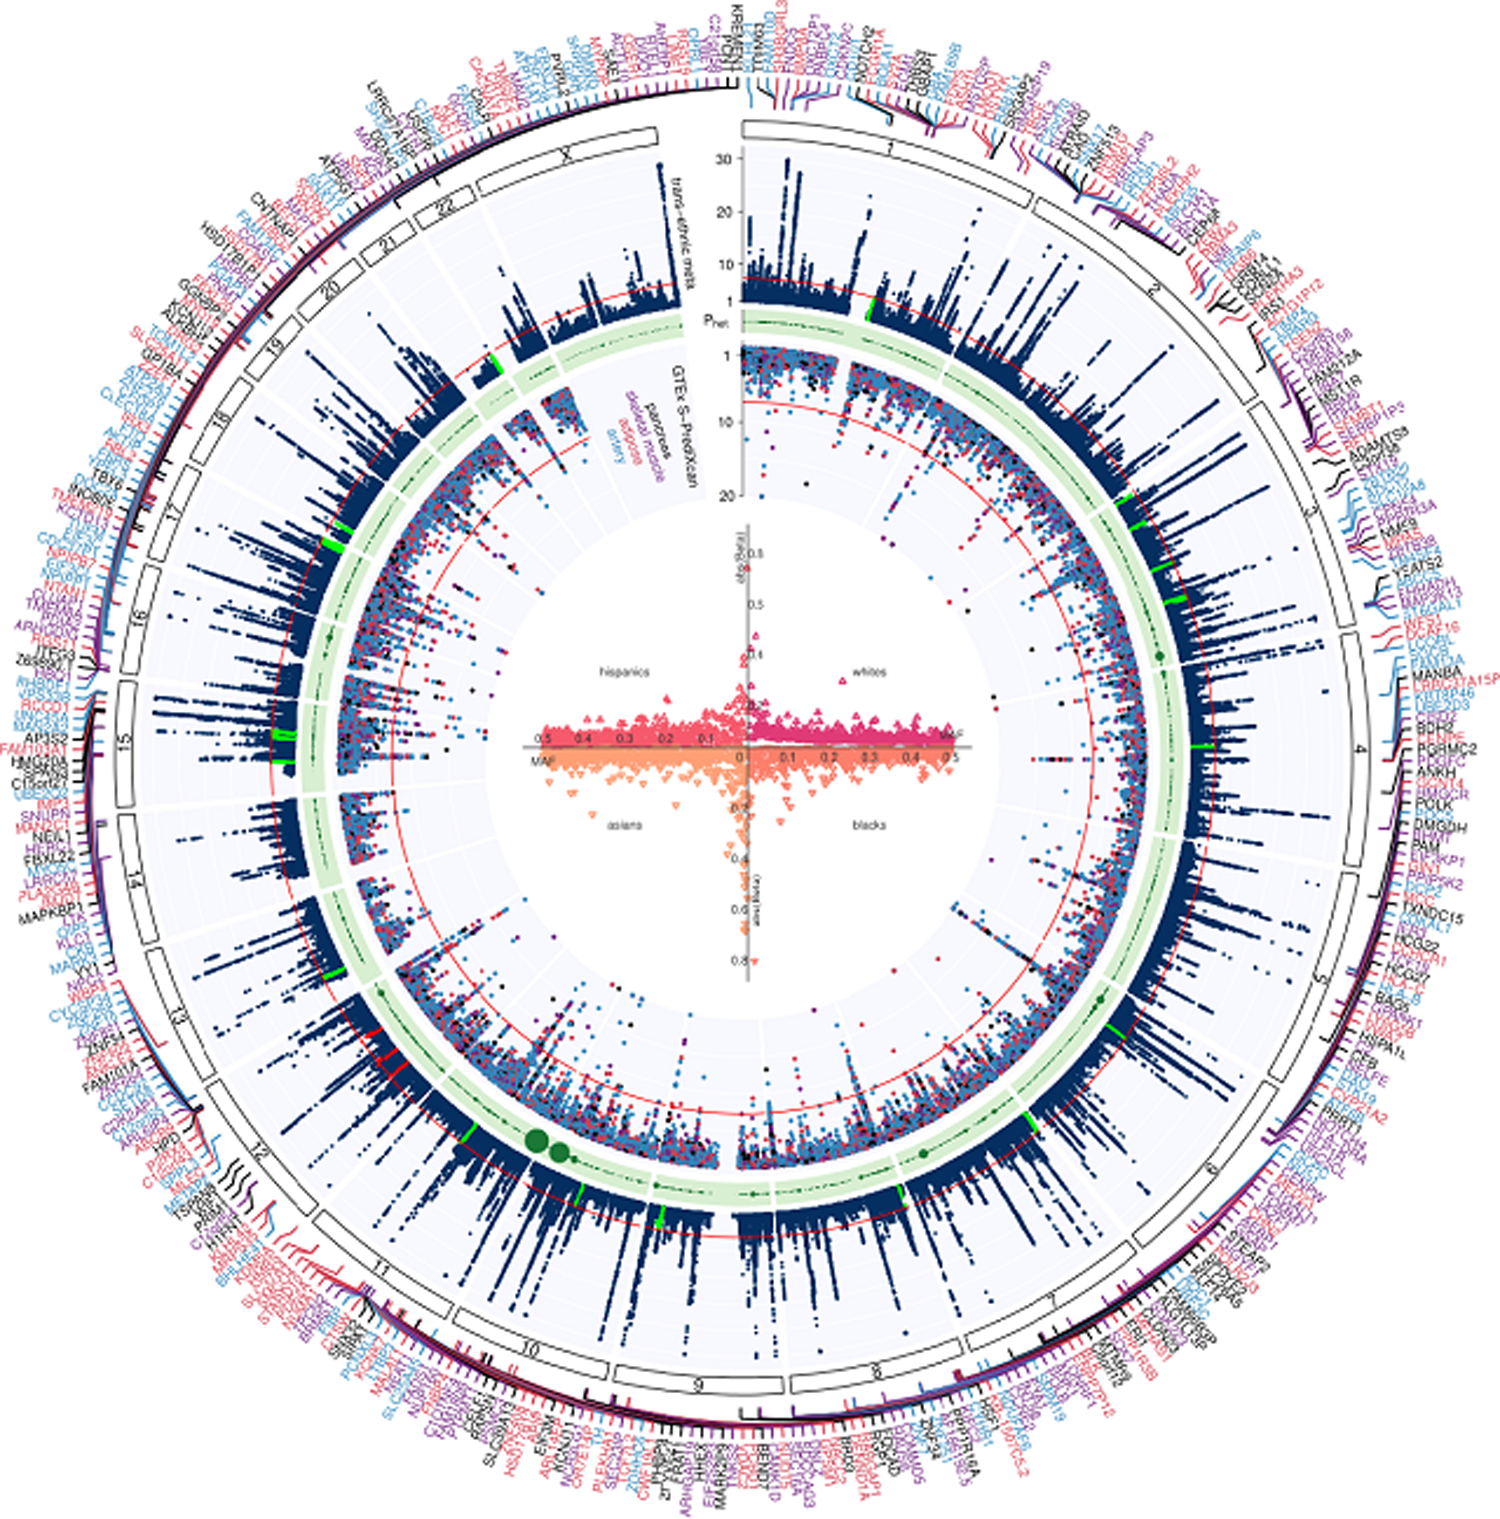
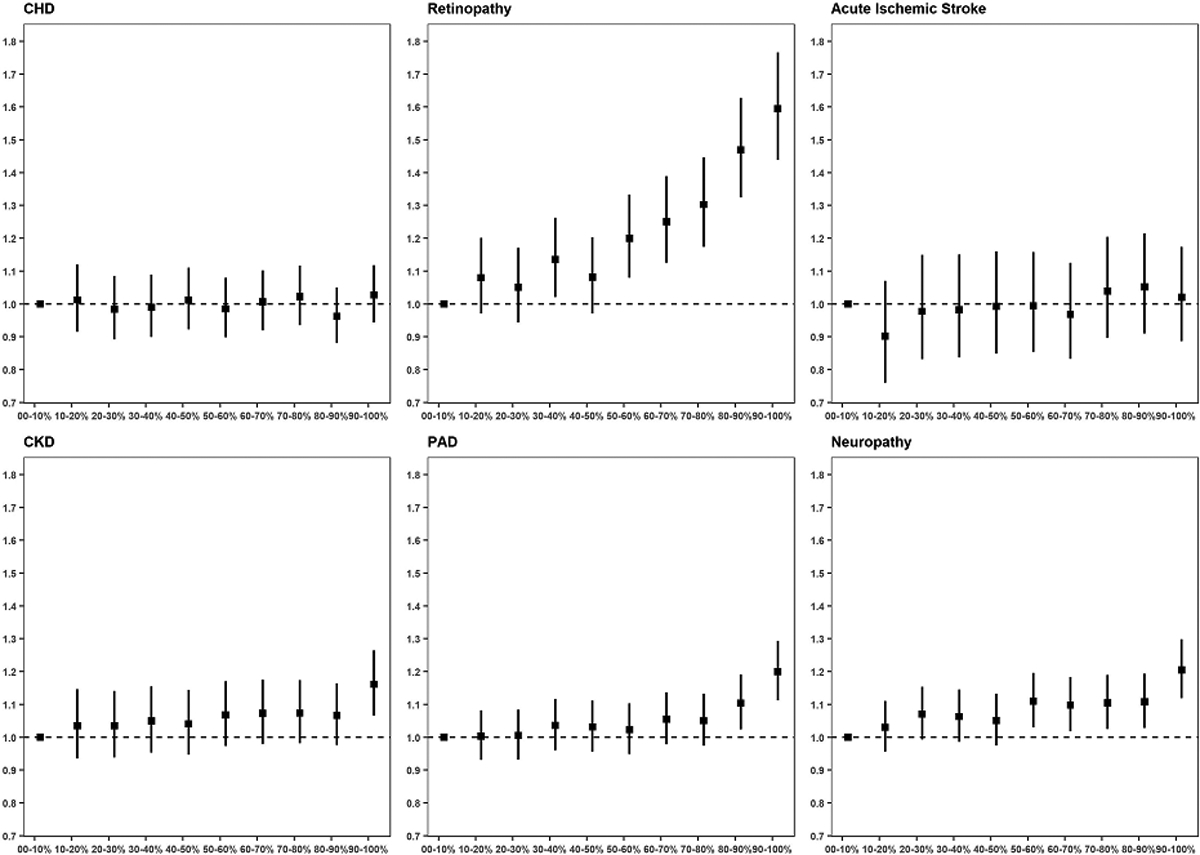
We investigated type 2 diabetes (T2D) genetic susceptibility via multi-ancestry meta-analysis of 228,499 cases and 1,178,783 controls in the Million Veteran Program (MVP), DIAMANTE, Biobank Japan and other studies. We report 568 associations, including 286 autosomal, 7 X-chromosomal and 25 identified in ancestry-specific analyses that were previously unreported. Transcriptome-wide association analysis detected 3,568 T2D associations with genetically predicted gene expression in 687 novel genes; of these, 54 are known to interact with FDA-approved drugs. A polygenic risk score (PRS) was strongly associated with increased risk of T2D-related retinopathy and modestly associated with chronic kidney disease (CKD), peripheral artery disease (PAD) and neuropathy. We investigated the genetic etiology of T2D-related vascular outcomes in the MVP and observed statistical SNP-T2D interactions at 13 variants, including coronary heart disease (CHD), CKD, PAD and neuropathy. These findings may help to identify potential therapeutic targets for T2D and genomic pathways that link T2D to vascular outcomes.


Conflict of interest statement

Competing Interests Statement

None of the sponsors of the following authors had a role in the design and conduct of the study; collection, management, analysis, and interpretation of the data; and preparation, review, or approval of the manuscript. D.S. has received support from the British Heart Foundation, Pfizer, Regeneron, Genentech, and Eli Lilly pharmaceuticals. L.S.P. has served on Scientific Advisory Boards for Janssen, and received research support from Abbvie, Merck, Amylin, Eli Lilly, Novo Nordisk, Sanofi, PhaseBio, Roche, Abbvie, Vascular Pharmaceuticals, Janssen, Glaxo SmithKline, Pfizer, Kowa, and the Cystic Fibrosis Foundation. L.S.P. is a cofounder, officer, board member, and stockholder of a diabetes management-related software company names Diasyst, Inc. S.L.D. has received research grant support from the following for-profit companies through the University of Utah or the Western Institute for Biomedical Research (VA Salt Lake City’s affiliated non-profit): AbbVie Inc., Anolinx LLC, Astellas Pharma Inc., AstraZeneca Pharmaceuticals LP, Boehringer Ingelheim International GmbH, Celgene Corporation, Eli Lilly and Company, Genentech Inc., Genomic Health, Inc., Gilead Sciences Inc., GlaxoSmithKline PLC, Innocrin Pharmaceuticals Inc., Janssen Pharmaceuticals, Inc., Kantar Health, Myriad Genetic Laboratories, Inc., Novartis International AG, and PAREXEL International Corporation. P.D.R. has received research grant support from the following for-profit companies: Bristol Myers Squib, Lysulin Inc; and has consulted with Intercept Pharmaceuticals and Boston Heart Diagnostics. S.M.D. receives research support to the University of Pennsylvania from RenalytixAI and consults for Calico Labs.

Figures

Extended Data Fig. 1
Trans-ethnic and ancestry-specific GWAS Manhattan plots a-d, Each graph represents a Manhattan plot. The y-axis corresponds to −log10 (P) for association with T2D in the respective ancestral group (a, Europeans (148,726 T2D cases, 965,732 controls, λ = 1.21); b, African American (24,646 T2D cases, 31,446 controls, λ = 1.08); c, Hispanics (8,616 T2D cases, 11,829 controls, λ = 1.03); d, Asians (46,511 T2D cases, 169,776 controls, λ = 1.15)). The x-axis represents chromosomal position on the autosomal genome. The y-axis truncated at 1 × 10−300. Points that are color-coded blue correspond to a P-value between 5.0 × 10⁻⁸ and 1.0 × 10⁻⁶. Points color-coded red indicate genome-wide significance (P = 5.0 × 10⁻⁸).
Extended Data Fig. 2
Trans-ethnic and ancestry-specific chromosome X Manhattan plots a-d, Each graph represents a Manhattan plot. The y-axis corresponds to −log10 (P) for association with T2D in the respective ancestral group (a, Europeans (69,869 T2D cases, 127,197 controls); b, African American (23,305 T2D cases, 30,140 controls); c, Hispanics (8,616 T2D cases, 11,829 controls); d, Asians (893 T2D cases, 1,560 controls)). The x-axis represents chromosomal position on chromosome X. The blue line corresponds with a significance threshold of P = 5.0 × 10⁻⁸. The red line corresponds with genome-wide significance (P = 5.0 × 10⁻⁸).
Extended Data Fig. 3
Results from PrediXcan analysis using GTEX data This graph represents an inverted Manhattan plot based on the output from the European T2D GWAS (148,726 T2D cases, 965,732 controls). The y-axis corresponds to −log10 (P) for association with genetically predicted gene expression in the respective tissue type (color coding shown on the right). Data were analyzed using S-PrediXcan software. The x-axis represents chromosomal position on the autosomal genome.
Extended Data Fig. 4
Manhattan plots for T2D-related complications using interaction analysis in individuals of European ancestry a-f, Each graph represents a Manhattan plot. The y-axis corresponds to −log10 (P) for association of SNP×T2D on T2D-related vascular outcome (a, coronary heart disease (56,285 cases, 140,945 controls, λ = 1.06); b, chronic kidney disease (67,403 cases, 129,827 controls, λ = 1.02); c, neuropathy (40,475 cases, 110,331 controls, λ = 1.03); d, peripheral artery disease (5,882 cases, 161,348 controls, λ = 1.02); e, retinopathy (13,881 cases, 123,538 controls, λ = 1.02); f, acute ischemic stroke (11,796 cases, 178,481 controls, λ = 1.00)). The x-axis represents chromosomal position on the autosomal genome. Points that are color-coded blue correspond to a P-value between 5.0 × 10⁻⁸ and 1.0 × 10⁻⁶. Points color-coded red indicate genome-wide significance (P = 5.0 × 10⁻⁸).
Extended Data Fig. 5
T2D PRS and the risk of T2D A shape plot representing the risk of a T2D genome-wide PRS (gPRS) on the odds ratio of T2D in MVP participants of European ancestry (69,869 T2D cases, 127,197 controls). The weights for the PRS have been obtained from an external reference dataset, namely the DIAMANTE Consortium. The gPRS has been divided into 10 deciles based on gPRS values in MVP white participants without T2D. The reference group is the lowest decile (0–10%). Odds ratios are shown as red dots, with their respective 95th percent confidence intervals displayed as red vertical lines.
Figure 1 |
Figure 1 |. Trans-ancestry GWAS meta-analysis identifies 318 loci associated with T2D.
The graph represents a circos plot performed in 228,499 T2D cases and 1,178,783 controls. The outer track corresponds to −log10 (P) for association with T2D in the trans-ethnic meta-analysis using a fixed-effects model with inverse-variance weighting of log odds ratios (y-axis truncated at 30), by chromosomal position. The red line indicates genome-wide significance (P = 5.0 × 10⁻⁸). Purple gene labels indicated genes identified in skeletal muscle eQTLs by S-PrediXcan analysis, red-labeled gene names in adipose eQTLs, black-labeled gene names in pancreas eQTLs, and blue-labeled gene names were identified in eQTLs from arteries. The green band corresponds to measures of heterogeneity related to the index SNPs associated with T2D that were generated using the Cochran’s Q statistic. Dot sizes are proportional to I2 or ancestry-related heterogeneity. The inner track corresponds to −log10(P) for association with skeletal muscle, adipose, pancreas, and artery tissue eQTLs from S-PrediXcan analysis (y-axis truncated at 20), by chromosomal position. The red line indicates genome-wide significance (P = 5.0 × 10⁻⁸). Inset, effects of all 318 index SNPs on T2D by minor allele frequency, stratified and colored by ancestral group.
Figure 2 |
Figure 2 |. T2D gPRS is mainly predictive of microvascular outcomes.
A genome-wide T2D PRS was calculated and categorized into deciles based on the scores in controls. The PRS-outcome associations are shown for macrovascular outcomes (CKD: 67,403 cases, 129,827 controls; CHD: 56,285 cases, 140,945 controls; PAD: 35,882 cases, 161,348 controls) and for microvascular outcomes (acute ischemic stroke: 11,796 cases, 178,481 controls; retinopathy: 13,881 cases, 123,538 controls; neuropathy: 40,475 cases, 110,331 controls). Effect sizes and 95% confidence intervals are shown per decile per micro- or macrovascular outcome. For each of the complication outcomes, separate logistic regression models are fitted for people with T2D, and the models include the following independent variables: T2D PRS (from DIAMANTE Consortium), age, gender, BMI, and 10 PCAs. For coronary heart disease, a CHD PRS (from CardiogramplusC4DplusUKBB) is included in the regression model as an additional covariate. For acute ischemic stroke, a stroke PRS (from MEGASTROKE Consortium) is included in the regression model as an additional covariate. For chronic kidney disease, a CKD PRS (from CKDgen Consortium) is included in the regression model as an additional covariate.

References

    1. IDF Diabetes Atlas, 8th edn. International Diabetes Federation; (2017).
    1. Standards of Medical Care in Diabetes, 2018. Diabetes Care 41, S1–S2 (2018). - PubMed
    1. Mahajan A et al. Fine-mapping type 2 diabetes loci to single-variant resolution using high-density imputation and islet-specific epigenome maps. Nat. Genet 50, 1505–1513 (2018). - PMC - PubMed
    1. Suzuki K et al. Identification of 28 new susceptibility loci for type 2 diabetes in the Japanese population. Nat. Genet 51, 379–386 (2019). - PubMed
    1. Gaziano JM et al. Million Veteran Program: a mega-biobank to study genetic influences on health and disease. J. Clin. Epidemiol 70, 214–223 (2016). - PubMed

Publication types

Substances