. 2020 Sep;5(9):1144-1157.
doi: 10.1038/s41564-020-0742-9. Epub 2020 Jun 15.

FOXO1 promotes HIV latency by suppressing ER stress in T cells

Affiliations

FOXO1 promotes HIV latency by suppressing ER stress in T cells

Albert Vallejo-Gracia et al. Nat Microbiol. 2020 Sep.

Abstract

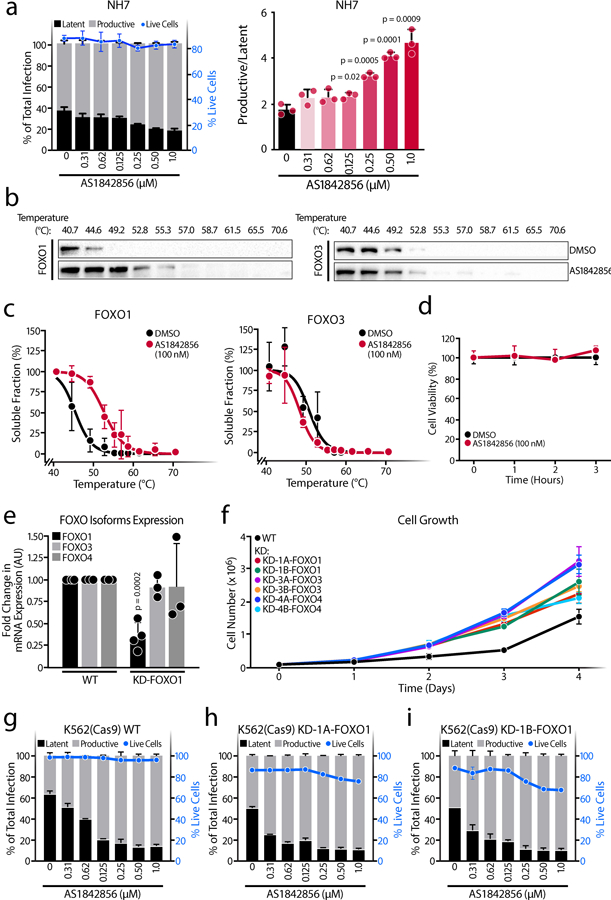
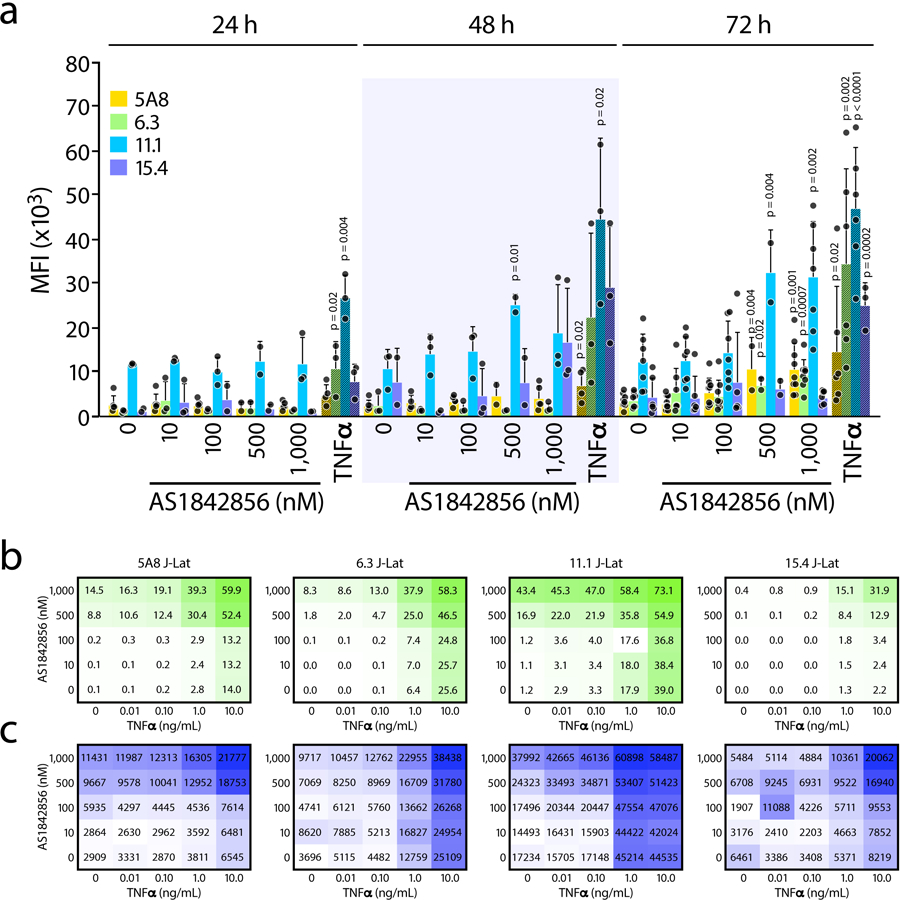
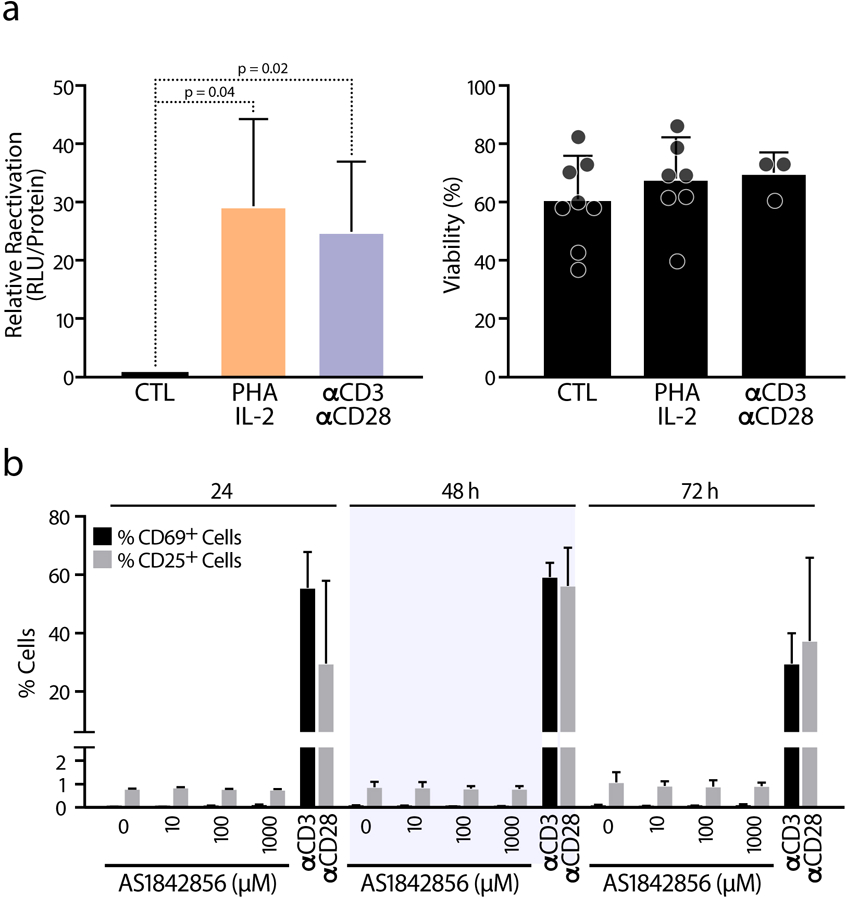
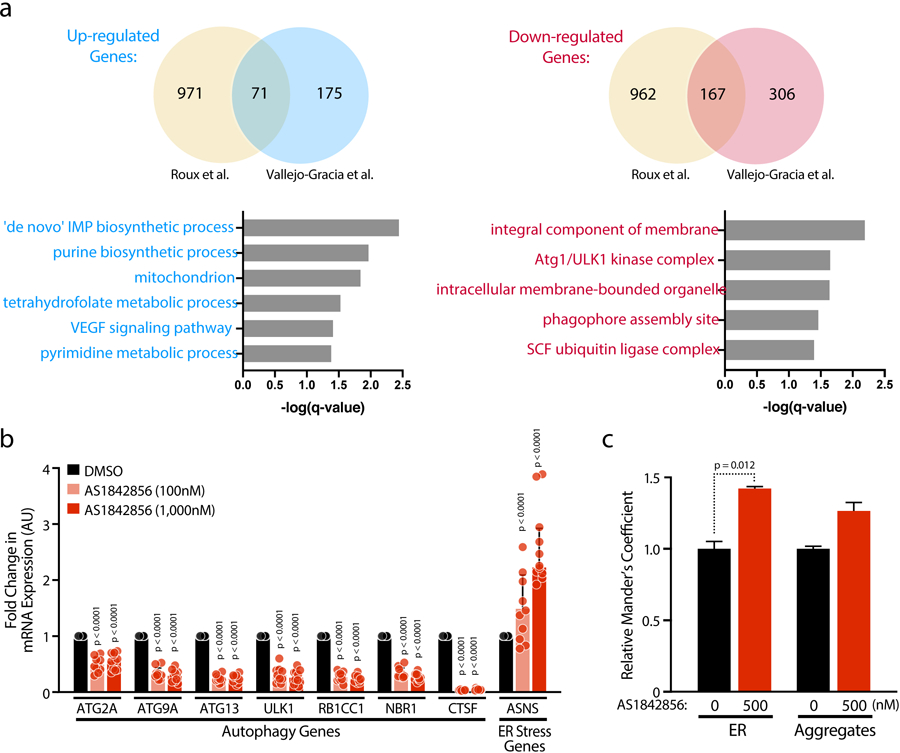
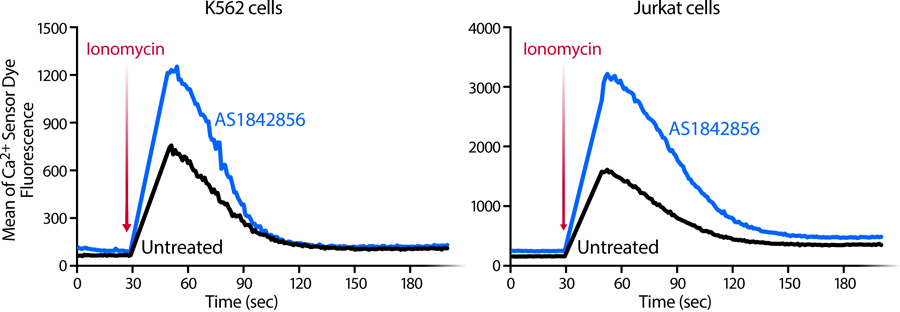
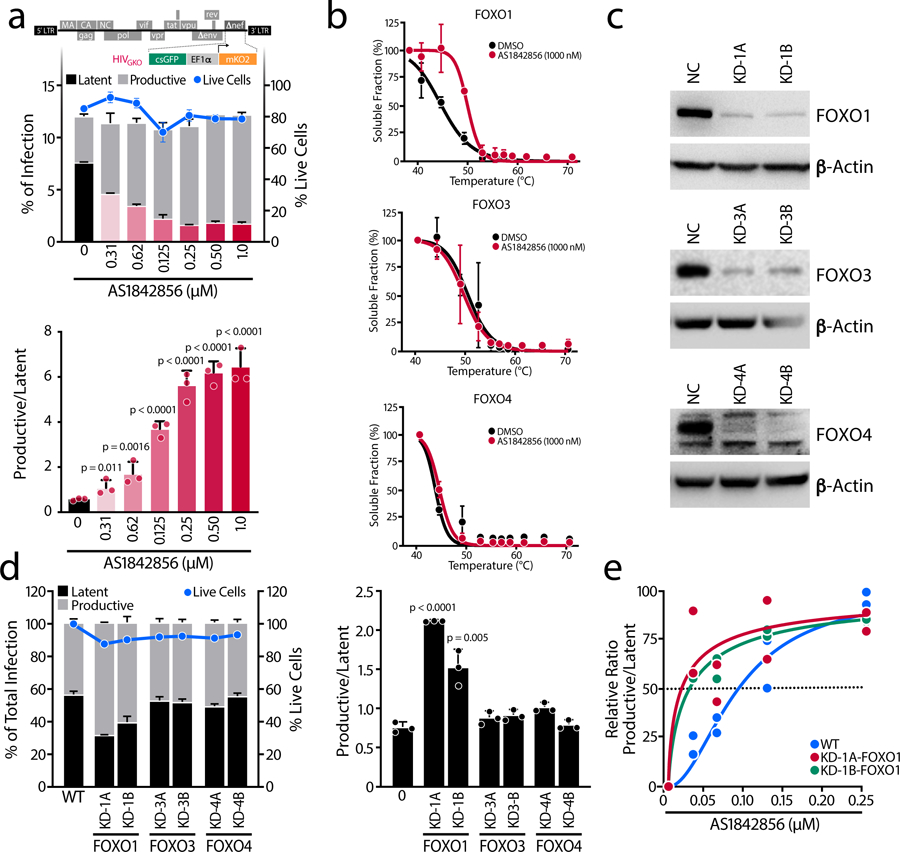
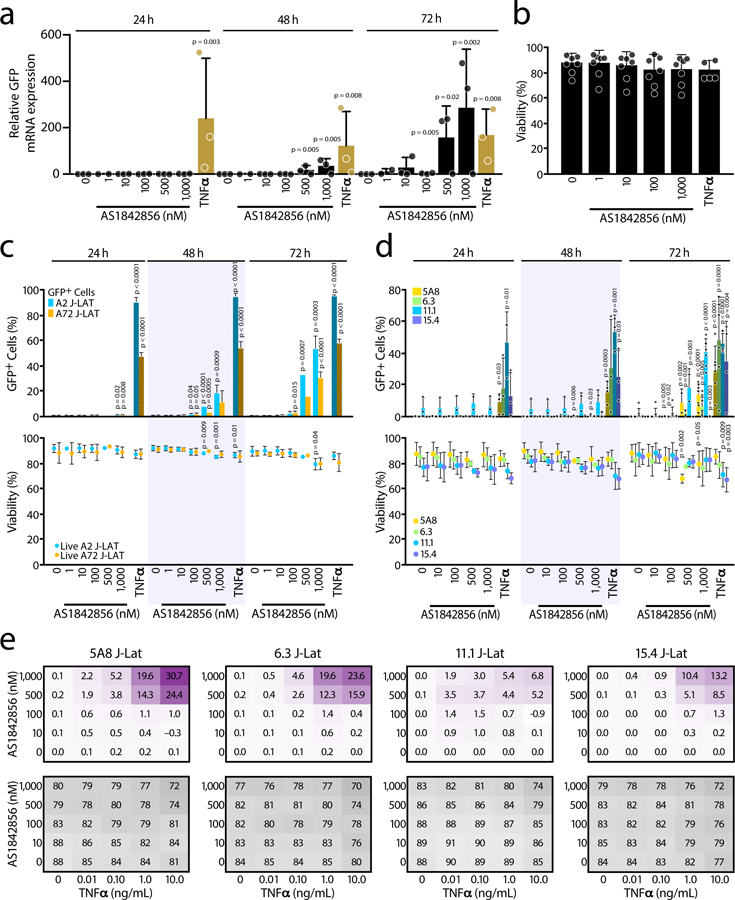
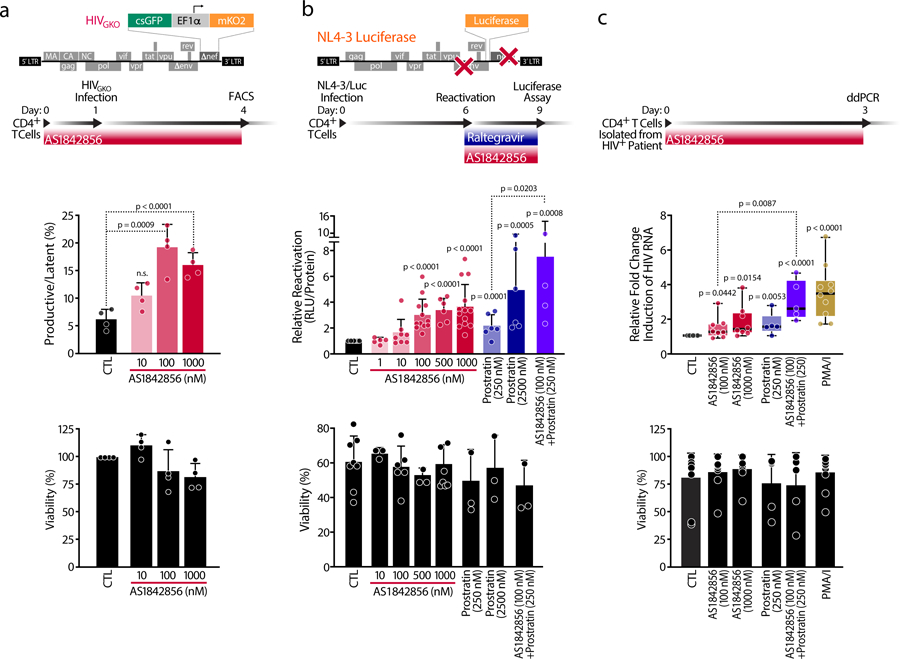
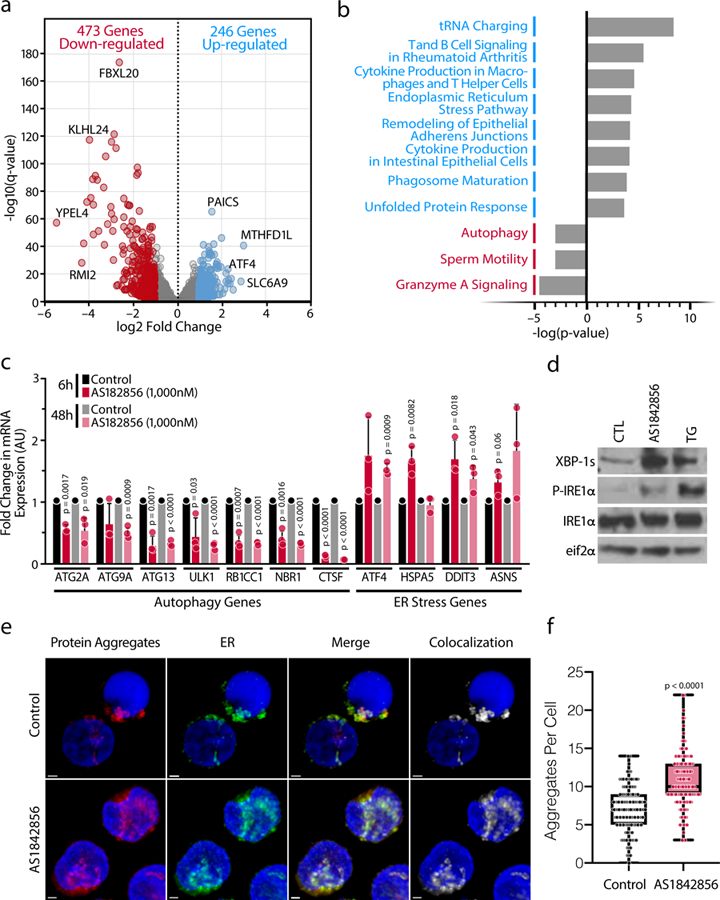
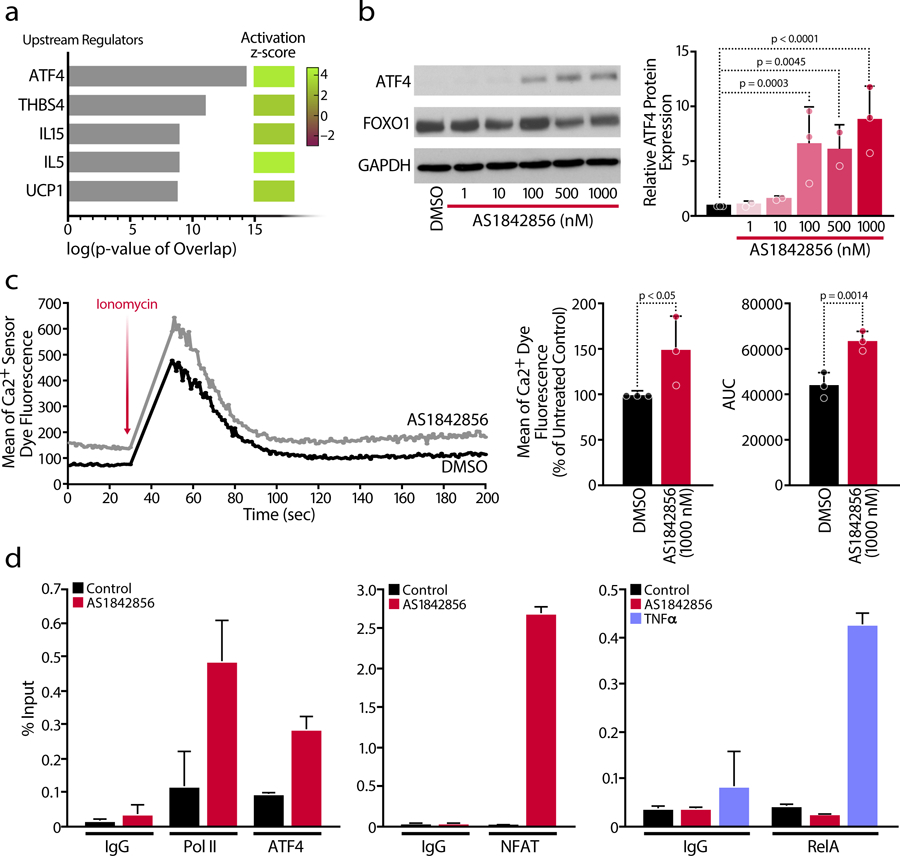
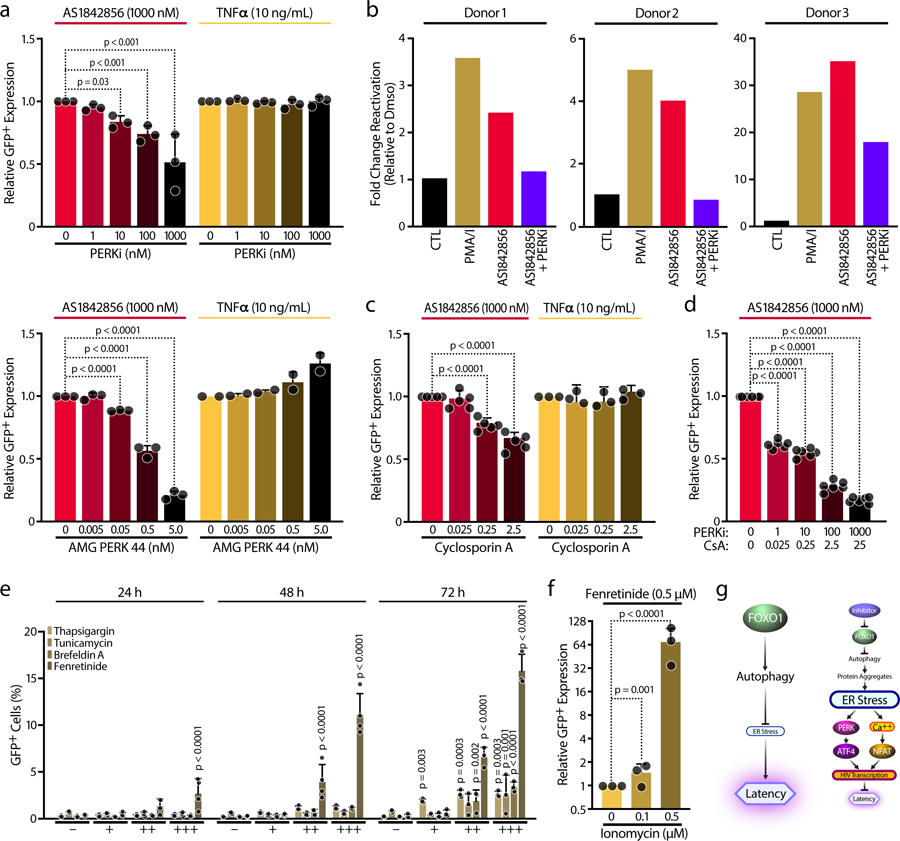
Quiescence is a hallmark of CD4+ T cells latently infected with human immunodeficiency virus 1 (HIV-1). While reversing this quiescence is an effective approach to reactivate latent HIV from T cells in culture, it can cause deleterious cytokine dysregulation in patients. As a key regulator of T-cell quiescence, FOXO1 promotes latency and suppresses productive HIV infection. We report that, in resting T cells, FOXO1 inhibition impaired autophagy and induced endoplasmic reticulum (ER) stress, thereby activating two associated transcription factors: activating transcription factor 4 (ATF4) and nuclear factor of activated T cells (NFAT). Both factors associate with HIV chromatin and are necessary for HIV reactivation. Indeed, inhibition of protein kinase R-like ER kinase, an ER stress sensor that can mediate the induction of ATF4, and calcineurin, a calcium-dependent regulator of NFAT, synergistically suppressed HIV reactivation induced by FOXO1 inhibition. Thus, our studies uncover a link of FOXO1, ER stress and HIV infection that could be therapeutically exploited to selectively reverse T-cell quiescence and reduce the size of the latent viral reservoir.


Conflict of interest statement

Competing interests

The authors declare that there is no conflict of interest.

Figures

Extended Data Fig 1.
a, Jurkat-derived NH7(Cas9) cells were treated with increasing concentrations of the FOXO1 inhibitor AS1842856 just after HIVGKO infection. After 3–4 days, the percentage of latent and productively infected cells were quantified by FACS. In left panel, percentage of productively or latently cells relative to the total infection rate (bars) and total cell viability (blue dotted line) of a representative experiment. In the right panel, ratios of productive versus latent populations relative to the total infection rate upon increasing concentrations of AS1842856 treatments. Data are represented as mean ± SD of triplicate values, representative of n = 3 independent experiments. b, Representative western blots of CETSA assays in FOXO1 and FOXO3 in the presence or absence of 100 nM AS1842856. c, FOXO1 and FOXO3 CETSA-melting curves upon the presence or absence of AS1842856 100 nM in K562(Cas9) cells. Band intensities obtained from western blot analysis were normalized to the highest western blot signal which has been set to 100 %. Relative FOXO-band intensities were plotted against corresponding incubation temperatures and a nonlinear least-squares regression fit was applied. Data represent the mean ± SD of n = 3 individual experiments. d, Cell viability of CETSA assay in FOXO1 experiments assessed by Trypan Blue exclusion. Data represent the mean ± SD of three individual experiments. e, FOXO1, FOXO3 and FOXO4 gene expression in KD-1A-FOXO1 K562(Cas9) cell line analyzed by RT-qPCR, normalized to RPL13A mRNA. Data represent mean ± SD of n = 3 individual experiments, except for FOXO1 (n = 4). f, Cell growth analysis of WT, FOXO1, FOXO3 and FOXO4 knockdowns K562(Cas9) cell lines. Data are represented as mean ± SD of triplicate values. g-i, Percentage of productive or latent cells relative to the total infection rate and cell viability upon increasing concentrations of AS1842856 treatment in the WT K562(Cas9) (g) or in the FOXO1-knockdown cell lines KD-1A (h) and KD-1B (i). Data are represented as mean ± SD of n = 2 independent experiments.
Extended Data Fig 2.
a, J-Lat cell lines 5A8, 6.3, 11.1 and 15.4 were treated with increasing concentrations of AS1842856 for 24, 48 and 72 h and HIV-GFP reactivation was analyzed by flow cytometry. HIV-GFP reactivation is reported as a Mean Intensity Fluorescence (MFI) of GFP-expressing cells. Data represent mean ± SD of n ≥ 3 independent experiments. 10 ng/mL TNFα was used as control. b, J-Lat cell lines 5A8, 6.3, 11.1 and 15.4 were treated for 72 h with increasing concentrations of both AS1842856 (Y-axis) and TNFα (X-axis) alone or in combination and analyzed by FACS. HIV-GFP reactivation is reported as a percentage of GFP-expressing cells (% GFP + cells) or c, Mean Intensity Fluorescence (MFI). Data represent mean of n = 3 independent experiments.
Extended Data Fig 3.
a, HIV reactivation was measured by luciferase activity and cell viability by flow cytometry assessed in CD4 T cells purified from blood of healthy donors and infected with HIV and letting them rest for 6 days before reactivation was induced with 10 μg/mL PHA + 100 U/mL IL-2 and 10 μg/mL αCD3 + 1 μg/mL αCD28 for 72 h, in the presence of raltegravir (30 μM). Data represent average ± SD of n ≥ 3 independent experiments. b, The cell surface CD69 and CD25 T cell activation markers were measured by FACS in CD4 T cells upon AS1842856 treatment for 24, 48 and 72 h. 10 μg/mL αCD3 and 1 μg/mL αCD28 was used as control. Data is shown as mean of percentage of positive cells and as mean ± SD of n = 2 biological replicates.
Extended Data Fig 4.
a, Venn diagrams (top panels) comparing the up- and down-regulated genes from a recently published Affimmetrix microarray[19] and RNA-Seq data presented here (Vallejo-Gracia et al.). GO Enrichment Analysis (Biological Processes and Cellular Components) from overlapped dysregulated genes from the two datasets. b, Confirmation of selected up- or down-regulated genes and pathways after 72 h AS1842856 treatment in CD4 T cells of HIV-infected patients on antiretroviral therapy with undetectable viral load by RT-qPCR, normalized to RPL13A mRNA. Data represent mean ± SD of n = 10 individual donors. c, The thresholded Mander’s correlation coefficients were determined and P value was calculated by unpaired Student’s t test. n = 90 cells per condition. Data are represented as mean ± SD.
Extended Data Fig 5.
Representative plots of intracellular calcium-flux kinetics in K562(Cas9) and Jurkat cell lines in the presence or absence of AS1842856 (100 nM). Cells were stained with a membrane permeable calcium sensor dye in PBS and stimulated by adding Ionomycin after 30 seconds resulting in an increase of fluorescence indicating a calcium mobilization from the ER. Representative experiments of n = 3 independent experiments.
Extended Data Fig 6.
a, J-Lat cell line A58 was treated with increasing concentrations of GCN2i (A-92) in combination with 1,000 nM AS1842856 (72 h) or 10 ng/mL TNFα (24 h). In the upper panel, HIV-GFP reactivation was analyzed by FACS and relativized to the control. In the lower panel, histogram plots of percent live cells for each drug treatment are shown. Data are represented by mean ± SD of n = 3 different experiments. b, Same experiment as in Extended Data Fig. 6a but treating cells with increasing concentrations of PKRi (Imidazolo-oxindole PKR inhibitor C16). Data are represented by mean ± SD of three different experiments. c, Same experiment as in Extended Data Fig. 6a but treating cells with increasing concentrations of PERKi (GSK2656157 / PERK inhibitor II) (top panels) or the highly specific PERK inhibitor (AMG PERK 44) (lower panels). Histogram plots of percent live cells for each drug treatment are shown. Data represent mean ± SD of n = 3 independent experiments. d, Same experiment as in Extended Data Fig. 6a, but cells were treated with increasing concentrations of IRE1αi (MKC8866). Data are represented by mean ± SD of n = 3 different experiments. e, J-Lat cell line A58 was treated with increasing concentrations of IRE1αi (MKC8866) in combination with 1 μM Thapsigargin (6 h). Data are represented by mean ± SD of n = 3 different experiments. f, Same experiment as in Extended Data Fig. 6a but treating cells with increasing concentrations of CsA (Cyclosporin A) (left panels) or the combined concentrations of PERKi and Cyclosporin A (right panels). Histogram plots of percent live cells for each drug treatment are shown. Data represent mean ± SD of n ≥ 3 independent experiments. g, J-Lat cell line A58 was treated with increasing concentrations of Thapsigargin (0.01, 0.1, 1 μM), Brefeldin A (0.01, 0.1, 1 μg/mL) and Fenretinide (0.5, 2, 5 μM) for 24, 48 and 72 h (bottom right). Histogram plots of percent live cells for each drug treatment are shown. Data represent mean ± SD of n = 3 independent experiments. h, J-Lat cell line A58 was treated with increasing concentrations of Ionomycin (0.01, 0.1, 0.5, 1 μM) for 24, 48 and 72 h and HIV-GFP reactivation (upper panel) and cell viability (lower panel) were analyzed by FACS. Data represent mean ± SD of n = 3 independent experiments. i, J-Lat cell line 5A8 was treated for 72 h with increasing concentrations of both Fenretinide (Y-axis) and Ionomycin (X-axis) alone or in combination and analyzed by FACS. HIV-GFP reactivation is reported as a percentage of GFP-expressing cells (% GFP + cells) (upper panel) and viability was measured by FACS (bottom panel). Data represent average of n = 3 independent experiments.
Figure 1.
Figure 1.. FOXO1 is a Specific Regulator of HIV Latency Establishment.
a, Schematic representation of HIVGKO dual-labeled HIV-1 reporter. K562(Cas9) cells were treated with increasing concentrations of the FOXO1 inhibitor AS1842856 just after HIVGKO infection. After 3–4 days, the percentage of latent and productively infected cells were quantified by FACS. In upper panel, amount of productively or latently infected cells (bars) and total cell viability (blue dotted line) of a representative experiment. In the lower panel, ratios of productive versus latent populations relative to the total infection rate upon increasing concentrations of AS1842856 treatments. Data are represented as mean ± SD of triplicate values, representative of n=3 independent experiments. b, FOXO1, FOXO3 and FOXO4 CETSA-melting curve shifts upon the presence or absence of AS1842856 1,000 nM in K562(Cas9) cells. Band intensities obtained from western blot analysis were normalized to the highest western blot signal. Relative FOXO-band intensities were plotted against corresponding incubation temperatures and a nonlinear least-squares regression fit was applied. Data represent the mean ± SD of n=3 independent experiments, except for FOXO4 (n=2). c, Efficiency of FOXO1, FOXO3 and FOXO4 knockdowns with two different sgRNAs determined by western blot. Cells transduced with NC (negative control) sgRNA lentiviruses were used as a control. Representative of n=3 independent experiments, except for FOXO3 (n=2). d, In the left graph, percentage of productive or latent cells relative to the total infection rate and cell viability in the different single knockdown K562(Cas9) cell lines. In the right graph, ratios of productive versus latent populations in K562(Cas9) cell lines with knockdown of FOXO1, FOXO3, or FOXO4. Data are represented as mean ± SD of triplicate values, representative of n=3 independent experiments. e, Ratios of productive versus latent populations upon increasing concentrations of AS1842856 in the WT K562(Cas9) or in the FOXO1-knockdown cell lines. Data are represented as mean of n=2 independent experiments fitted into a model.
Figure 2.
Figure 2.. FOXO1 Inhibition Reactivates HIV1 from Latency.
a, J-Lat cell line 5A8 was treated with increasing concentrations (1–1,000 nM) of AS1842856 for 24, 48 and 72 hours and HIV-GFP mRNA reactivation was assessed by RT-qPCR and normalized to RPL13A mRNA. Data represent average ± SD of three independent experiments. p-value relative to the control at each time point. b, Cell viability assessed by flow cytometry at 72 hours of the same experiment as in a. Cell viability was measured by gating on both the live population at the forward scatter (FSC) and side scatter (SSC) plot after staining with the viability dye. Data represent average ± SD of n≥4 independent experiments. c, J-Lat cell lines A2 and A72 were treated with increasing concentrations of AS1842856 for 24, 48 and 72 hours and HIV-GFP reactivation (bars) and cell viability (dots) were analyzed by FACS. HIV-GFP reactivation is reported as a percentage of GFP-expressing cells (% GFP+ cells). Data represent average ± SD of n≥3 independent experiments. d, Same experiments as in Fig. 2c but performed in J-Lat cell lines 5A8, 6.3, 11.1 and 15.4. Data represent average ± SD of n≥3 independent experiments. 10 ng/mL TNFα was used as control. e, J-Lat cell lines 5A8, 6.3, 11.1 and 15.4 were treated for 72 hours with increasing concentrations of both AS1842856 (Y-axis) and TNFα (X-axis) alone or in combination and analyzed by FACS. Calculation of synergy for drug combinations using the Bliss independence model applied to the HIV-GFP reactivation measured as a percentage of GFP-expressing cells (% GFP+ cells). Synergy (in purple) and cell viability (in grey) data points represent the mean effect from three independent experiments.
Figure 3.
Figure 3.. FOXO1 Inhibition Prevents Latency Establishment and Reactivates HIV in Primary CD4+ T cells and HIV-infected CD4+ T cells.
a, Schematic representation of HIVGKO dual-labeled HIV-1 reporter and of strategy used to treat primaryCD4+ T cells purified from blood of healthy donors and pre-treated for 24 hours with increasing concentrations of AS1842856. After infection of HIVGKO, resting cells were treated for 3 days with the same amounts of AS1842856 as in the pre-treatment. Top panel shows ratios of productive versus latent populations of infected CD4+ T cells from four different healthy donors after treatment. Lower panel shows a histogram plot of percent live cells for each drug treatment relative to the control. Data are represented by mean ± SD of n=4 different donors. b, Schematic representation of HIVNL4–3 Luciferase reporter virus and of experimental procedure with primary CD4+ T cells. Briefly, CD4+ T cells were purified from blood of healthy donors, were infected with HIVNL4–3 Luciferase and, after 6 days, the virus was reactivated for 3 days with increasing concentrations of AS1842856 and prostratin alone or in combination, in the presence of raltegravir (30 μM). HIV reactivation was measured by luciferase activity and cell viability by flow cytometry. Data are mean ± SEM of n≥5 individual donors. c, Fold change of cell-associated HIV-1 mRNA expression measured by ddPCR of CD4+ T cells of HIV-infected patients on antiretroviral-therapy with undetectable viral load treated with 50 ng/ml PMA + 1 μM Ionomycin (PMA/I) and with 0.2 % DMSO (CTL). AS1842856- and/or prostratin-treated CD4+ T cells led to an increase in fold change of cell-associated HIV mRNA expression. Data are represented as box plots of n≥5 independent experiments. Cell viability was assessed by Tripan Blue exclusion. Data are represented as mean ± SD of n≥5 independent experiments.
Figure 4.
Figure 4.. Marked Upregulation of ER Stress in Response to FOXO1 Inhibition in Primary CD4+ T cells.
a, Volcano plot from the RNA-Seq data comparing CD4+ T cells treated with AS1842856 (1,000 nM) versus DMSO control for 12 hours. Up-regulated (blue) or down-regulated (red) genes are q-value < 0.05 and log2 fold change ≥ 1 or ≤ −1, respectively. b, IPA pathway analysis of the most dysregulated canonical pathways for the up- and down-regulated genes. c, Confirmation of up- or down-regulated expression after 6 and 48 hours treatment of specific genes from altered pathways by RT-qPCR, normalized to RPL13A mRNA. Data represent mean ± SD of n=3 individual donors. d, Representative blots of protein expression of the ER stress markers XBP-1s, phosphorylated IRE1α and total IRE1α and total eIF2α (control). Representative experiment of n=3 independent experiments. e, Representative confocal microscopy images of primary CD4+ T cells isolated from PBMCs. Cells were treated with AS1842856 (500 nM) for 72 hours and processed for immunostaining after treatment with Proteostat (protein aggregates, red), GRP78 (endoplasmic reticulum, green), and Hoechst (nuclei, blue). The scale bars represent 1μm. Data are representative of n=3 independent experiments. f, The number of protein aggregates per cell. Data are represented as box plots: Control (min: 0, Q1: 5, center: 7, Q3: 9 max: 14), AS1842856 (min: 3, Q1: 9, center: 10, Q3: 13, max: 22). The P value was calculated by a linear mixed model by residual maximum likelihood. p-value < 2-16. n = 135 cells per condition.
Figure 5.
Figure 5.. FOXO1 Inhibition Induces HIV Reactivation in the Absence of NF-kB Recruitment via ATF4 and NFAT.
a, Analysis of the five top upstream regulators and table with their activation z-scores according to the RNA-Seq data. b, Representative blot of protein expression of the transcription factors ATF4 and FOXO1 (left) and densitometry analysis of ATF4 protein expression (right) was performed from n=3 individual donors. Data are mean ± SD. c, Representative plot of intracellular calcium-flux kinetics in primary CD4 T cells in the presence or absence of AS1842856 (100 nM). Cells were stained with a membrane permeable calcium sensor dye in PBS and stimulated by adding Ionomycin after 30 seconds resulting in an increase of fluorescence indicating a calcium mobilization from the ER. The mean of the calcium sensor dye fluorescence at basal condition (before Ionomycin stimulation, 0–30 sec) and the parameter Area Under the Curve (AUC) relative to the calcium flux were calculated. Data are represented as mean ± SD of n=3 independent experiments. d, Chromatin immunoprecipitation (ChIP) assays with antibodies against Pol II, ATF4, RelA, NFAT and IgG control at the HIV LTR, followed by qPCR using primers specific for HIV-1 LTR Nuc0 or Nuc1. Chromatin was prepared from J-Lat A2 and 5A8 cells, in which the LTR was stimulated by 1,000 nM AS1842856 treatment, 10 ng/mL TNFα or which were left untreated/DMSO. Representative experiment of n=3 independent biological experiments. Data are represented as mean ± SD of n=3 independent technical replicates.
Figure 6.
Figure 6.. Induction of ER stress promotes HIV reactivation.
a, J-Lat cell line 5A8 were treated with increasing concentrations of PERKi (GSK2656157 / PERK inhibitor II) (top panels) or the highly specific PERK inhibitor (AMG PERK 44) (lower panels) and co-treated with 1,000 nM AS1842856 (72 hours) or 10 ng/mL TNFα (24 hours). HIV-GFP reactivation was analyzed by FACS and normalized to the control. Data shown are mean ± SD of n=3 independent experiments. b, Effect of 50 ng/ml PMA + 1 μM Ionomycin (PMA/I), AS1842856 (1,000 nM) and AS1842856 (1,000 nM) with 1 μM PERKi (GSK2656157 / PERK inhibitor II) on HIV-1 mRNA expression in CD4+ T cells of n=3 HIV-infected patients on antiretroviral-therapy with undetectable viral load measured by ddPCR. c, Same experiment as in Fig. 6a, but cells were treated with increasing concentrations of Cyclosporin A (CsA). d, Similar experiment that in Fig. 5b or Fig. 5c, but combining increasing concentrations of PERKi (GSK2656157 / PERK inhibitor II) and Cyclosporin A (CsA). Data represent mean ± SD of n=6 independent experiments. e, J-Lat cell line A58 was treated with increasing concentrations of Thapsigargin (0.01, 0.1, 1 µM), Tunicamycin (0.1, 0.5, 1 µg/mL), Brefeldin A (0.01, 0.1, 1 µg/mL) and Fenretinide (0.5, 2, 5 µM) for 24, 48 and 72 hours and HIV-GFP reactivation was analyzed by FACS. Data shown are mean ± SD of n≥3 independent experiments. f, J-Lat cell line A58 was treated with 0.5 µM Fenretinide and increasing concentrations of Ionomycin. HIV-GFP reactivation and cell viability were analyzed by FACS. Data are mean ± SD of n=3 independent experiments. g, Model: FOXO1 inhibition impairs autophagy, thus promoting protein accumulation and leading to ER Stress. Thus, ATF4 activation through PERK and NFAT via cytosolic calcium release will promote HIV transcription and will prevent HIV latency.

References

    1. Barré-Sinoussi F, Ross AL & Delfraissy J-F Past, present and future: 30 years of HIV research. Nat. Rev. Microbiol 11, 877–883 (2013). - PubMed
    1. Archin NM, Sung JM, Garrido C, Soriano-Sarabia N & Margolis DM Eradicating HIV-1 infection: seeking to clear a persistent pathogen. Nat. Rev. Microbiol 12, 750–764 (2014). - PMC - PubMed
    1. Ruelas DS & Greene WC An Integrated Overview of HIV-1 Latency. Cell 155, 519–529 (2013). - PMC - PubMed
    1. Besnard E et al. The mTOR Complex Controls HIV Latency. Cell Host Microbe 20, 785–797 (2016). - PMC - PubMed
    1. Dahabieh MS, Battivelli E & Verdin E Understanding HIV Latency: The Road to an HIV Cure. Annu. Rev. Med 66, 407–421 (2015). - PMC - PubMed

Publication types

MeSH terms

Substances