. 2020 Nov;38(11):1317-1327.
doi: 10.1038/s41587-020-0555-7. Epub 2020 Jun 15.

CHANGE-seq reveals genetic and epigenetic effects on CRISPR-Cas9 genome-wide activity

Affiliations

CHANGE-seq reveals genetic and epigenetic effects on CRISPR-Cas9 genome-wide activity

Cicera R Lazzarotto et al. Nat Biotechnol. 2020 Nov.

Abstract

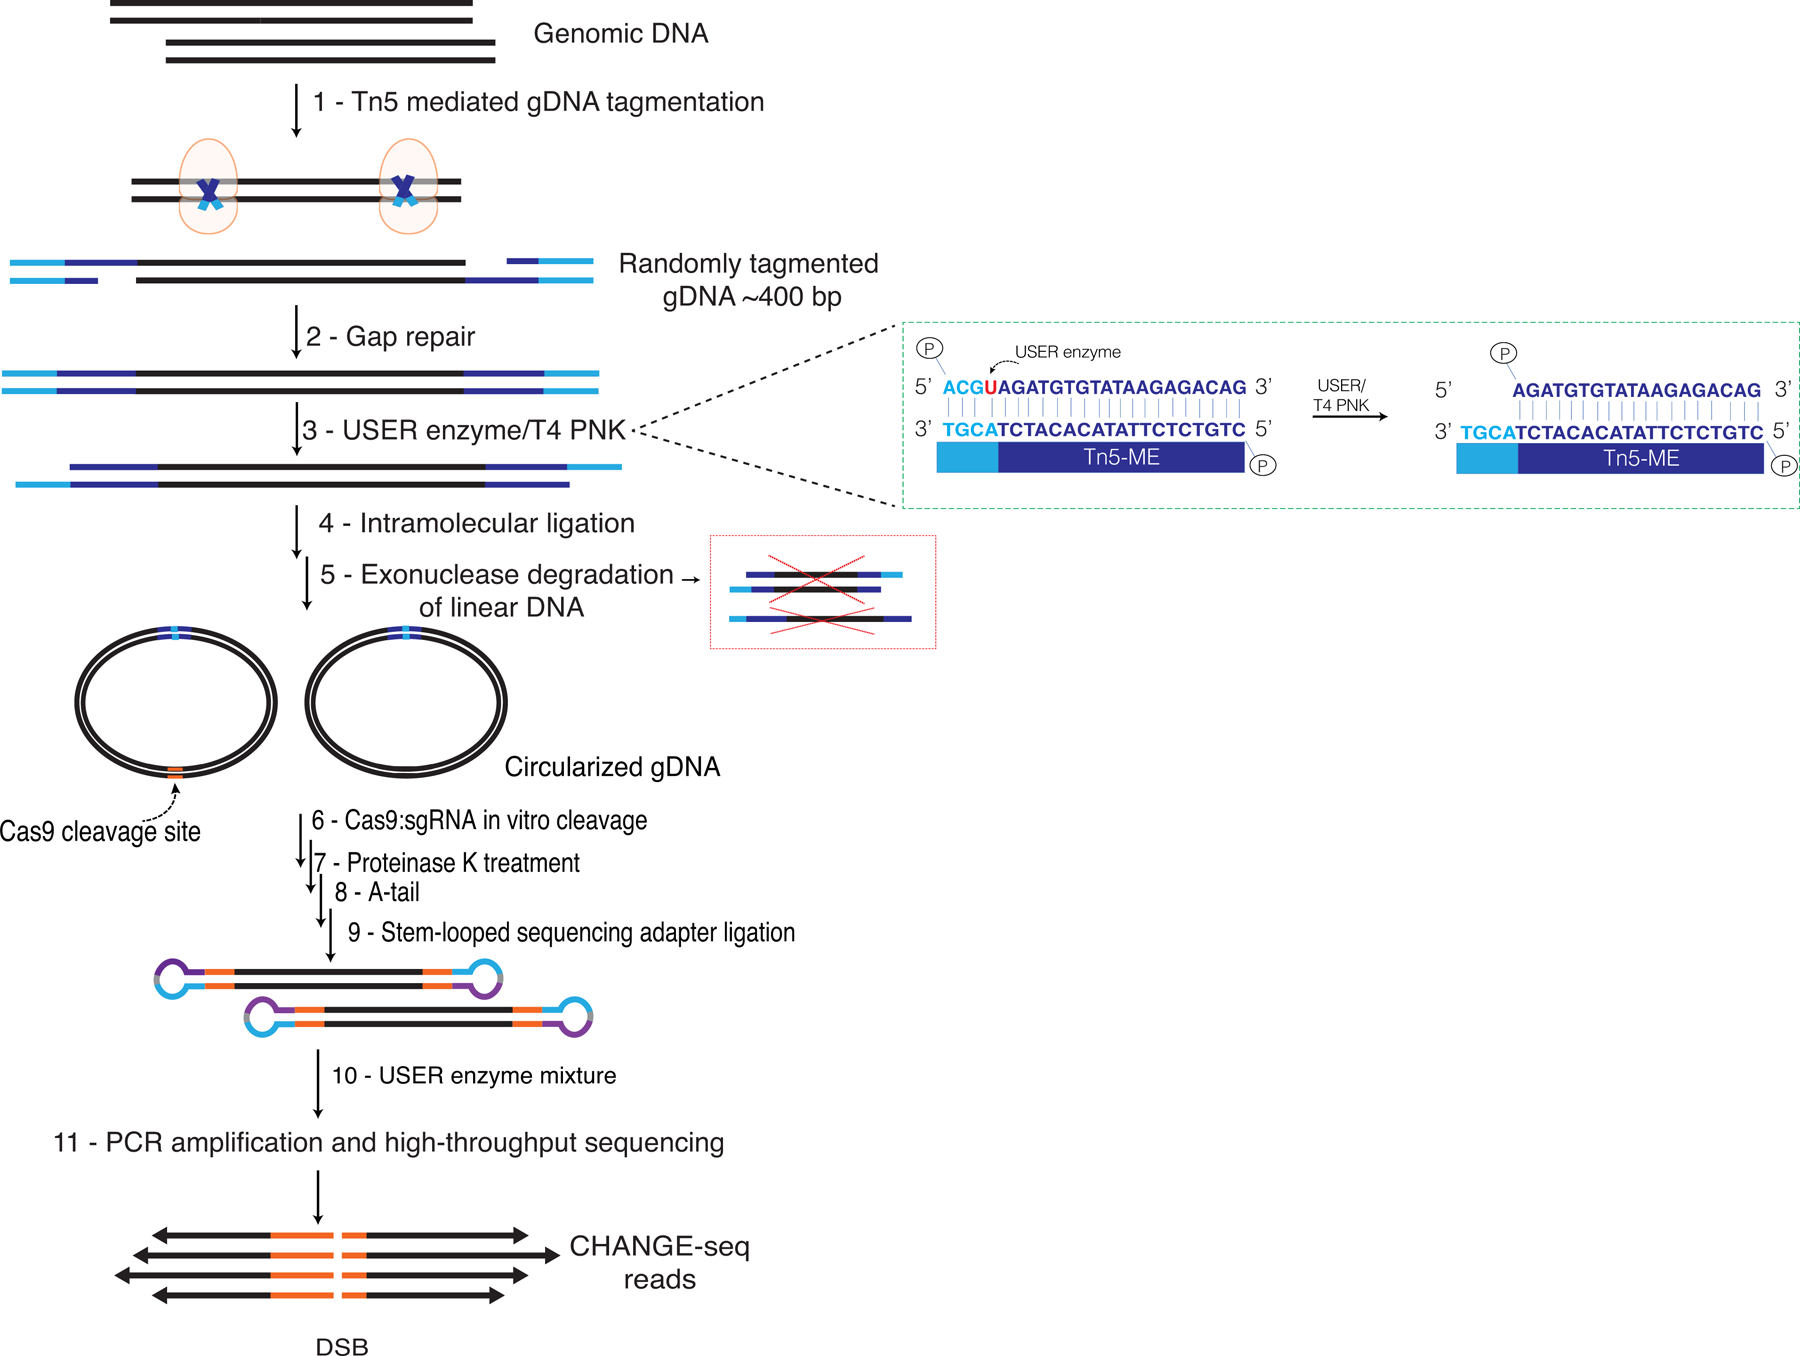
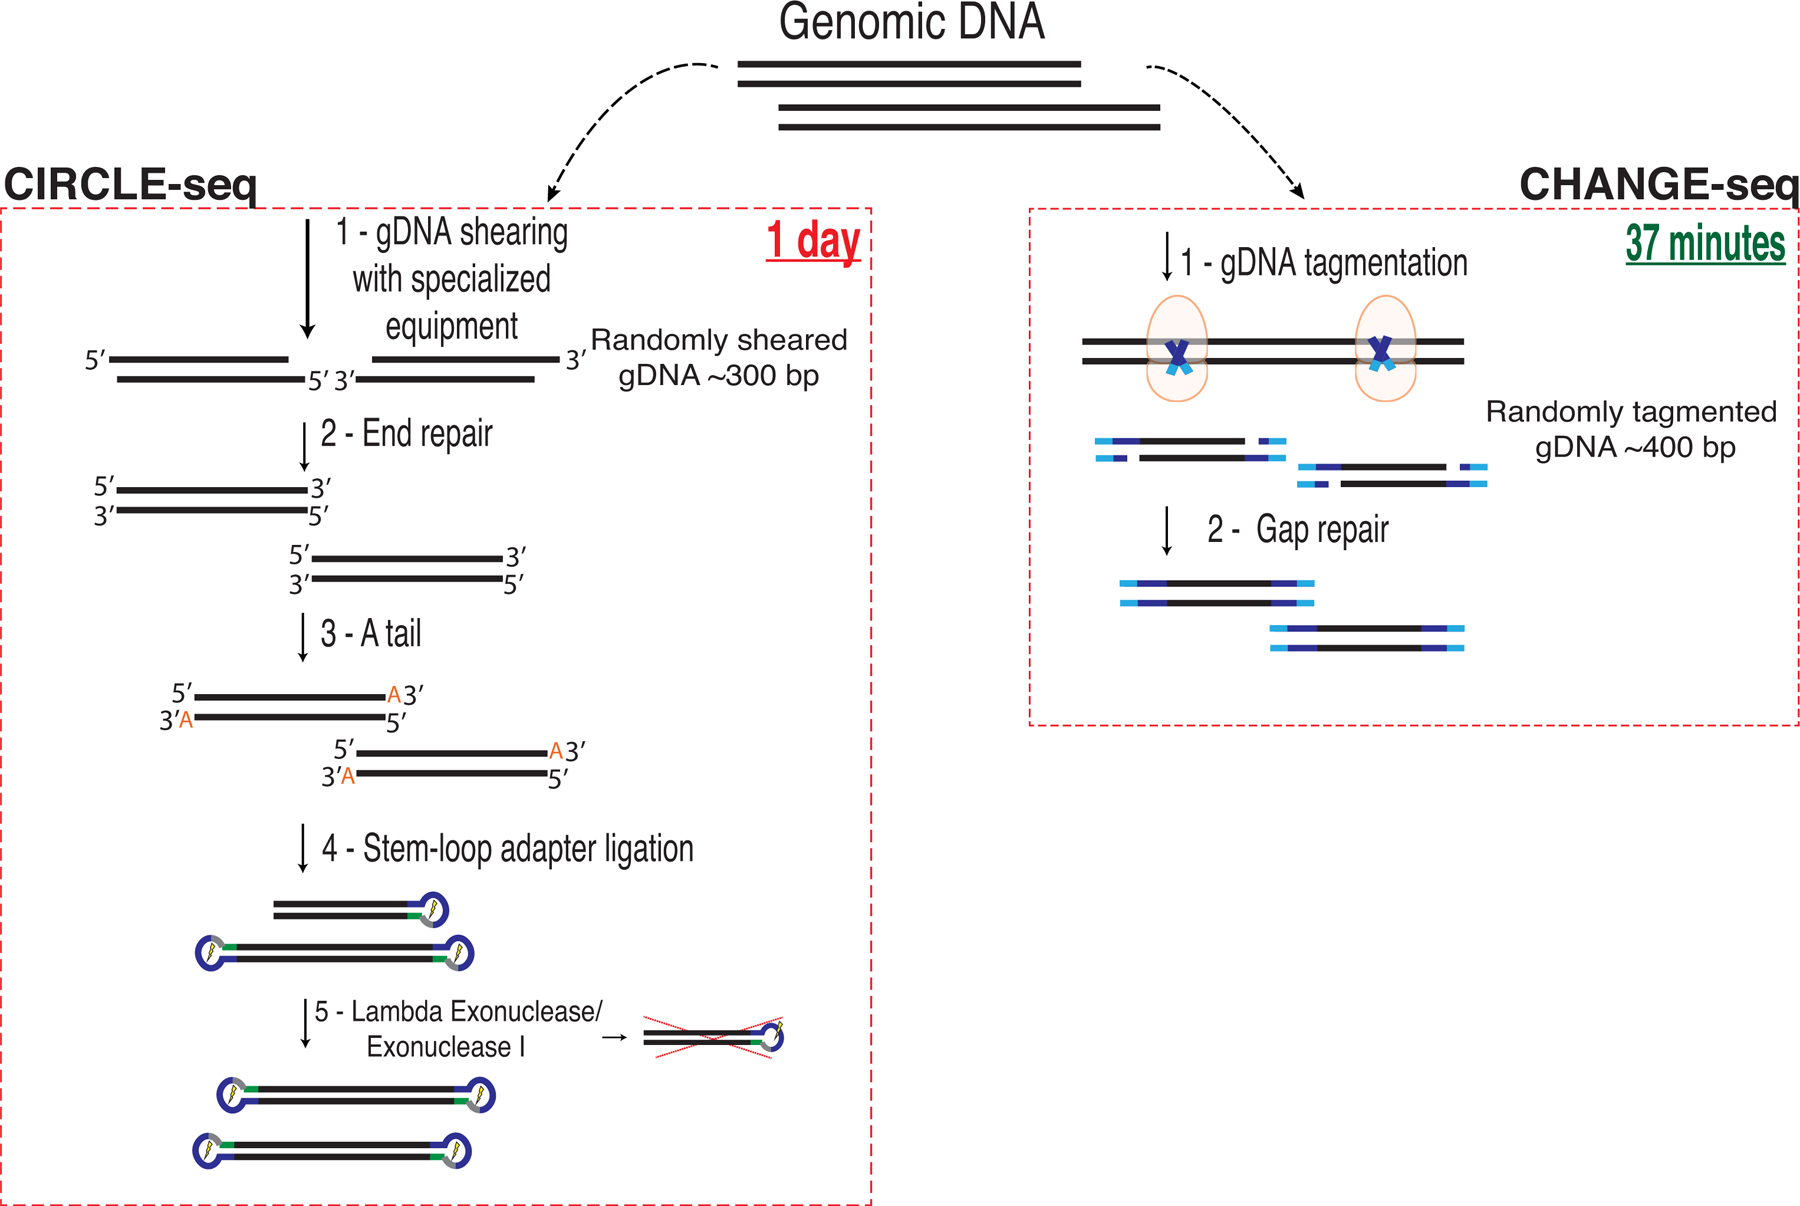
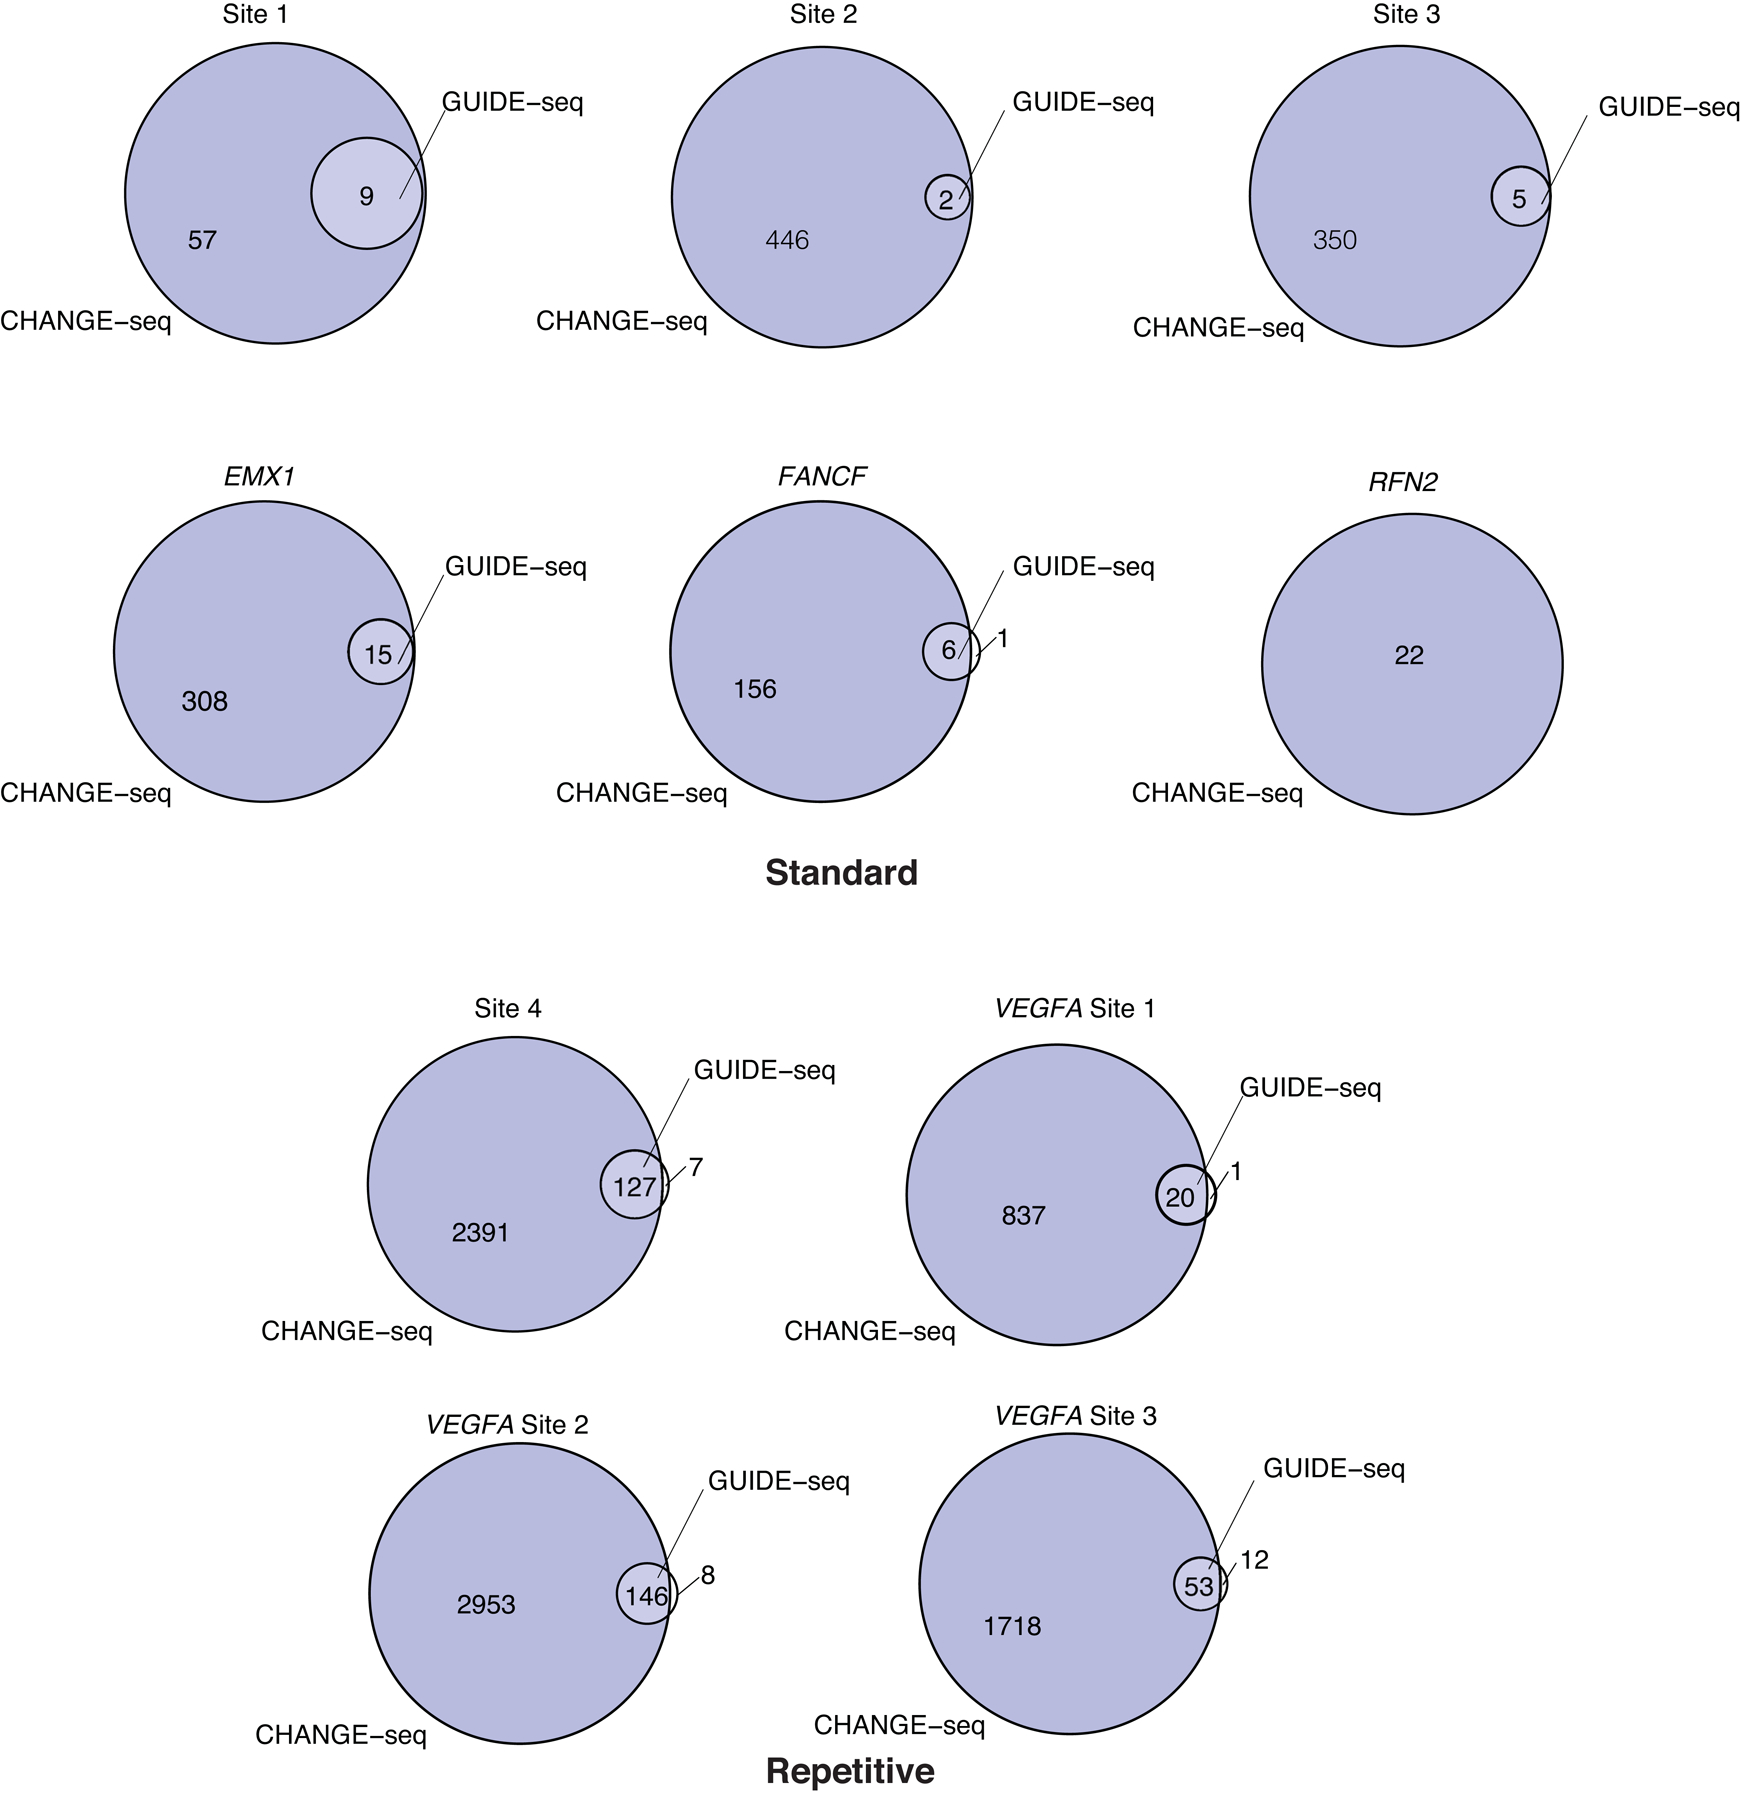
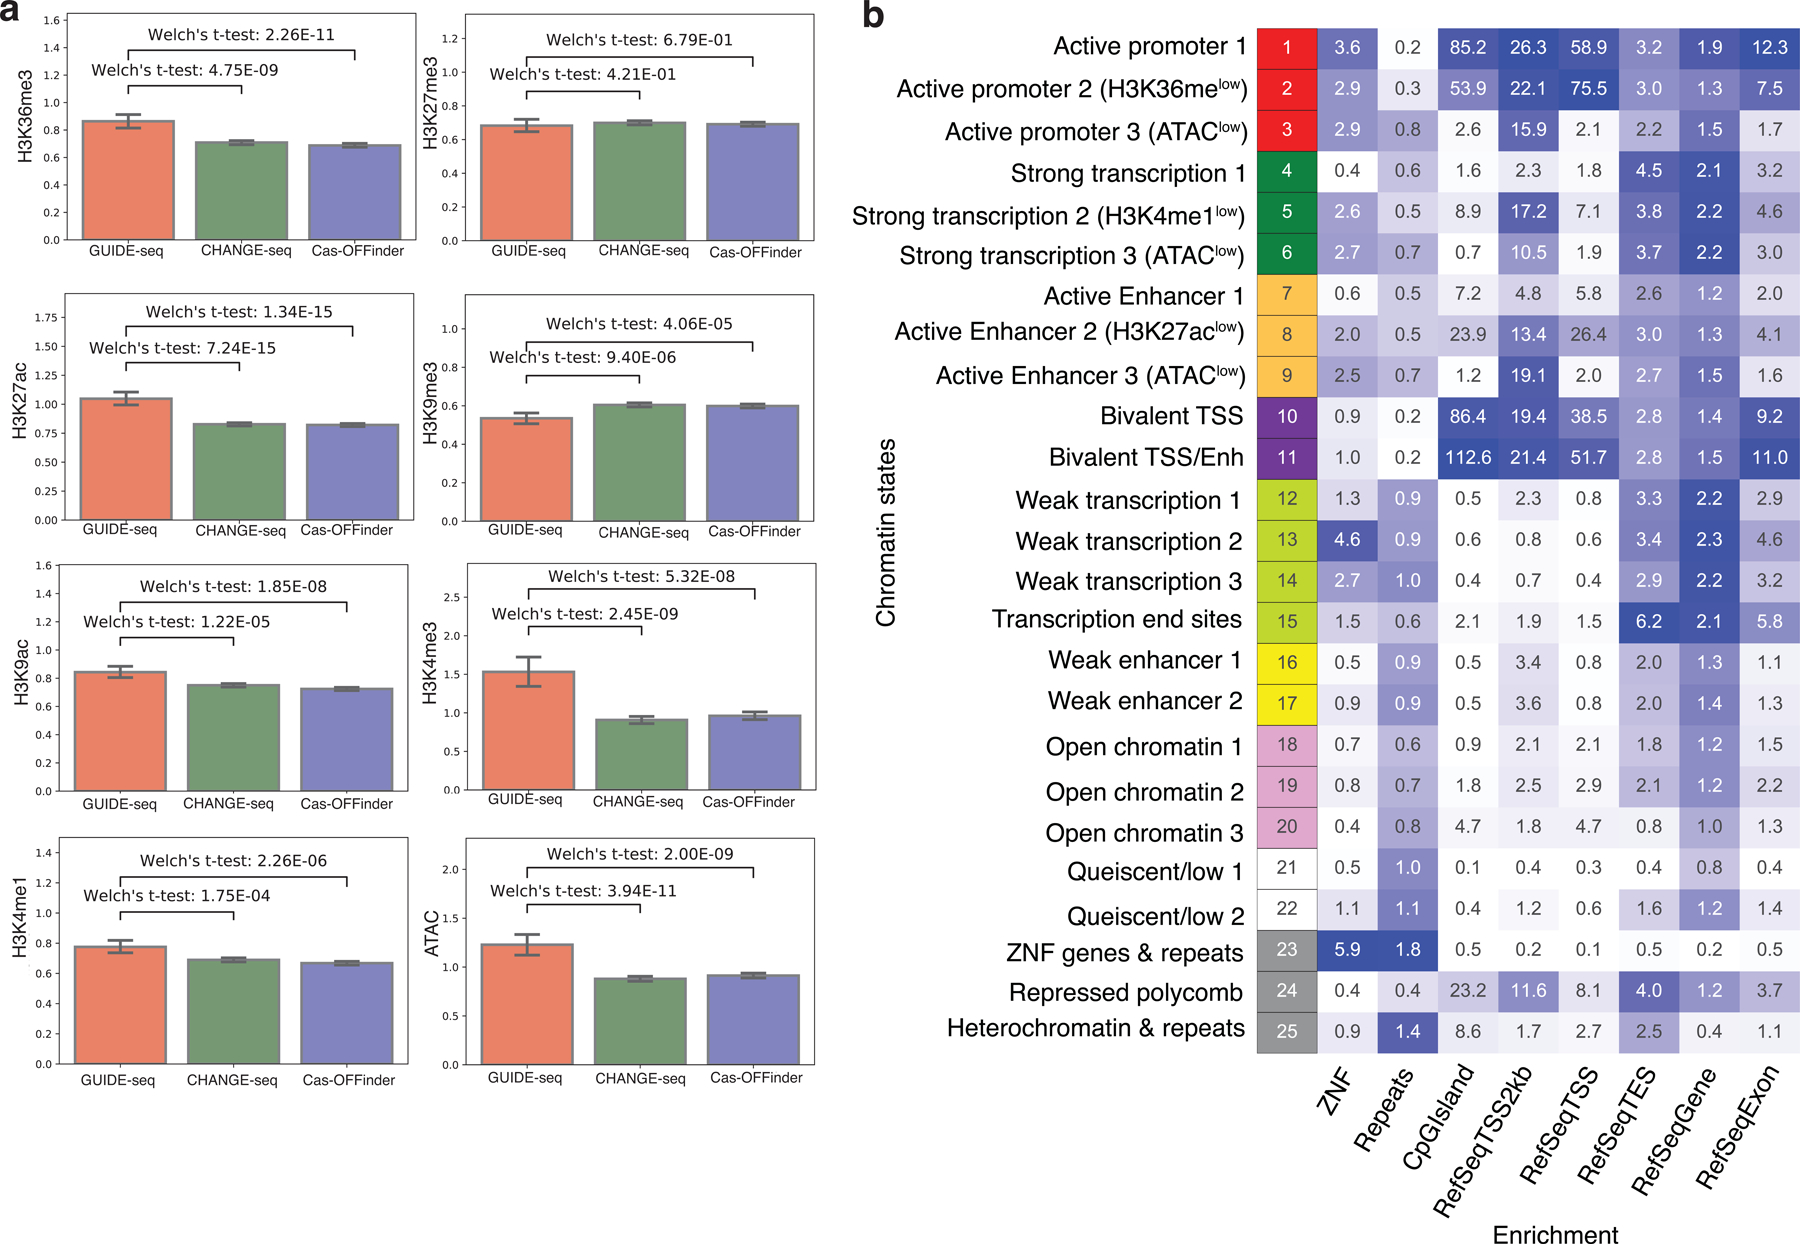
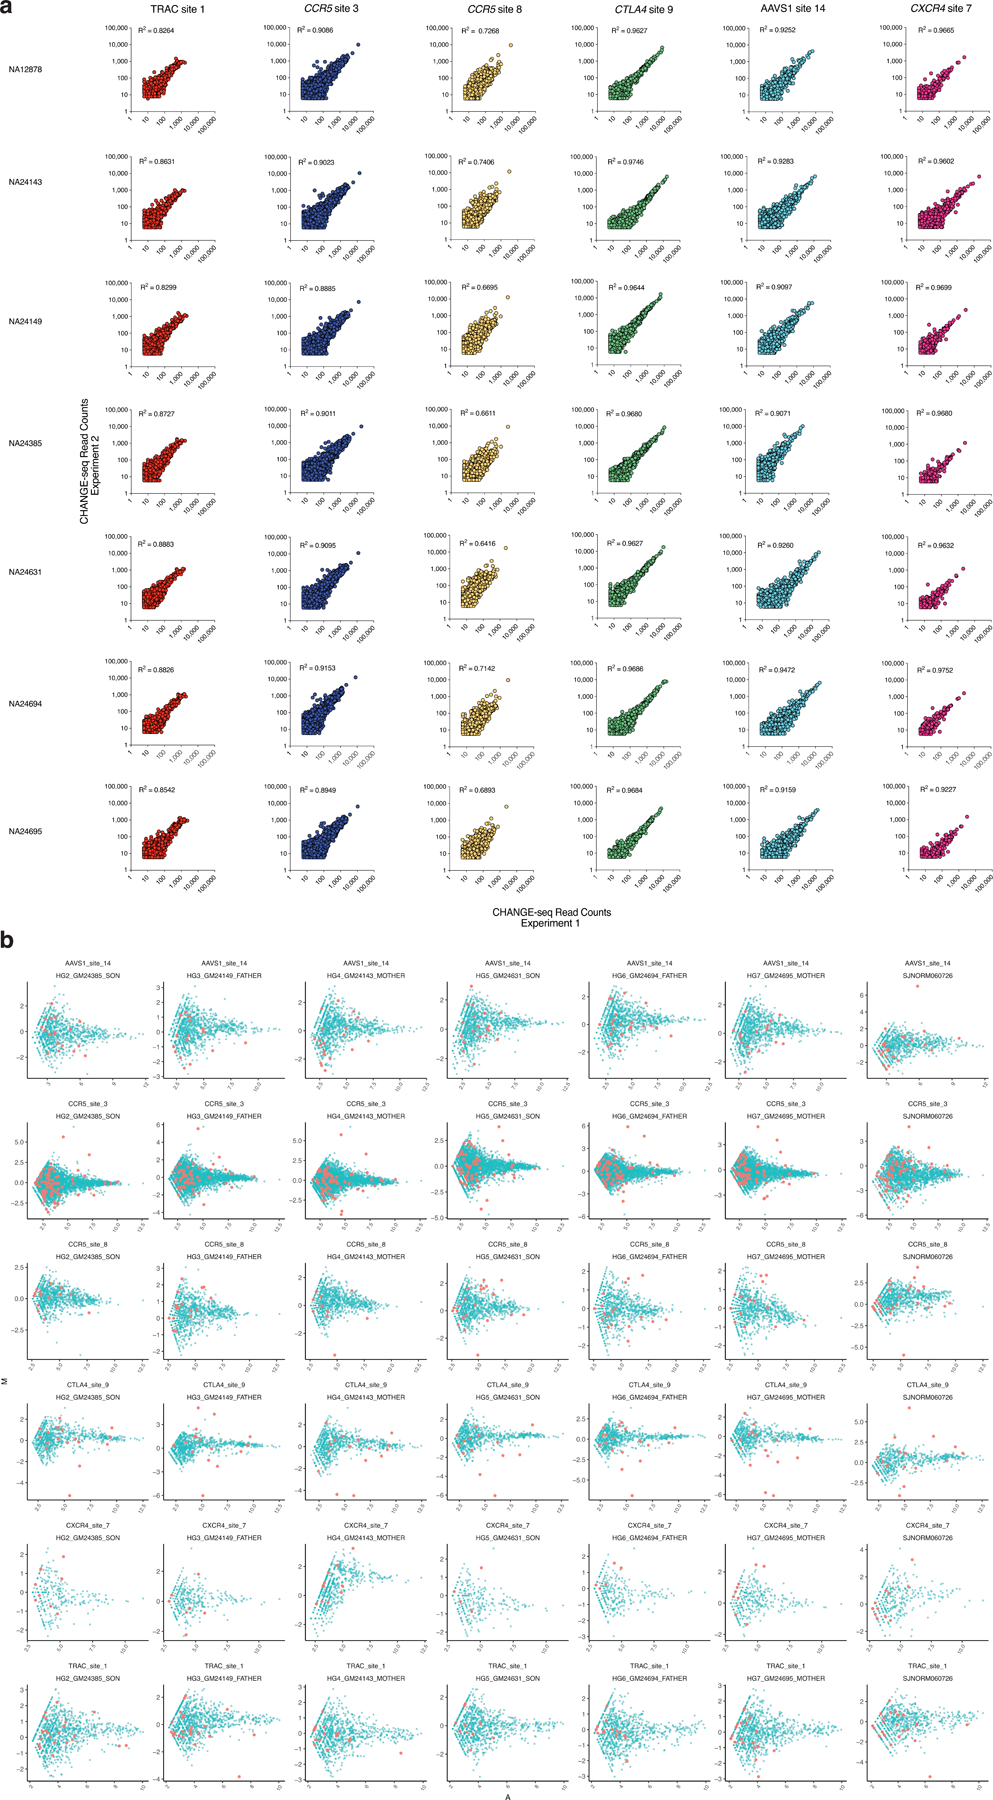
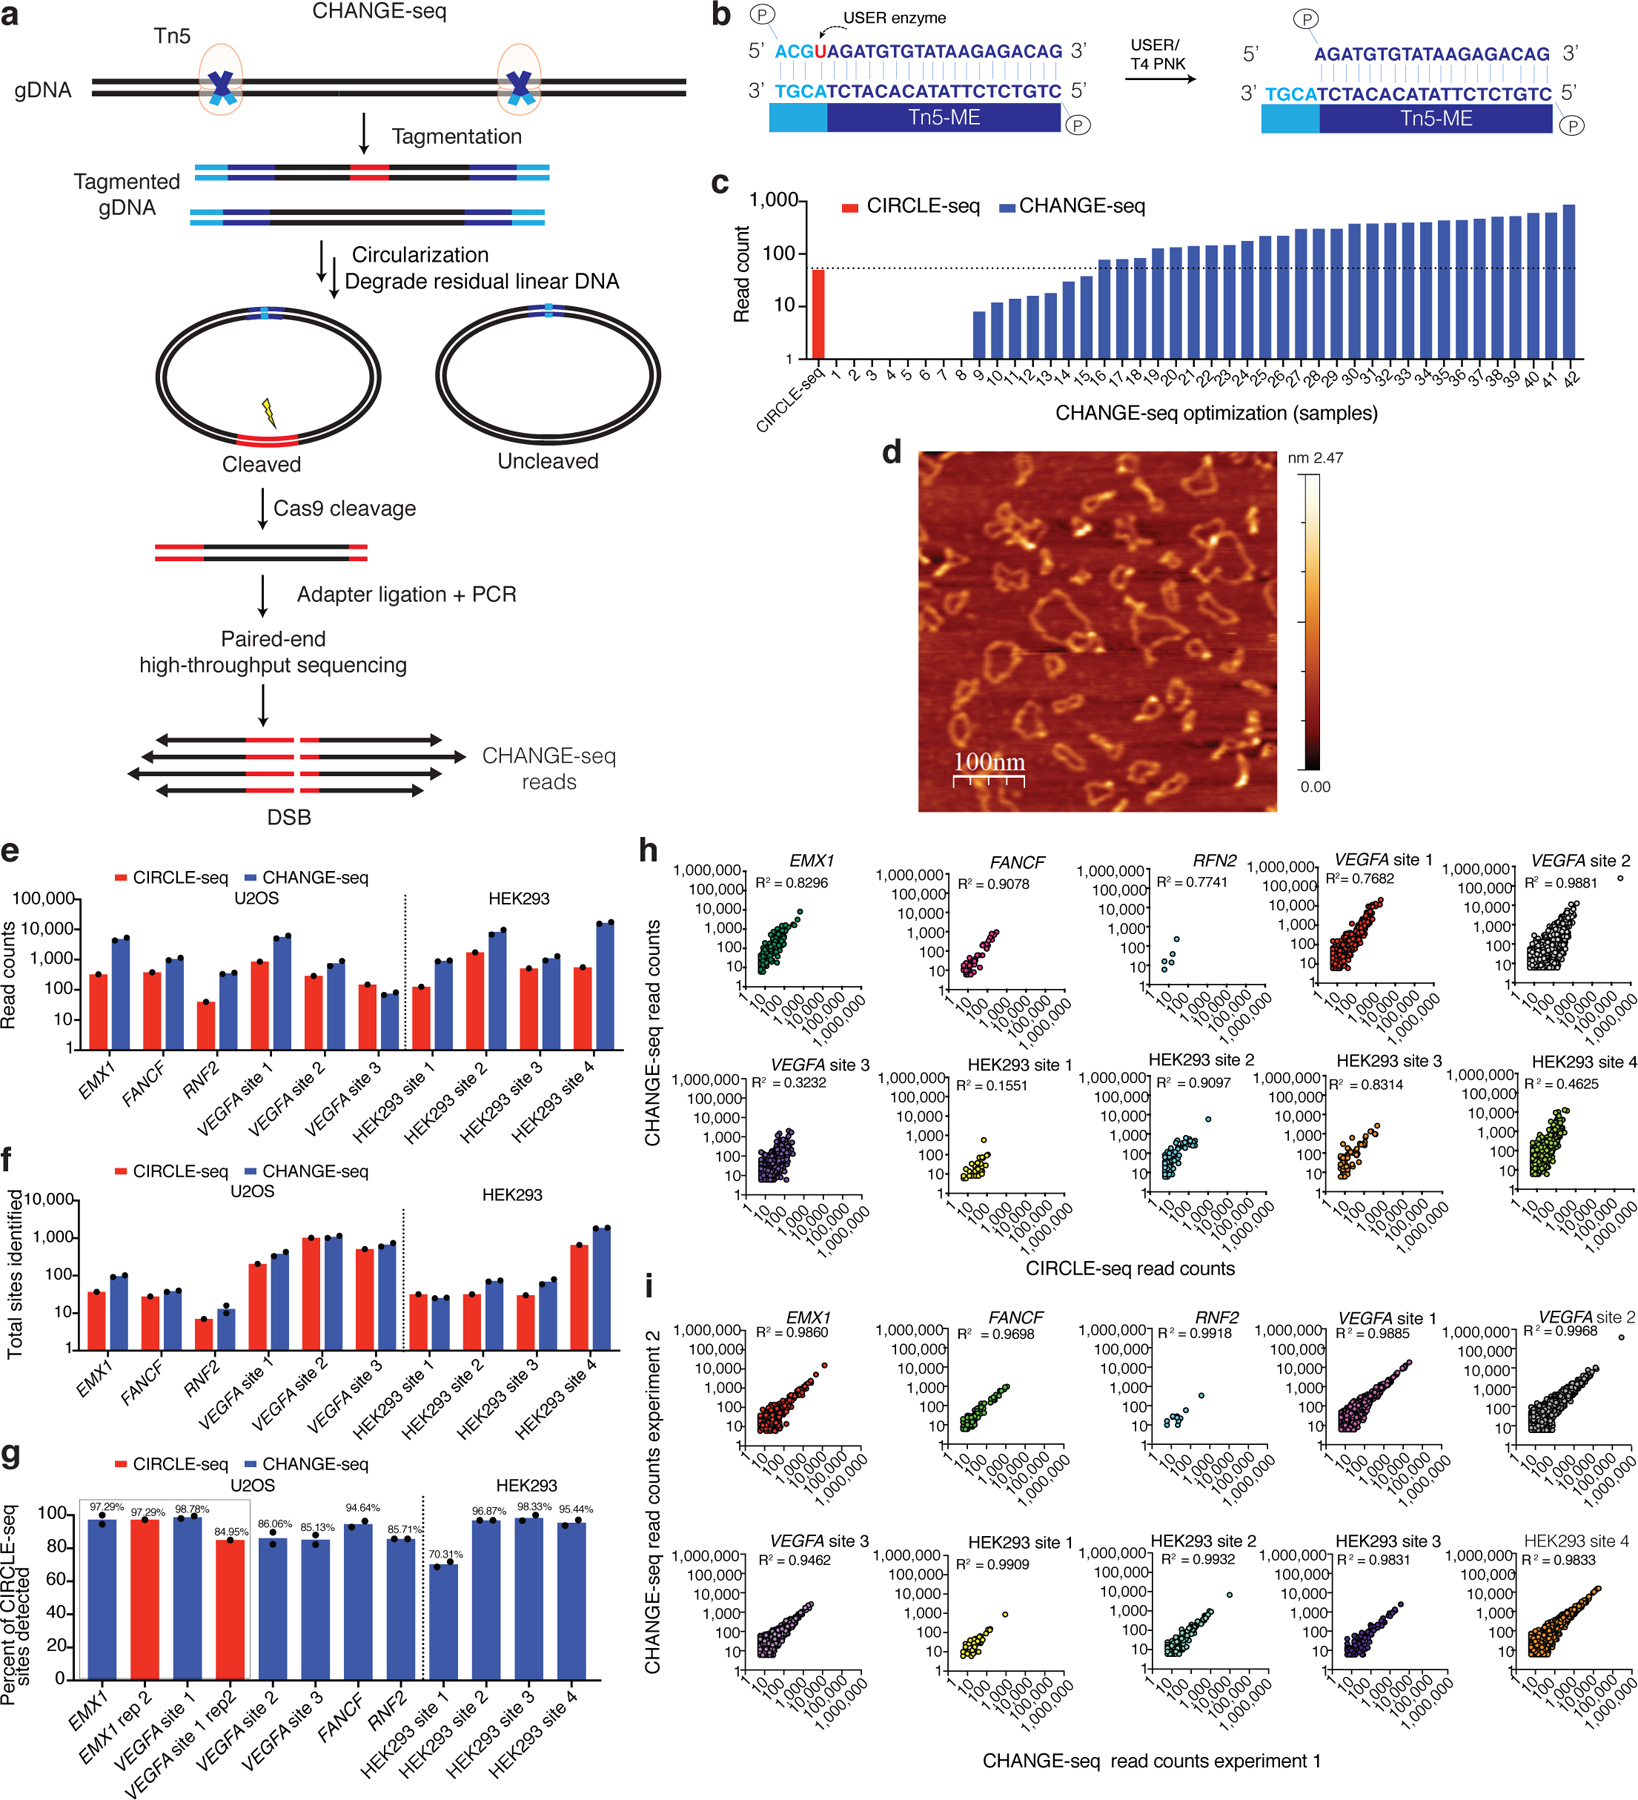
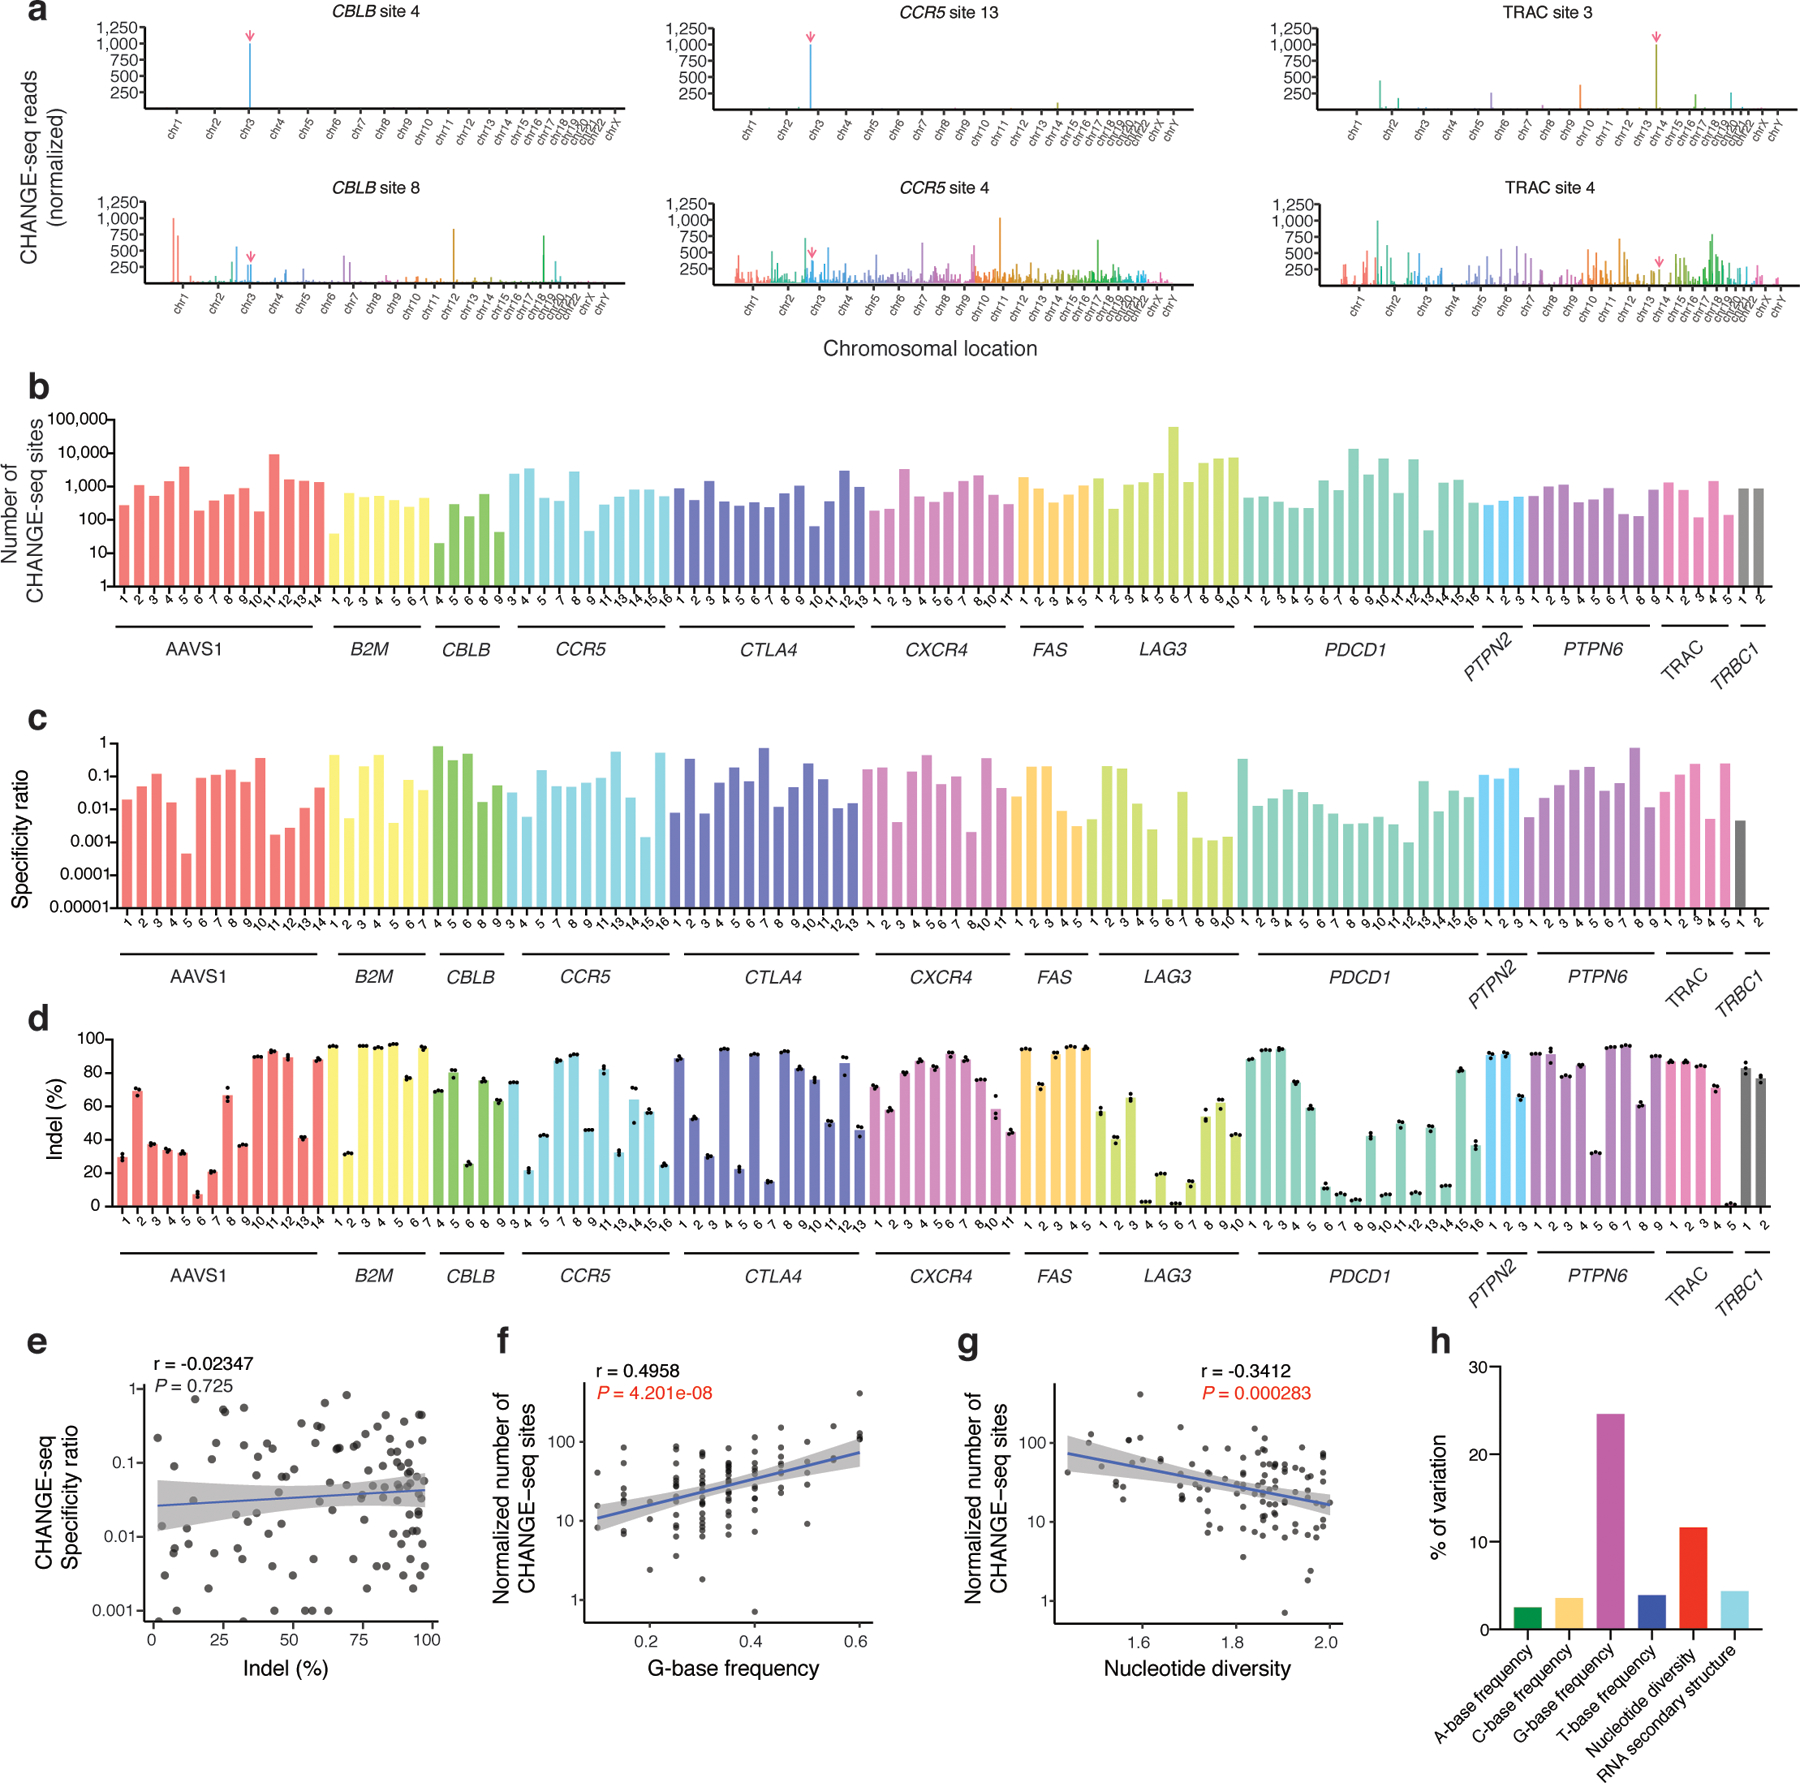
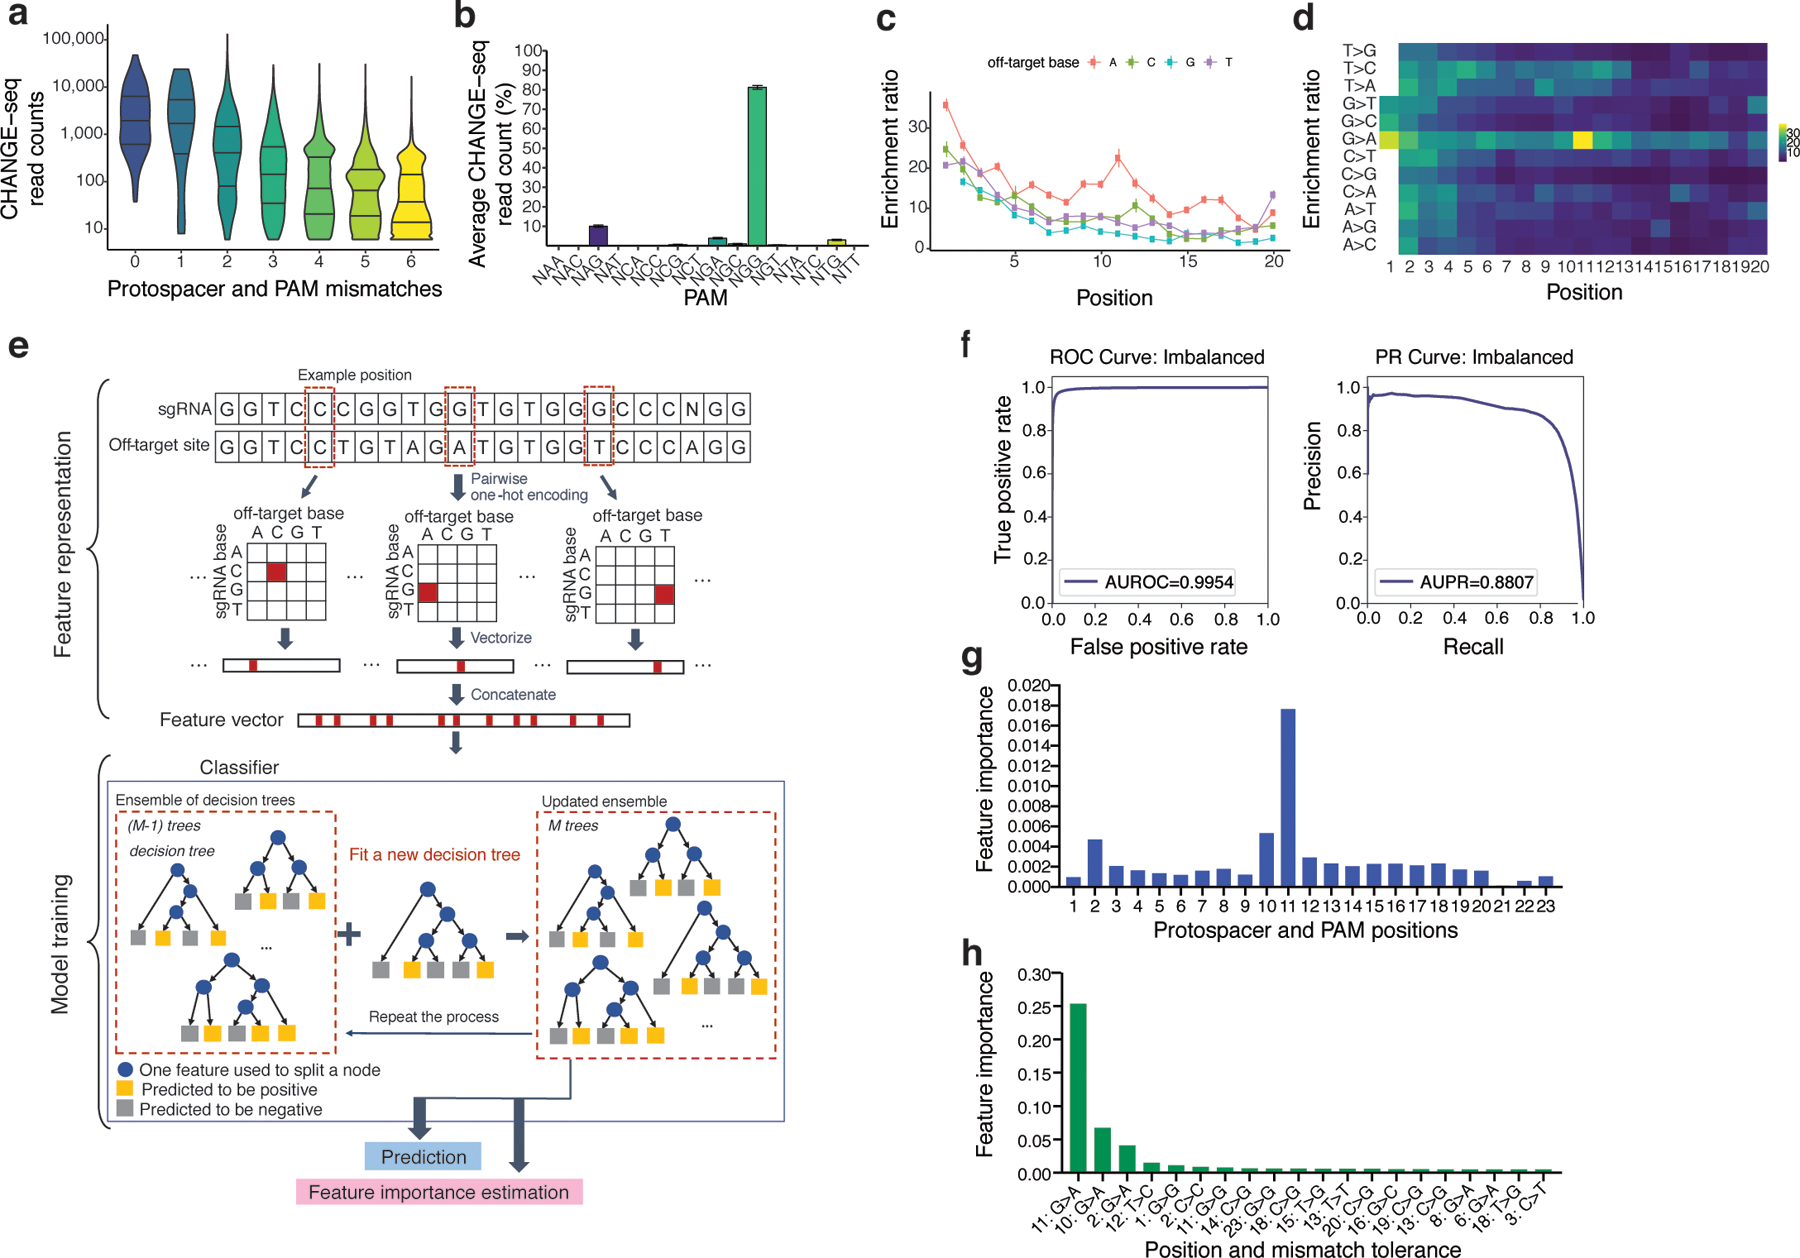
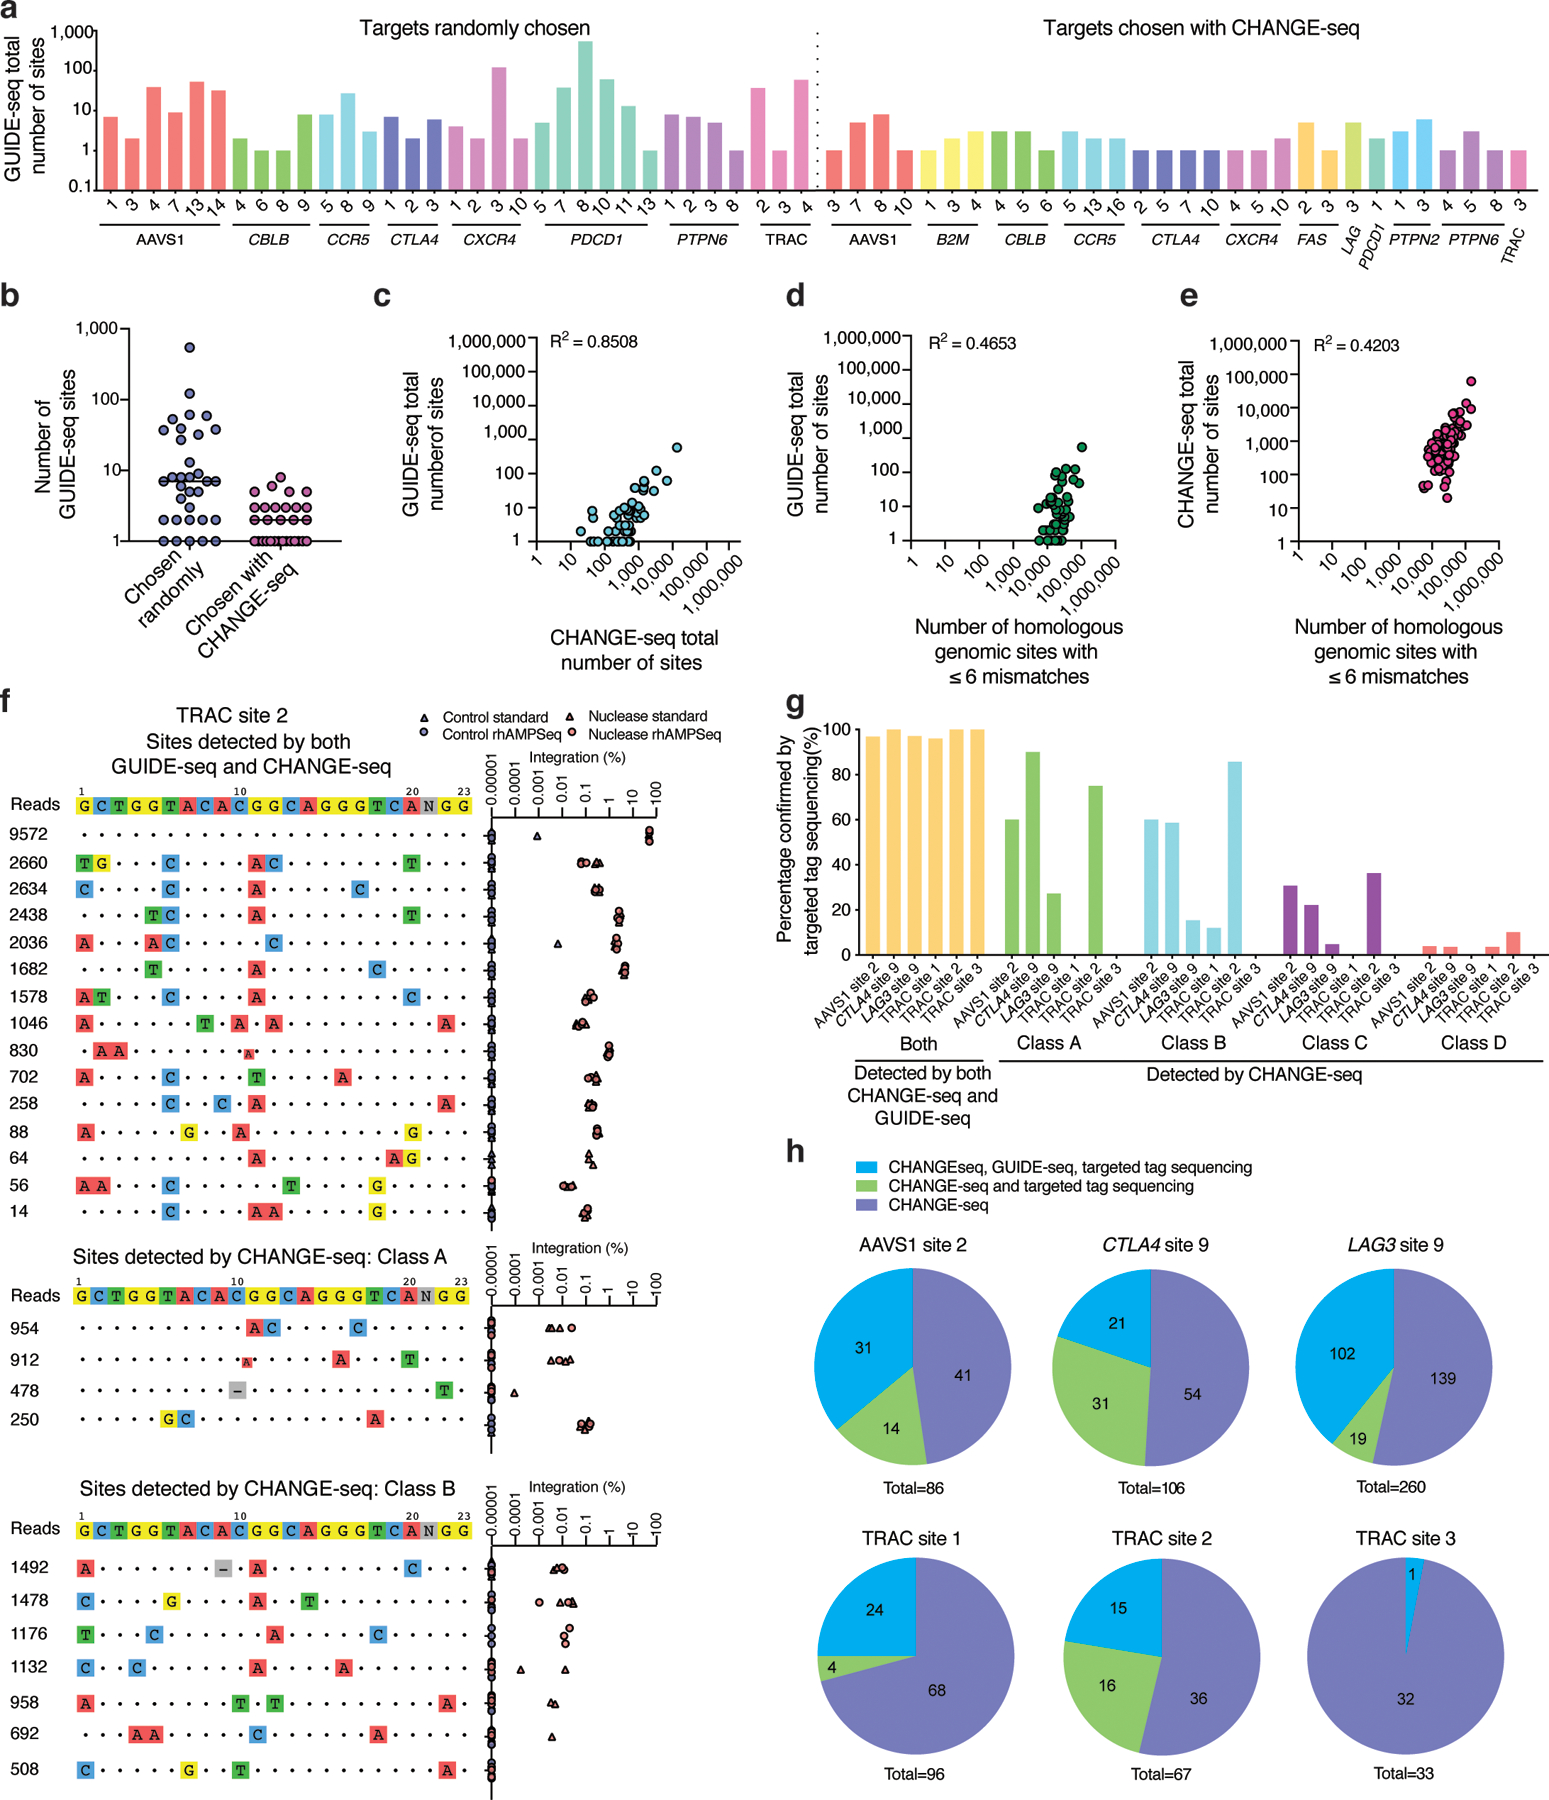
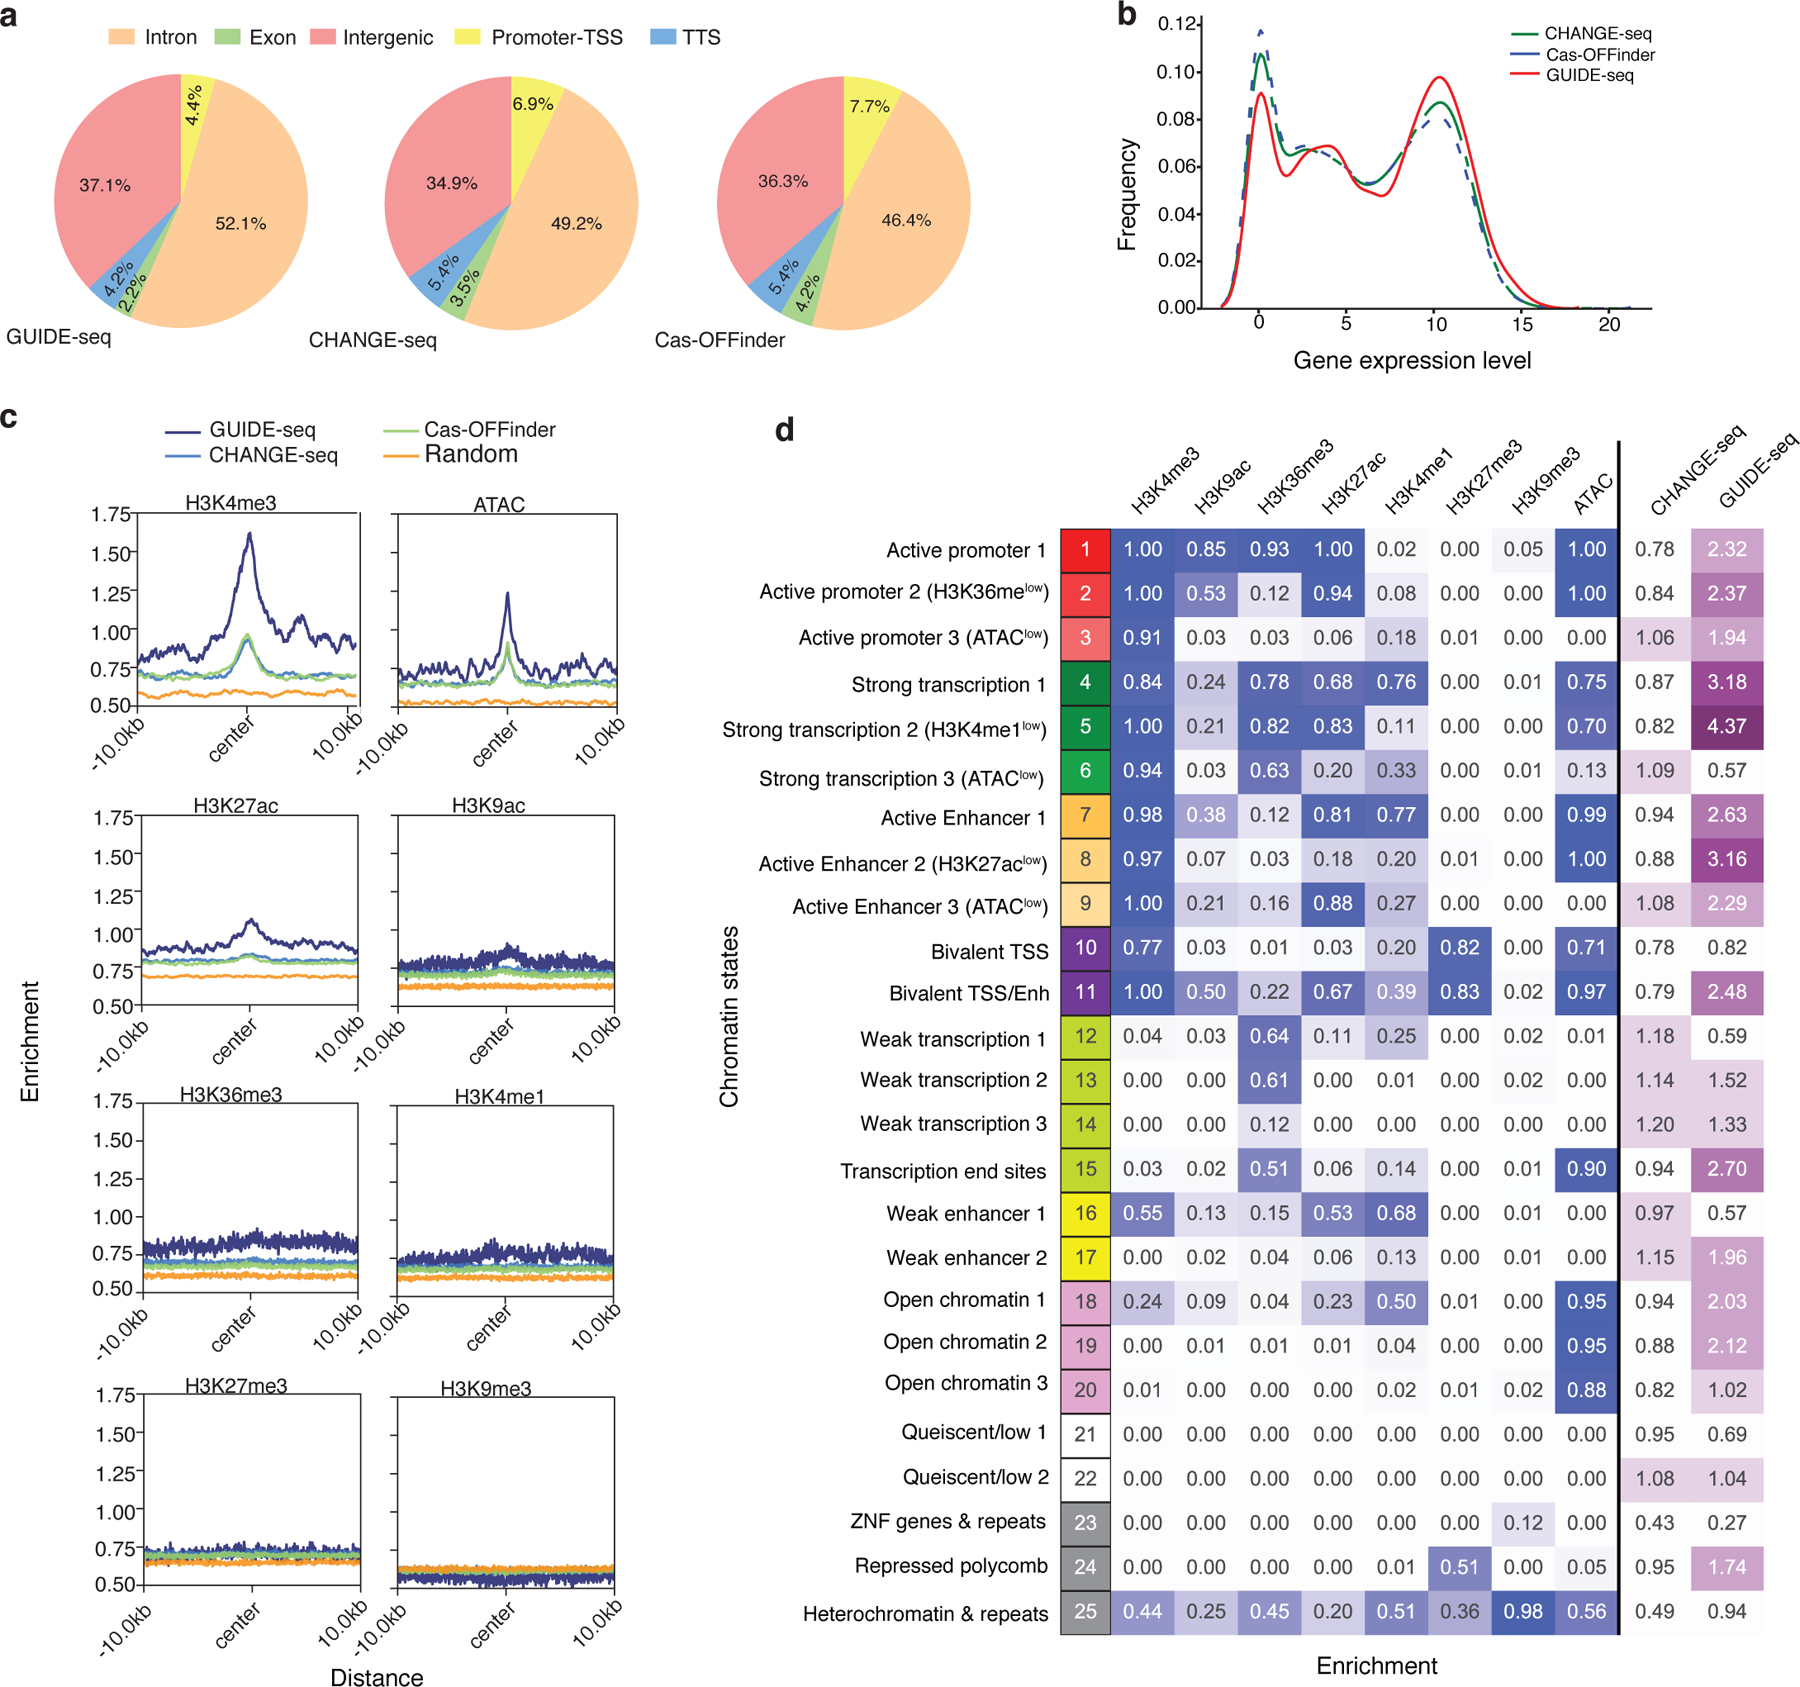
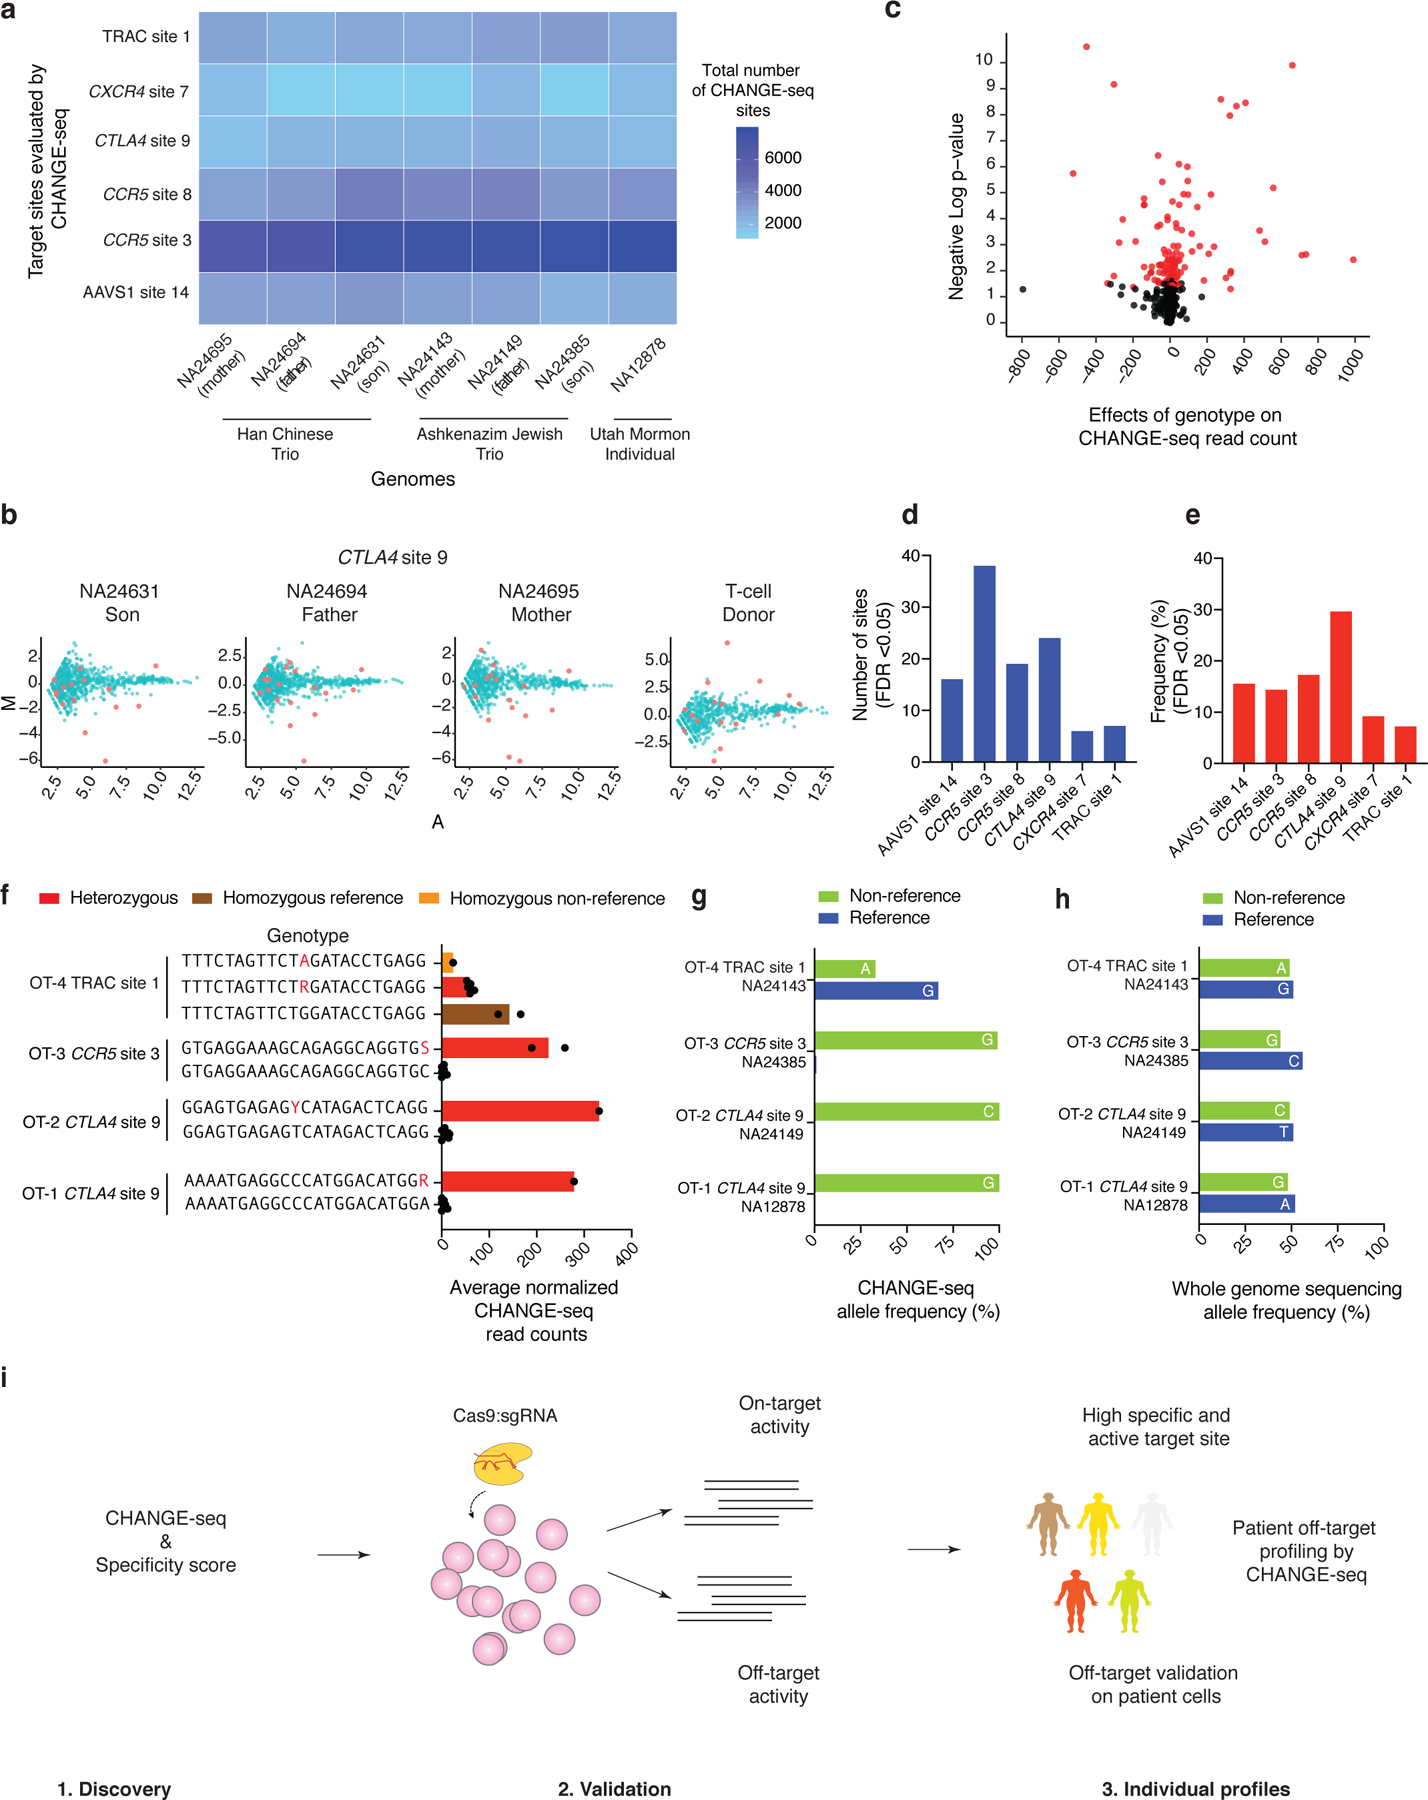
Current methods can illuminate the genome-wide activity of CRISPR-Cas9 nucleases, but are not easily scalable to the throughput needed to fully understand the principles that govern Cas9 specificity. Here we describe 'circularization for high-throughput analysis of nuclease genome-wide effects by sequencing' (CHANGE-seq), a scalable, automatable tagmentation-based method for measuring the genome-wide activity of Cas9 in vitro. We applied CHANGE-seq to 110 single guide RNA targets across 13 therapeutically relevant loci in human primary T cells and identified 201,934 off-target sites, enabling the training of a machine learning model to predict off-target activity. Comparing matched genome-wide off-target, chromatin modification and accessibility, and transcriptional data, we found that cellular off-target activity was two to four times more likely to occur near active promoters, enhancers and transcribed regions. Finally, CHANGE-seq analysis of six targets across eight individual genomes revealed that human single-nucleotide variation had significant effects on activity at ~15.2% of off-target sites analyzed. CHANGE-seq is a simplified, sensitive and scalable approach to understanding the specificity of genome editors.


Conflict of interest statement

Competing Interests Statement

C.R.L. and S.Q.T. have filed a patent application on CHANGE-seq. S.Q.T. is a co-inventor on patents covering CIRCLE-seq and GUIDE-seq. S.Q.T. is a member of the scientific advisory board of Kromatid.

Figures

Extended Data Fig. 1
Extended Data Fig. 1. Detailed overview of CHANGE-seq method.
Genomic DNA is randomly tagmented to an average of ~400 bp with a custom Tn5-transposome with an uracil-containing adapter. 9-nt Tn5-generated gaps in the DNA are filled in with a high-fidelity uracil-tolerant U+ polymerase and sealed with Taq DNA ligase. 4 bp overhangs are released with a mixture of USER enzyme and T4 PNK. DNA molecules are circularized at low concentrations that favor intramolecular ligation. Unwanted linear DNA is degraded with an exonuclease cocktail (comprised of Exonuclease I, Lambda exonuclease and Plasmid-Safe ATP-dependent DNase). Purified circular DNA is treated with Cas9:sgRNA RNP and cleaved DNA ends at on- and off-target sites are released for NGS library preparation, PCR amplification, and pair-end high-throughput sequencing.
Extended Data Fig. 2
Extended Data Fig. 2. Schematic comparison of CIRCLE-seq and CHANGE-seq workflows.
CHANGE-seq eliminates the requirement for specialized equipment for physical DNA shearing along with 9 additional enzymatic or purification steps. The simplified workflow substantially streamlines the process, decreases the requirement of input genomic DNA for circularization by approximately 5-fold and reduces the number of reactions to process each sample by 10- to 20-fold to a single reaction per sample.
Extended Data Fig. 3
Extended Data Fig. 3. CHANGE-seq detects all or nearly all sites detected by GUIDE-seq.
Venn diagrams showing the number of overlapping off-target sites captured by CHANGE-seq (blue) and GUIDE-seq (clear). The top six comparisons are of standard targets; the bottom four comparisons are of repetitive targets commonly used to benchmark genome-wide off-target activity detection methods.
Extended Data Fig. 4
Extended Data Fig. 4. GUIDE-seq optimization for human primary CD4+/CD8+T-cells.
a, Viability of cell population assessed by FACS analysis with DAPI staining 3 days post nucleofection with dsODN with phosphorothioate modifications at 5’ end, 3’ end, both ends or without dsODN (n=3). b, Indel rates at the intended target sites 3 days post nucleofection with dsODN with phosphorothioate modifications modifications at 5’ end, 3’ end, both ends or without dsODN (n=3). c, Integration rates of dsODNs with phosphorothioate modifications at 5’ end, 3’ end, both ends or without dsODN (n=3). d, Viability of cell population assessed by FACS analysis with DAPI staining 3 days post nucleofection with different doses of dsODN with 3’ end modifications (n=3). e, Indels rates at the intended target sites 3 days post nucleofection with different doses of dsODN with 3’ end modifications (n=3). f, dsODN integration rates 3 days post nucleofection with different doses of dsODN with 3’ end modifications (n=3). g, Scatterplots of GUIDE-seq read counts (log scale) between two independently prepared GUIDE-seq libraries for 3 target sites, showing GUIDE-seq technical reproducibility. Correlation between two samples was calculated using Pearson’s correlation coefficient.
Extended Data Fig. 5
Extended Data Fig. 5. Detailed characterization of a specific and active sgRNA targeting the TRAC region.
a, Manhattan plot showing the genome-wide distribution of sites identified in vitro by CHANGE-seq (arrow indicates the on-target site). b, Visualization of sites detected by CHANGE-seq. The intended target sequence is shown in the top line. Cleaved sites (on- and off-target) are shown underneath and are ordered top to bottom by CHANGE-seq read count, with mismatches to the intended target sequence indicated by colored nucleotides. Note that output is truncated to top sites with a full listing in Supplementary Table 4. c, Manhattan plot showing the on-target site detected for TRAC site 3 by GUIDE-seq, with no off-target sites being identified (arrow indicates the on-target site). d, Visualization of sites detected by GUIDE-seq. e, Indels rates at the intended target site 3 days post nucleofection (n=3). f, Flow plot showing distribution of TCR αβ expression in control (red) versus cells edited with sgRNA targeting TRAC site 3 (light blue). These experiments were performed three times with similar results. g, Barplot showing the percentage of TCR disruption 14 days after nucleofection with sgRNA:Cas9 complex measured by flow cytometry analysis (n=3).
Extended Data Fig. 6
Extended Data Fig. 6. GUIDE-seq dsODN tag independent indel frequencies are strongly correlated with tag integration frequencies.
Comparison of standard targeted sequencing and rhAMPSeq, a multiplex targeted sequencing method used in our study to validate on- and off-target site mutations. Scatterplots of indel mutation frequencies (top) and tag integration frequencies (bottom), between standard amplicon sequencing and rhAMPSeq, for sgRNAs targeted against CTLA4 site 9 and TRAC site 2 (See Methods). b, Scatterplots showing correlation between indel frequencies (in cells edited with Cas9 RNPs and no dsODN tag) and tag integration frequencies (in cells edited with Cas9 RNP and dsODN tag) at on- and off-target sites measured by targeted amplicon sequencing. (a-b) Correlation between two samples was calculated using Pearson’s correlation coefficient.
Extended Data Fig. 7
Extended Data Fig. 7. Targeted tag sequencing validation of CHANGE-seq detected off-target sites.
Targeted tag integration frequencies evaluated by standard targeted sequencing (triangle shape) and or rhAMPSeq (circle shape) (See Methods) at on- and off-target sites detected by both GUIDE-seq and CHANGE-seq, or detected by CHANGE-seq only (classes A-D), for sgRNAs targeted to TRAC site 2 and CTLA4 site 9. Panels for sites identified by both GUIDE-seq and CHANGE-seq and classes A and B for TRAC site 2 duplicated from main Fig. 4f for completeness.
Extended Data Fig. 8
Extended Data Fig. 8. GUIDE-seq read counts are strongly correlated with indel and tag integration frequencies in human primary T-cells.
a, Scatterplots showing correlation between indel frequencies and GUIDE-seq read counts at on- and off-target sites, and b, tag integration and GUIDE-seq read counts at on- and off-target sites. (a-b) Correlation between two samples was calculated using Pearson’s correlation coefficient.
Extended Data Fig. 9
Extended Data Fig. 9. Influence of chromatin state on CRISPR-Cas9 genome-wide off-target activity.
a, Barplots showing the enrichment of individual epigenetic feature in GUIDE-seq (n=1,196), CHANGE-seq (n=11,000) and Cas-OFFinder (n=11,000). Statistical significance was calculated using two-tailed Welch’s t-test. Error bars indicate 95% confidence interval, estimated from 1000 bootstrap samples. b, Heatmap showing fold enrichment for various genomic annotations computed by ChromHMM for validation of chromatin state annotations. Darker colors represent higher fold enrichment.
Extended Data Fig. 10
Extended Data Fig. 10. CHANGE-seq enables detection of effects of individual genetic variation on genome-wide activity of genome editors.
a, Scatterplots of CHANGE-seq read counts (log scale) between two CHANGE-seq libraries independently prepared from the same source of genomic DNA, evaluating 6 target sites in 7 different genomes, showing that CHANGE-seq is highly reproducible. Correlation between two samples was calculated using Pearson’s correlation coefficient. b, Pairwise M/A plots for visualizing read count differences. The ratio (M) versus the average (A) of CHANGE-seq read counts (log scale) performed on the indicated GIAB or human T-cell sample versus a GM12878 GIAB reference sample. Each point represents an off-target site, and off-target sites that contain a non-reference single-nucleotide variant (SNV) are labelled in red.
Fig. 1 |
Fig. 1 |. Development and optimization of CHANGE-seq.
a, Schematic overview of CHANGE-seq workflow. Genomic DNA is tagmented using a custom Tn5-transposome, circularized by low-concentration intramolecular ligation and residual linear DNA molecules are degraded by treatment with a mixture of exonucleases. Upon treatment with Cas9, circularized DNA molecules containing Cas9 on- and off-target sites are subsequently linearized, releasing newly cleaved DNA ends for adapter ligation, PCR amplification and paired-end high-throughput sequencing. b, The custom Tn5 transposon sequence for circularization is comprised of 19 -base pairs required for transposition (Tn5-ME) and 4 palindromic -base pairs containing a uracil for subsequent overhang generation. c, Plot of on-target read count enrichment during development of CHANGE-seq protocol (blue) compared to CIRCLE-seq (red), for benchmark sgRNA targeting EMX1. All libraries sampled to the same sequence depth for comparisons. Optimization sample descriptions listed in Supplementary Table 1. d, Direct visualization of genomic DNA circles produced by CHANGE-seq by atomic force microscopy (scale in nm). Signal intensity indicates the relative height of the AFM probe passing over DNA molecules on the slide surface. This experiment was repeated two times with similar results. e, Barplot of on-target site read count enrichment for 10 target sites evaluated by CIRCLE-seq (red, n=1) and CHANGE-seq (blue, n=2). CHANGE-seq enrichment ranged from 2- to 30-fold compared to CIRCLE-seq. f, Barplot showing number of sites detected by CHANGE-seq (n=2) was comparable or higher than CIRCLE-seq (n=1) for most of the targets. g, Barplot showing proportion of CIRCLE-seq (n=1) sites identified by CHANGE-seq (n=2). The bars highlighted in red indicate two target sites with available published CIRCLE-seq technical replicates, where the percent of CIRCLE-seq sites detected by CHANGE-seq was greater than or equal to that of CIRCLE-seq technical replicates. Read count detection threshold set at 18 for all samples to minimize sampling artifacts. h, Scatterplots of CIRCLE-seq and CHANGE-seq read counts (log scale) from experiments performed on the same cellular source of genomic DNA. i, Scatterplots of CHANGE-seq read counts (log scale) between two CHANGE-seq libraries independently prepared from the same source of genomic DNA for 10 target sites, showing that CHANGE-seq is highly reproducible. (h-i) Correlation between two samples was calculated using Pearson’s correlation coefficient.
Fig. 2 |
Fig. 2 |. High-throughput CHANGE-seq profiling of 110 therapeutic target sites reveals target site factors that affect Cas9 genome-wide specificity.
a, Manhattan plots of CHANGE-seq detected on- and off-target sites organized by chromosomal position with bar heights representing normalized CHANGE-seq read count. The on-target site is indicated with a red arrow. Examples of target sites with specific (top) and promiscuous (bottom) activity shown for the same locus. b, Barplot of number of CHANGE-seq sites detected for 110 sgRNAs designed toward nonrepetitive target sites across 13 loci in human primary CD4+/CD8+ T-cells (log scale) (n=1). c, Barplot of specificity ratio showing relative specificity of sites (log scale). d, Barplot of indel mutation frequencies for 110 intended target sites measured 3 days post nucleofection with Cas9:sgRNA RNPs (n=3). e, Scatterplot showing correlation of indel frequency at the intended target sites with CHANGE-seq specificity ratio. f, Scatterplot showing correlation of G-base frequency with normalized number of CHANGE-seq detected sites (adjusted by number of homologous genomic sites) (log scale). g, Scatterplot showing correlation of nucleotide diversity with normalized number of CHANGE-seq detected sites (adjusted by number of homologous sites) (log scale). (e-g). Correlation between two samples was calculated using Pearson’s correlation coefficient and two-tailed P value. h, Variance in number of sites detected by CHANGE-seq explained by target site A-frequency, C-frequency, G-frequency, T-frequency, nucleotide diversity and RNA-secondary structure.
Fig. 3 |
Fig. 3 |. Machine learning from large-scale CHANGE-seq datasets illuminates important predictors of off-target site activity.
a, Violin plots showing the distribution of CHANGE-seq reads by protospacer and PAM mismatch count, with horizontal lines marking quartiles. Increasing number of mismatches relative to the on-target site decreased Cas9 in vitro cleavage activity. These data represent n=202,043 on- and off-target sites. b, Barplot of average CHANGE-seq read count percentage at off-target sites categorized by PAM sequence (n=110). Error bars represent standard error of the mean. c, Effects of protospacer mismatches on CHANGE-seq enrichment ratio categorized by non-target strand off-target base (n=201,934 off-target sites). Adenine base substitutions on the non-target strand are best tolerated. d, Effects of protospacer mismatches categorized by combination of intended and off-target base on CHANGE-seq enrichment ratio. G>A substitutions on the non-target strand are most tolerated. e, Overview of the machine learning framework used to predict off-target activity. Sequence information corresponding to each target and off-target site pair are encoded in a 1-dimensional vector format conducive to machine learning. For model training, a Gradient Tree Boosting (GTB) model is used. GTB works by iteratively updating an ensemble of decision trees, where each is a weak classifier. In addition, the model also estimates feature importance by evaluating the contribution of each feature to the prediction performance on the training samples. f, Receiver operator characteristic (ROC) curve and Precision-Recall (PR) curve of the prediction performance of a machine learning model based on the testing data (n=3,374,457). g, Top 20 important position-wise features estimated by the machine learning model. Each feature is denoted as nucleotide position in the off-target site. h, Mean feature importance in each position of the paired sequences. For each position, we calculate the average feature importance of all the 4 × 4 nucleotide pairs in the corresponding position between the sgRNA sequence and the off-target site as the mean feature importance of this position.
Fig. 4 |
Fig. 4 |. CHANGE-seq genome-wide activity profiles sensitively predict cellular specificity.
a, Barplot showing number of sites detected by GUIDE-seq for both sets of targets (chosen randomly or on the basis of CHANGE-seq), totaling 54 target sites (n=1). b, Dotplot of number of GUIDE-seq sites detected for targets chosen randomly (n=33) and targets chosen based on CHANGE-seq data (n=30), the centered line indicates the median. 9 sites are overlapping between sets. c, Scatterplot showing correlation in number of sites detected by GUIDE-seq versus CHANGE-seq. d, Scatterplots showing correlation in number of sites detected by GUIDE-seq and homologous genomic sites identified in silico (using Cas-OFFinder). e, Scatterplots showing correlation in number of sites detected by CHANGE-seq and number of homologous genomic sites. (c-e) Correlation between two samples was calculated using Pearson’s correlation coefficient. f, Targeted tag integration frequencies evaluated by standard targeted sequencing (triangle shape) and rhAMPSeq (circle shape) at off-target sites detected by both GUIDE-seq and CHANGE-seq (upper panel), and off-target sites detected by CHANGE-seq but not GUIDE-seq (middle and lower panel) for sgRNA targeted to TRAC site 2. g, Barplot showing the percentage of off-target sites confirmed by targeted tag sequencing at sites detected by CHANGE-seq and GUIDE-seq, and Class A, Class B, Class C, or Class D sites detected by CHANGE-seq and not GUIDE-seq. h, Pie charts showing fractions of CHANGE-seq sites evaluated by amplicon sequencing that are also detected by GUIDE-seq and targeted tag sequencing.
Fig. 5 |
Fig. 5 |. Cas9 off-target activity is enriched in active chromatin states.
a, Pie charts showing fraction of cleavage sites identified by GUIDE-seq (left), CHANGE-seq (middle) and Cas-OFFinder (right) categorized according to their genomic features. TSS: Transcription Start Site. TTS: Transcription Termination Site. b, Kernel density plot showing the distribution of gene expression for CHANGE-seq, Cas-OFFinder, and GUIDE-seq. c, Average of histone modification ChIP-seq and ATAC-seq signal at off-target sites and flanking regions (± 10 kb). d, Heatmap showing emission probabilities (blue) of the 25-state ChromHMM model and fold enrichment of CHANGE-seq (n=11,000) and GUIDE-seq (n=1,196) sites relative to homologous genomic sites (n=11,000) with 6 or less mismatches (purple). Darker colors indicate greater emission probability or enrichment. Chromatin state annotations are shown on the left.
Fig. 6 |
Fig. 6 |. CHANGE-seq detects impact of individual human genetic variation on Cas9 genome-wide activity.
a, Heat-map showing the experimental design and total number of sites identified by high-throughput CHANGE-seq for six target sites across seven well-characterized genomes. b, MA plot of CHANGE-seq data from individuals characterized by the “Genome-in-a-bottle” project and the T-Cell donor. NA24631, NA24694 and NA24695 (Han Chinese Trio) and the T-cell donor are directly compared to NA12878. Off-target sites containing SNVs are highlighted in red. c, Volcano plot showing the off-target sites harboring SNVs. The red dots represent off-target sites with significant effects of SNVs (FDR<0.05) (n=720). For each site, we fit a simple linear regression model of normalized read count by genotype, calculated an F-statistic and p-values, and used the Benjamini-Hochberg procedure to control the false discovery rate due to multiple testing. d, Number of off-target sequences harboring SNVs with significant effect on Cas9 activity (FDR<0.05) measured by CHANGE-seq (n=110). e, Frequency of off-target sequences harboring SNVs with significant effect on Cas9 activity (FDR<0.05) measured by CHANGE-seq (n=110). f, Barplot showing off-target sites (reference and alternative sequences from the heterozygous genomes) with significant effects (FDR<0.05) from genetic variation on Cas9 activity as measured by CHANGE-seq read counts (n=8). SNVs are highlighted in red in the alternative sequence. g, Barplot showing the allele frequency as determined by CHANGE-seq for the reference and alternative sequences for the respective heterozygous genome, as an indication of the influence of SNVs present on off-targets on Cas9 activity. The reference nucleotide and the respective SNV in the non-reference sequence are highlighted in each bar. h, Barplot showing the whole genome sequencing allele frequency for the reference and alternative sequences for the respective heterozygous genome. The reference nucleotide and the respective SNV in the non-reference sequence are highlighted in each bar. i, Schematic illustrating the three phases of Cas9 genome-wide activity profiling leveraging CHANGE-seq for therapeutic applications. In phase 1, the designed sgRNAs are profiled by CHANGE-seq and scored according to their specificity ratio. In phase 2, high specific sgRNAs are tested for their activity at on and off-target sites in cells. Finally, in phase 3, sgRNAs with high specificity and high activity at on-target site are profiled by CHANGE-seq using patient gDNA, followed by off-target validation on patient cells.

References

    1. Jinek M et al. A Programmable dual-RNA–guided DNA endonuclease in adaptive bacterial immunity. Science 337, 816–821 (2012). - PMC - PubMed
    1. Mali P et al. RNA-guided human genome engineering via Cas9. Science 339, 823–826 (2013). - PMC - PubMed
    1. Cong L et al. Multiplex genome engineering using CRISPR/Cas systems. Science 339, 819–823 (2013). - PMC - PubMed
    1. Eyquem J et al. Targeting a CAR to the TRAC locus with CRISPR/Cas9 enhances tumour rejection. Nature 543, 113 (2017). - PMC - PubMed
    1. Hacein-Bey-Abina S et al. LMO2-associated clonal T cell proliferation in two patients after gene therapy for SCID-X1. Science 302, 415–419 (2003). - PubMed

Publication types