. 2021 Jul;17(7):1714-1728.
doi: 10.1080/15548627.2020.1782035. Epub 2020 Jun 30.

PKD2/polycystin-2 induces autophagy by forming a complex with BECN1

Affiliations

PKD2/polycystin-2 induces autophagy by forming a complex with BECN1

Daniel Peña-Oyarzun et al. Autophagy. 2021 Jul.

Abstract

Macroautophagy/autophagy is an intracellular process involved in the breakdown of macromolecules and organelles. Recent studies have shown that PKD2/PC2/TRPP2 (polycystin 2, transient receptor potential cation channel), a nonselective cation channel permeable to Ca2+ that belongs to the family of transient receptor potential channels, is required for autophagy in multiple cell types by a mechanism that remains unclear. Here, we report that PKD2 forms a protein complex with BECN1 (beclin 1), a key protein required for the formation of autophagic vacuoles, by acting as a scaffold that interacts with several co-modulators via its coiled-coil domain (CCD). Our data identified a physical and functional interaction between PKD2 and BECN1, which depends on one out of two CCD domains (CC1), located in the carboxy-terminal tail of PKD2. In addition, depletion of intracellular Ca2+ with BAPTA-AM not only blunted starvation-induced autophagy but also disrupted the PKD2-BECN1 complex. Consistently, PKD2 overexpression triggered autophagy by increasing its interaction with BECN1, while overexpression of PKD2D509V, a Ca2+ channel activity-deficient mutant, did not induce autophagy and manifested diminished interaction with BECN1. Our findings show that the PKD2-BECN1 complex is required for the induction of autophagy, and its formation depends on the presence of the CC1 domain of PKD2 and on intracellular Ca2+ mobilization by PKD2. These results provide new insights regarding the molecular mechanisms by which PKD2 controls autophagy.Abbreviations: ADPKD: autosomal dominant polycystic kidney disease; ATG: autophagy-related; ATG14/ATG14L: autophagy related 14; Baf A1: bafilomycin A1; BCL2/Bcl-2: BCL2 apoptosis regulator; BCL2L1/BCL-XL: BCL2 like 1; BECN1: beclin 1; CCD: coiled-coil domain; EBSS: Earle's balanced salt solution; ER: endoplasmic reticulum; GAPDH: glyceraldehyde-3-phosphate dehydrogenase; GFP: green fluorescent protein; GOLGA2/GM130: golgin A2; GST: glutathione s-transferase; LAMP1: lysosomal associated membrane protein 1; MAP1LC3/LC3: microtubule associated protein 1 light chain 3; MTORC1: mechanistic target of rapamycin kinase complex 1; NBR1: NBR1 autophagy cargo receptor; PIK3C3/VPS34: phosphatidylinositol 3-kinase catalytic subunit type 3; PKD2/PC2: polycystin 2, transient receptor potential cation channel; RTN4/NOGO: reticulon 4; RUBCN/RUBICON: rubicon autophagy regulator; SQSTM1/p62: sequestosome 1; UVRAG: UV radiation resistance associated; WIPI2: WD repeat domain, phosphoinositide interacting 2.

Keywords: Autophagy; beclin 1; calcium; polycystin-2; protein complex.


Conflict of interest statement

No potential conflict of interest was reported by the authors

Figures

Figure 1.
Figure 1.
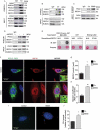
PKD2 is required for basal and induced autophagy. Role of PKD2 in basal autophagy (A-D). HeLa cells were transfected with a control siRNA (siUNR) or with two different siRNAs sequences targeting PKD2 (siPKD2#1 and siPKD2#2) for 24 h in presence or absence of 30 nM Baf A1. Protein extracts were prepared, resolved by SDS-PAGE and PKD2 and LC3 detected by western blot. GAPDH levels were used as loading controls. Representative gels are shown in (A) and quantified in the graphic in (B) (mean ± SEM, n = 3, ***p < 0.001 vs. siUNR; &&&p < 0.001 vs. siUNR + Baf A1). (C) HeLa cells were transfected with siPKD2#2 for 24 h and SQSTM1 levels evaluated by western blot. Representative gels are shown in (C) and relative levels of SQSTM1 normalized by the loading control GAPDH (D) (mean ± SEM, n = 3, *p < 0.05 vs. siUNR). Role of PKD2 in starvation- and rapamycin-induced autophagy (E-I). HeLa cells were transfected with a control siRNA (siUNR) or with siRNAs targeting for PKD2 (siPKD2) for 24 h. Then, cells were starved with EBSS or treated with 1 μM rapamycin for 2 h and endogenous LC3 puncta were identified by immunofluorescence. Representative pictures are shown in (E) and quantification of the percentage of autophagic cells is shown in (F). Nuclei were dyed with 10 μg/mL Hoechst 33342 (mean ± SEM, n = 3, **p < 0.01, ***p < 0.001 vs. Co; &&p < 0.01 vs. Co + Rapa/EBSS). HeLa cells were transfected as in (E) and starved with EBSS for 2 h. Protein extracts were resolved by SDS-PAGE and LC3-I to LC3-II conversion, SQSTM1 and PKD2 evaluated by western blot. Representative gels are shown in (G) and immunoblot quantification of LC3-II and SQSTM1 are represented in (H) and (I), respectively (mean ± SEM, n = 3, **p < 0.01 vs. Co; +++p < 0.001 vs. EBSS). GAPDH levels were used as loading control. PKD2 overexpression is sufficient to induce autophagy (J-M). HeLa cells were transfected with GFP-WIPI2 and then PKD2 transduced with AdPKD2 for 24 h. WIPI2 dots formation was evaluated by microscopy and incubation with EBSS for 30 min was used as positive control. Representative pictures are shown in (J) and the percentage of WIPI2-positive cells is depicted in (K), (mean ± SEM, n = 3, **p < 0.01 ***p < 0.001 vs. Co). (L) PKD2 was overexpressed as in (J) in the presence or absence of 30 nM Baf A1 and LC3-I to LC3-II conversion and PKD2 evaluated by western blot. Representative gels are shown in (L) and immunoblot quantification of LC3-II is depicted in (M) (mean ± SEM, n = 4, ***p < 0.001 vs. AdCo; &&p < 0.01 vs. AdCo + Baf A1; +++p < 0.001 vs. AdPKD2)
Figure 2.
Figure 2.
PKD2 forms a protein complex with BECN1. Co-immunoprecipitation of endogenous BECN1 and PKD2 (A,B). Protein extracts were isolated from HeLa cells and BECN1 was immunoprecipitated with specific antibodies. Samples were resolved on SDS-PAGE and PKD2, RUBCN, PIK3C3, ATG14 and BECN1 were evaluated by western blot. IgG was used as control and representative gels are shown in (A) (n = 3). Co-immunoprecipitation with PKD2 antibodies and evaluation of PKD2, RUBCN and BECN1 by western blot using IgG as control (n = 3) (B). The formation of the PKD2-BECN1 complex depends on autophagy induction (C,D). HeLa cells were maintained in control medium, exposed to EBSS for 1 h (C) or infected with an adenovirus that overexpresses PKD2 (AdPKD2) for 24 h (D). Protein extracts were immunoprecipitated for BECN1 and samples resolved on SDS-PAGE to identify PKD2 (C), or PKD2 and RUBCN (D), by western blot. IgG was used as a control and representative gels are shown in (C) and (D) (n = 3). PKD2 interacts with the carboxy-terminal region of BECN1. The human recombinant proteins amino [1-265]- or carboxy [248-450]-terminal of BECN1 (500 ng) were immobilized on a nitrocellulose membrane and incubated with a supernatant containing the human recombinant carboxy-terminal [682–968] of PKD2 tagged to GST (GST-PKD2 C-term[682–968]). Incubation with recombinant GST or binding buffer was used as controls. Then, dot blot was performed using specific antibodies against GST. Red Ponceau staining of the membranes was used as loading control. Representative gels are shown in (E) (n = 3). Co-localization of PKD2 with BECN1. HeLa cells were transfected with a plasmid coding for full-length PKD2 (GFP-FL PKD2) and colocalization with endogenous BECN1 was evaluated by confocal microscopy. Nuclei were dyed with 10 mg/mL Hoechst 33342 and representative pictures are shown (F) (n = 3). Starvation-induced BECN1 puncta area is depicted in the graph in (G) and Mander’s colocalization is depicted in (H) (mean ± SEM, n = 3, *p < 0.05 **p < 0.01 vs. Co). Proximity Ligation Assay (PLA) between PKD2 and BECN1. HeLa cells were either maintained in control medium or stimulated with EBSS for 1 h. Close proximity (<40 nm) between PKD2 and BECN1 is detected as red dots and evaluated by fluorescence microscopy. Representative pictures are shown (I) (n = 3) and the number PLA puncta per cell is depicted in (J) (mean ± SEM, n = 3, *p < 0.05 vs. Co)
Figure 3.
Figure 3.
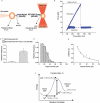
miniTweezers system for the characterization of rupture force, adhesion frequency and binding parameters between PKD2 C-term[682–968] and BECN1[248–450]. Scheme of the optical miniTweezers technique used to study the GST-PKD2 C-term[682-968]-6xHis-BECN1[248–450] interaction. Two different polystyrene beads were used: a GSH-coated bead (2.5 μm) containing purified GST-PKD2 C-term[682–968] or GST attached to a laser beam and held in the focus of the microscope and the anti-histidine bead (3.1 μm) containing the 6xHis-BECN1[248–450] protein, trapped on a micropipette by suction (A). Protein interaction was promoted by approaching the laser beam-trapped bead to the second bead. Then, after <1 s of contact, the beads were separated by pulling the laser beam-trapped bead at a constant force-loading rate (10 pN/s) until interaction rupturing. Force-trap position trace for one approach-retraction cycle obtained from miniTweezers measurements between GST-PKD2 C-term[682–968] or GST alone, with 6xHis-BECN1[248–450] (B). Adhesion frequency was evaluated using either GST-PKD2 C-term[682–968] or 6xHis-BECN1[248–450] (4 nM). At least 250 binding events per four pairs of new beads were measured. GST was used as control (C). Rupture force histograms between GST-PKD2 C-term[682-968]-6xHis-BECN1[248–450] and GST-6xHis-BECN1[248–450] (D). Force-dependent lifetime for the GST-PKD2 C-term[682-968]-6xHis-BECN1[248–450] interaction, estimated from each bin in (D) was analyzed using the Dudko-Hummer-Szabo model (E). Solid line corresponds to the fitted equation 2 [48] (υ = 0.5). Energy landscape of the dissociation process for GST-PKD2 C-term[682-968]-6xHis-BECN1[248–450] shows off-rate at zero force (koff0), distance to the transition state (Δx) and the free energy of activation (ΔG) (F)
Figure 4.
Figure 4.
The CC1 domain of PKD2 interacts with BECN1 and is necessary for autophagy induction. Schematic representation showing human GFP-tagged PKD2 constructs: full-length PKD2 (FL PKD2) and deletion of the first (CC1) and second (CC2) coiled-coil domain (PKD2ΔCC1 and PKD2ΔCC2, respectively). Transmembrane regions (TM) are indicated as TM1-6 (A). Co-immunoprecipitation of PKD2 constructs with BECN1. GFP-FL PKD2, GFP-PKD2ΔCC1 or GFP-PKD2ΔCC2 constructs were transfected in HeLa cells. 24 h later, the overexpressed forms of PKD2 were immunoprecipitated with specific antibodies for GFP and the precipitate was resolved by SDS-PAGE and revealed against BECN1. Total levels of GFP-tagged proteins and BECN1 were evaluated in the whole extracts. Representative gels are shown in (B) (n = 3). Induction of RFP-LC3 aggregation by PKD2 constructs (C,D). GFP-FL PKD2, GFP-PKD2ΔCC1 or GFP-PKD2ΔCC2 was co-transfected with an RFP-LC3-encoding plasmid for 24 h. Co-transfection with GFP alone was used as a control. Then, cells were fixed and autophagy quantified by immunofluorescence. Nuclei were dyed with 10 mg/mL of Hoechst 33342 and representative pictures are shown (C). The percentage of cells with RFP-LC3 puncta, % of autophagic cells, is reported in (D) (mean ± SEM, n = 3, *p < 0.05 vs. WT). HeLa cells were transfected as in (B) and then cultured in presence or absence of 30 nM Baf A1 for 2 h. GFP overexpression was used as control. Whole-cell extracts were resolved by western blot and PKD2, GFP, LC3-I and II were identified with specific antibodies. Representative gels are shown in (E) and the levels of LC3-II normalized to the loading control (GAPDH) are indicated at the bottom of the gels and in the graph in (F) (mean ± SEM, n = 3, *p < 0.05 vs. GFP+Baf A1)
Figure 5.
Figure 5.
PKD2 Ca2+ channel function is required for PKD2-BECN1 complex formation and autophagy. Cytosolic Ca2+ is required for autophagy and BECN1-PKD2 complex formation (A-C). Hela cells were subjected to nutrient deprivation with EBSS medium for 2 h with or without 20 μM of BAPTA-AM. Subsequently, autophagy was evaluated by immunofluorescence against endogenous LC3. Nuclei were dyed with 10 mg/mL of Hoechst 33342. Representative pictures are shown in (A) and the percentage of cells with LC3 puncta (autophagic cells) are shown in (B) (mean ± SEM, n = 3, *p < 0.05 vs. Co). WT PKD2 was overexpressed in HeLa cells by infecting the cells with the adenoviral construct AdPKD2 for 24 h. Then, cells were subjected to nutrient deprivation with the EBSS medium with or without 20 μM BAPTA-AM. Immunoprecipitation against BECN1 was performed and PKD2 was evaluated by western blot. Samples containing the whole-cell lysate were used as control and PKD2 and BECN1 were evaluated. Representative gels are shown in (C). PKD2 Ca2+ channel function is required for PKD2-BECN1 complex formation and autophagy (D-H). WT PKD2 or the PKD2D509 V mutant was overexpressed in HeLa cells by transducing the cells for 24 h with adenoviruses. Infection with an empty vector was used as control. Whole protein extracts were prepared, BECN1 immunoprecipitated and PKD2 evaluated by western blot. Representative gels are shown in (D) (n = 3). AdPKD2 or AdPKD2D509 V was overexpressed in HeLa cells for 24 h and autophagy evaluated both by immunofluorescence of endogenous LC3 (E,F) or by western blot by assessing LC3-I to LC3-II turnover in presence or absence of 30 nM Baf A1 (G,H). An empty adenovirus (AdCo) was used as control. Representative pictures are shown in (E) and the percentage of autophagic cells represented in the graph in (F) (mean ± SEM, n = 3, ***p < 0.005 vs. AdCo and &&p < 0.01 vs. AdPKD2). Representative gels of PKD2, LC3-I, LC3-II and the loading control GAPDH are shown in (G) and its quantifications depicted in (H) (mean ± SEM, n = 3, ***p < 0.001 vs. AdCo and &&&p < 0.001 vs. AdPKD2)
Figure 6.
Figure 6.
PKD2-BECN1 in the regulation of autophagy. Proposed model of how PKD2-BECN1 complex formation is involved in autophagy. PKD2 resides at the endoplasmic reticulum membrane, while BECN1 is mainly diffuse throughout the cytoplasm. Interaction between PKD2 and BECN1 increases in autophagy conditions, which is mediated by CC1 domain within PKD2. Finally, cytosolic Ca2+, which can be modulated by PKD2, is required both for PKD2-BECN1 complex formation and autophagy

References

    1. Galluzzi L, Baehrecke EH, Ballabio A, et al. Molecular definitions of autophagy and related processes. Embo J. 2017;36(13):1811–1836. - PMC - PubMed
    1. Onodera J, Ohsumi Y.. Autophagy is required for maintenance of amino acid levels and protein synthesis under nitrogen starvation. J Biol Chem. 2005;280(36):31582–31586. - PubMed
    1. Rich KA, Burkett C, Webster P. Cytoplasmic bacteria can be targets for autophagy. Cell Microbiol. 2003;5(7):455–468. - PubMed
    1. Klionsky DJ, Cregg JM, Dunn WA, et al. A unified nomenclature for yeast autophagy-related genes. Dev Cell. 2003;5(4):539–545. - PubMed
    1. Liu R, Zhi X, Zhong Q. ATG14 controls SNARE-mediated autophagosome fusion with a lysosome. Autophagy. 2015;11(5):847–849. - PMC - PubMed

Publication types