. 2020 Jun 16;16(6):e1008621.
doi: 10.1371/journal.ppat.1008621. eCollection 2020 Jun.

CD11cHi monocyte-derived macrophages are a major cellular compartment infected by Mycobacterium tuberculosis

Affiliations

CD11cHi monocyte-derived macrophages are a major cellular compartment infected by Mycobacterium tuberculosis

Jinhee Lee et al. PLoS Pathog. .

Abstract

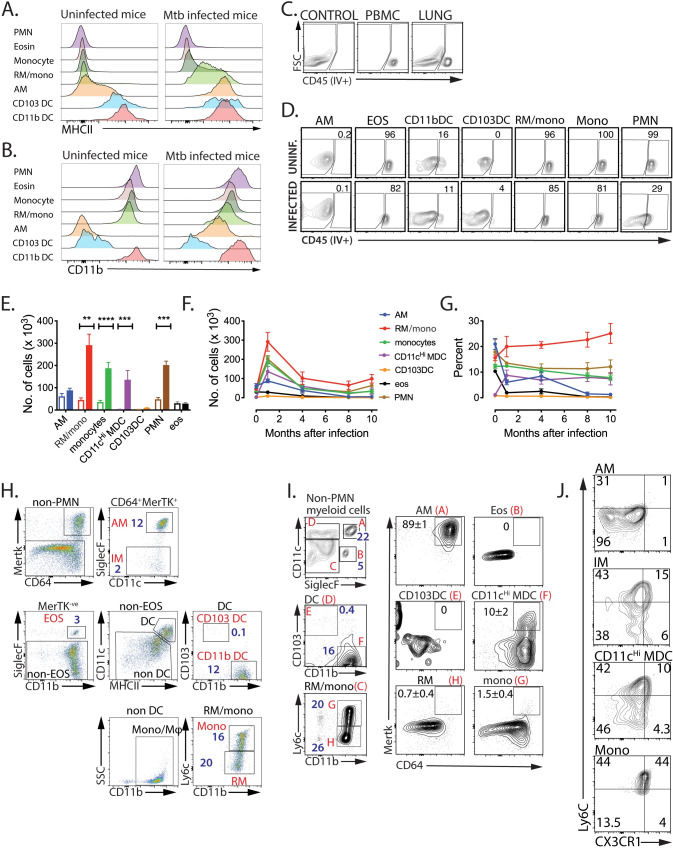
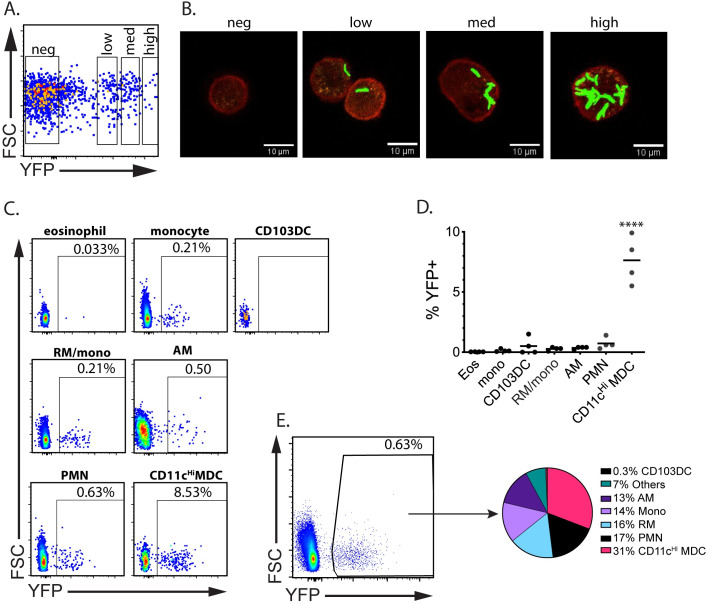
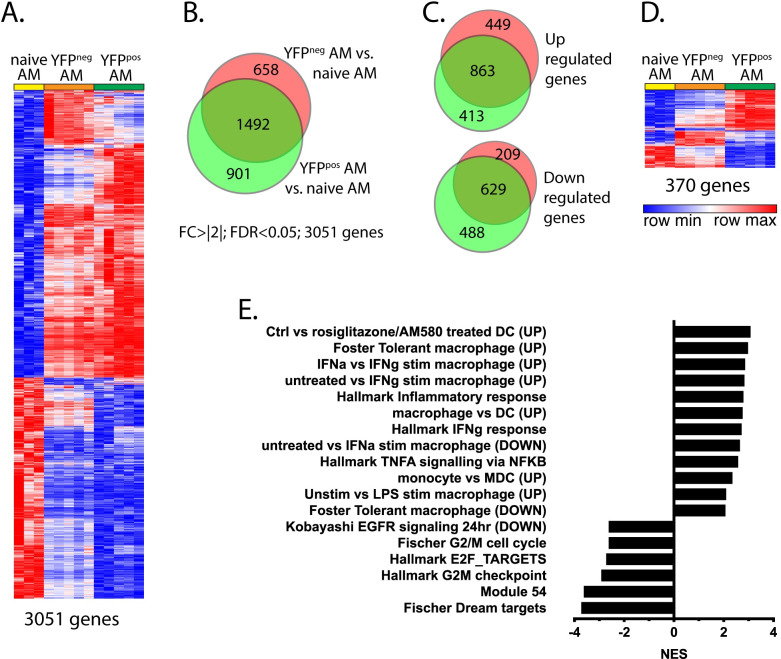
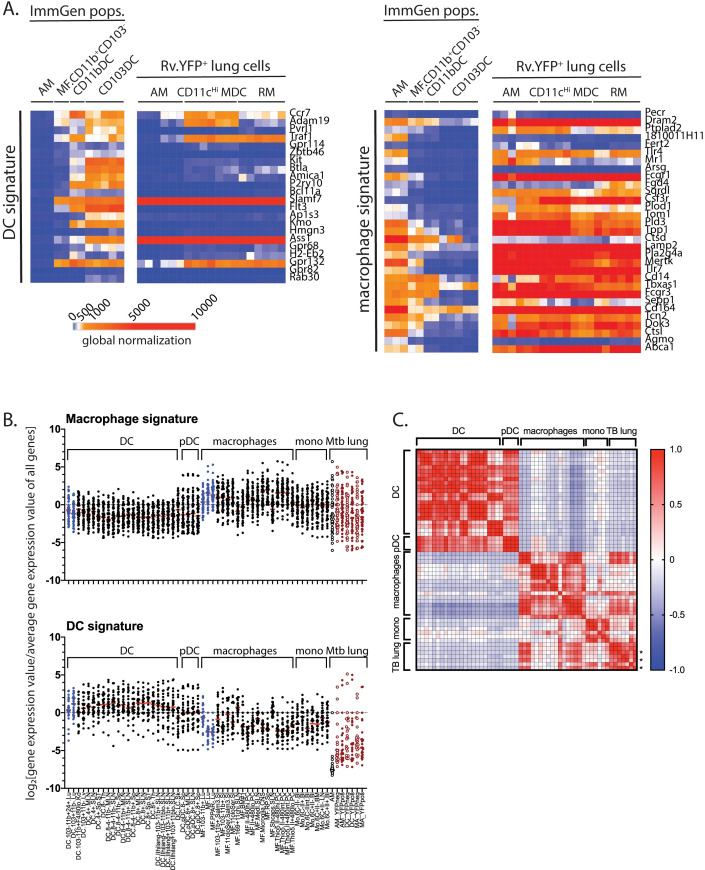
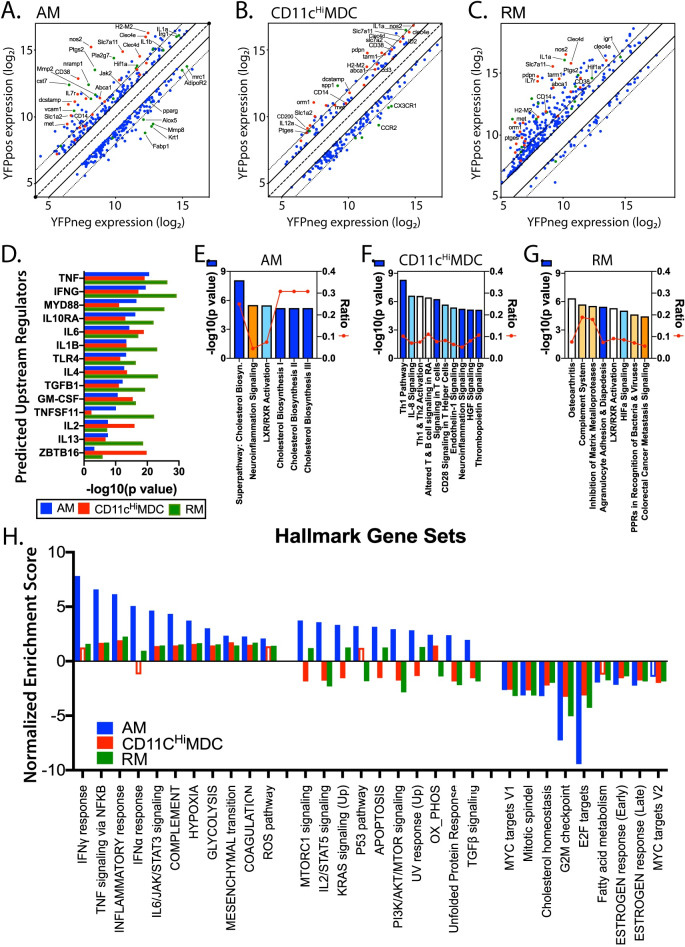
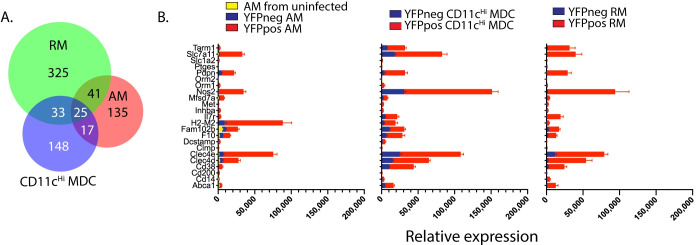
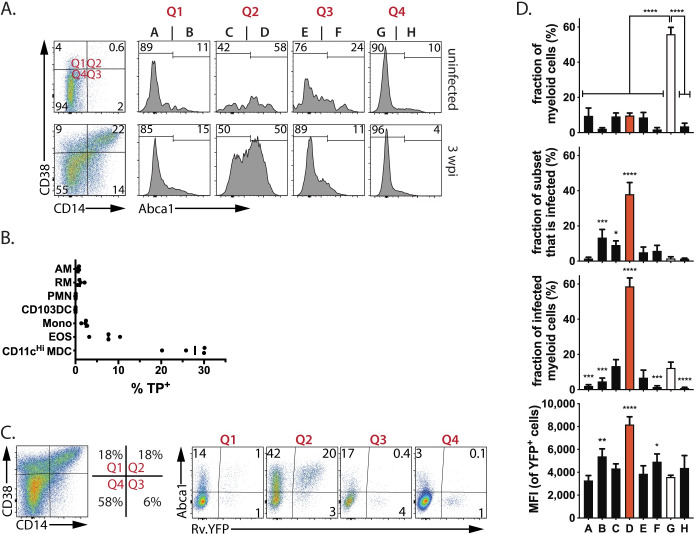
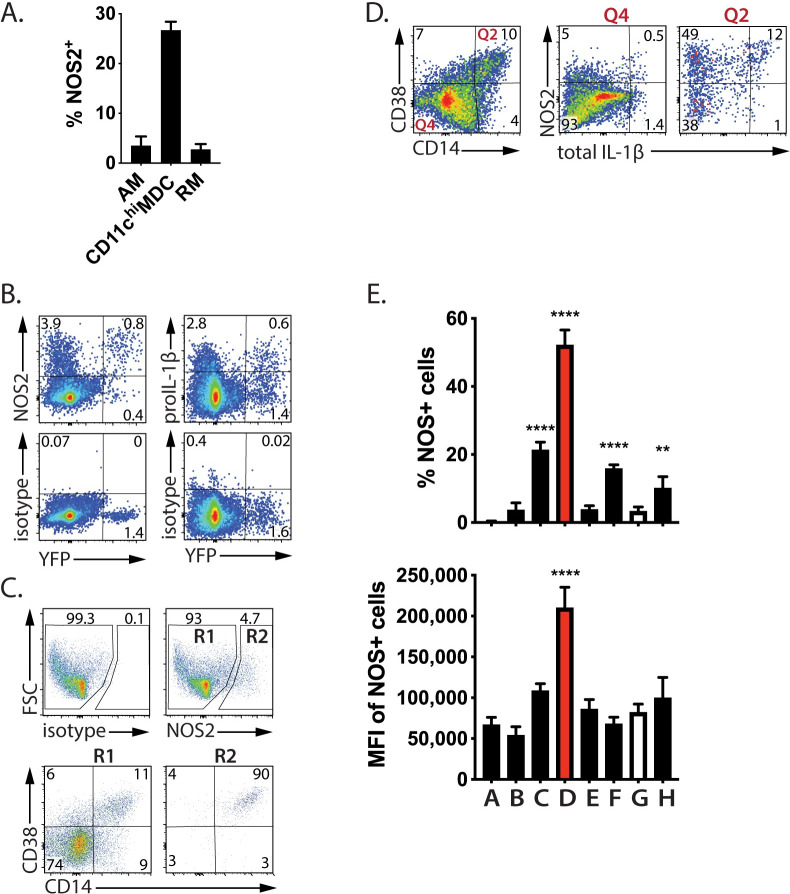
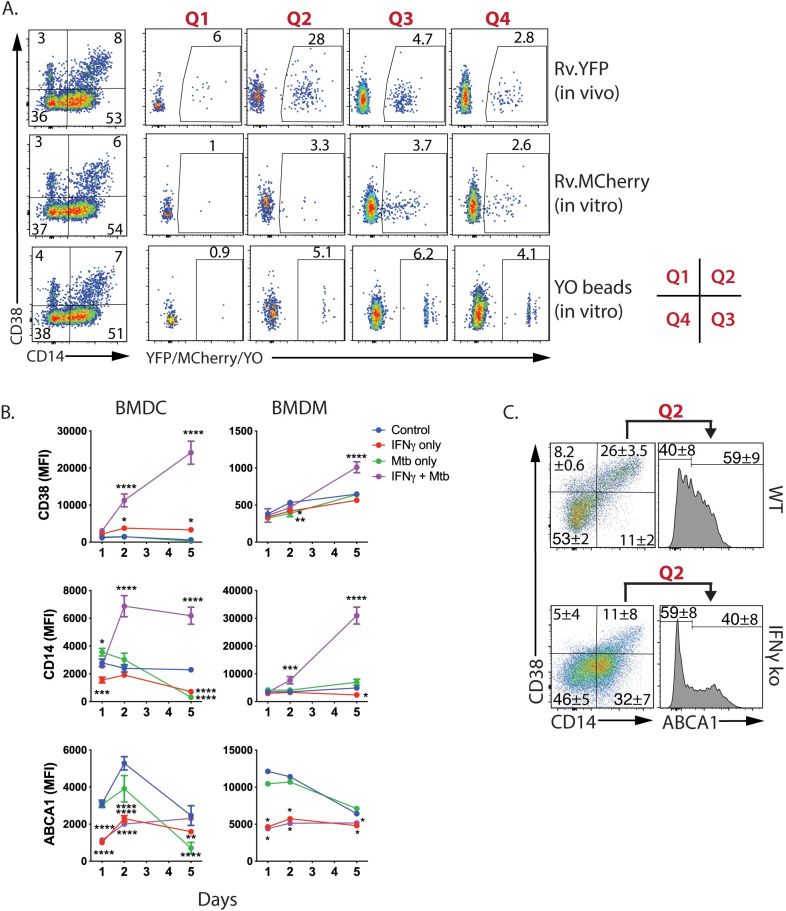
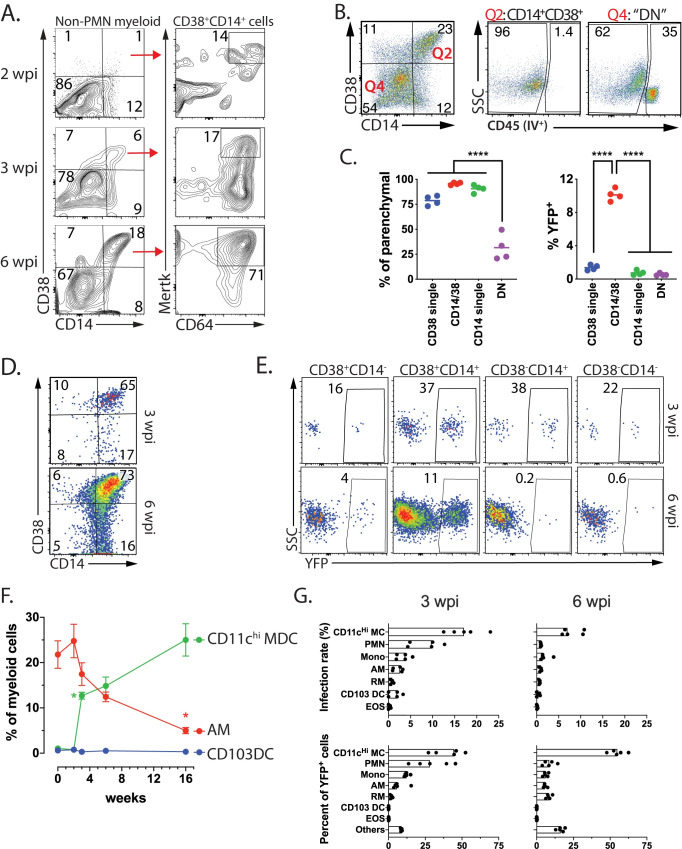
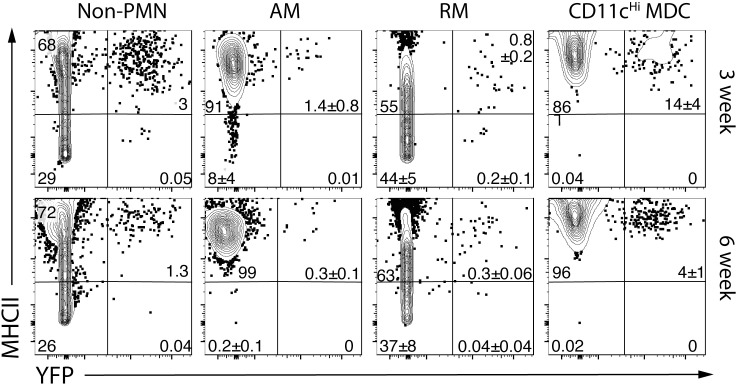
During tuberculosis, lung myeloid cells have two opposing roles: they are an intracellular niche occupied by Mycobacterium tuberculosis, and they restrict bacterial replication. Lung myeloid cells from mice infected with yellow-fluorescent protein expressing M. tuberculosis were analyzed by flow cytometry and transcriptional profiling to identify the cell types infected and their response to infection. CD14, CD38, and Abca1 were expressed more highly by infected alveolar macrophages and CD11cHi monocyte-derived cells compared to uninfected cells. CD14, CD38, and Abca1 "triple positive" (TP) cells had not only the highest infection rates and bacterial loads, but also a strong interferon-γ signature and nitric oxide synthetase-2 production indicating recognition by T cells. Despite evidence of T cell recognition and appropriate activation, these TP macrophages are a cellular compartment occupied by M. tuberculosis long-term. Defining the niche where M. tuberculosis resists elimination promises to provide insight into why inducing sterilizing immunity is a formidable challenge.


Conflict of interest statement

The authors have declared that no competing interests exist.

Figures

Fig 1
Fig 1. Expression of MHCII and CD11b are increased by AM during Mtb infection.
A, B. MHCII is significantly upregulated on AM after Mtb infection. C57BL/6 mice were infected by aerosol with ~100 Rv.YFP. After 4 weeks, lung myeloid cells collected from infected mice were compared with those from uninfected mice for the expression of MHCII (A) and CD11b (B) on each myeloid cell subset. C, D. Each myeloid subset populates a distinct anatomical site. Six weeks after infection, mice were injected i.v. with fluorophore-labelled anti-CD45 mAb 3 min before euthanasia. (C, D) “Control” denotes lung cells from an uninjected mouse. PBMC was used to measure the efficiency of vascular staining. Nearly 50% of lung cells were in the vasculature. Each myeloid cell subset was analyzed for its staining with anti-CD45 mAb. E. Myeloid populations selectively expand after infection. Total lung cells were obtained from uninfected mice or mice infected with Rv.YFP for 3 weeks. 3 wpi, the total number of cells was increased in CD11cHi MDC, RM/mono, monocytes, and PMN after infection, but the number of AM, CD103 DC, and EOS remained unchanged. Each value represents the average of 5 mice. F, G. The number and relative abundance of RM/mono, monocytes, PMNs, and CD11cHi MDC, peaked 1 month after infection and then declined. Each value represents the average of 5 mice. H: IMs constitute a small fraction of the lung myeloid cells, after 3 weeks post aerosol Mtb infection. The gating scheme used by Huang et al. was used to identify IM (defined as CD64+MertK+SiglecF- non-PMN myeloid cells). The numbers refer to the percentage of each cell population among non-PMN myeloid cells. I. CD11cHi MDC overlap with IM. Using our gating scheme, we define the percentage of each cell population among non-PMN myeloid cells (left, blue numbers). The expression of CD64 and MertK is determined for each major cell population, and the percentage of CD64+MertK+ cells is indicated by the black numbers. J. AM, IM, CD11cHi MDC, and Mono were analyzed for the expression of CX3CR1 and Ly6C, markers for monocyte-derived cells. These results are representative of 5 (A-D), 2 (E), 2 (F, G), 2 (H-J) experiments. The SD for Fig 1D, 1H, 1I and 1J are not shown for clarity, but were generally <10% of the mean. PMN, neutrophils; EOS or eosin, eosinophils; Mono, monocytes; RM, recruited macrophages, AM, alveolar macrophages; CD103DC, cDC1; CD11bDC, cDC2; CD11cHi MDC, CD11cHi monocyte-derived cells. **, p<0.01, ***, p<0.001, p<0.0001, by a two-way ANOVA.
Fig 2
Fig 2. Infected myeloid cells can be tracked using Rv.YFP.
A, B. To correlate bacterial load and MFI, C57BL/6 mice were infected i.t. with a high dose (1 x 10⁵ per animal) of Rv.YFP. Alveolar macrophages were sorted into YFP-ve, YFPlow, YFPint, and YFPHi using a cell sorter (A), and each bin of sorted cells was analyzed by fluorescence microscopy (B). The images were captured by confocal microscopy using a 60x objective. C, D, E. At 3 wpi, total lung cells from infected mice were collected, and each myeloid subset was analyzed to determine the frequency of YFP-positive cells (C). Results from four independent mice summarized (D). From the same experiment, the YFP+ cells were gated and then the frequency of the different myeloid cells present was determined (E). Each pie slice represents the average of 4 mice. These data are representative of 3 experiments. ****, p<0.0001 by 1-way ANOVA compared to eosinophils.
Fig 3
Fig 3. Infected AM display the unique transcriptional signature.
A. Differentially regulated genes (DRGs) between infected (“YFPpos”) or uninfected (“YFPneg”) AM from Mtb-infected lungs vs. uninfected macrophages from naïve mice (“N”, e.g., YFPpos/N or YFPneg/N) were determined using criteria of [FC]>2 and an FDR<0.05. The 3051 DRGs were clustered and a heat map generated. Each column represents each animal. B. Distribution of genes specifically up or down regulated in AM of Mtb-infected mice vs. AMs of naïve mice were depicted. C. Upregulated genes and downregulated genes were separately analyzed between AM of Mtb-infected mice and AM of uninfected mice. D. 370 genes that were differentially expressed between YFPpos or YFPneg AM from infected mice were clustered, and a heat map generated. E. The results of the GSEA analysis of the 370 DRGs.
Fig 4
Fig 4. The transcriptional signature of YFPpos CD11cHi MDC is closely aligned with macrophages and monocytes.
A. Using well-described transcriptional gene signatures for DC [32] or macrophages [31], YFPpos AM, CD11cHi MDC, and RM were compared to well-defined lung myeloid cell populations from uninfected mice (data from www.Immgen.org) using a heat map with global normalization. B. To quantify the macrophage and DC gene signatures, the log2[specific gene expression / average total gene expression] was determined for 43 myeloid unique ImmGen myeloid cell populations and the seven populations we analyzed, grouped by cell type or “Mtb lung data”, which refers to data derived from this study. Red bar, median. pDC, plasmacytoid DC. Blue, ImmGen lung populations; open black, AM from uninfected mice; open red; YFPneg cells; closed red, YFPpos cells. Not that the ImmGen data and our data obtained with different Affymetrix chips. C. Using a gene signature that distinguishes ImmGen DC from macrophages (see S4 Fig), a Pearson correlation analysis was performed for all the cell populations. “*” indicates YFPpos populations.
Fig 5
Fig 5. Transcriptional analysis of infected AM, CD11cHi MDC, and RM.
A, B, C. Using an FDR <0.05 and a fold-change >[2], we detected 370, 231, and 424 DRGs, between YFPpos and YFPneg cells in AM (A), CD11cHiMDC (B), and RM (C) from infected mice, respectively. For each of these cell types, the log2 expression differences between YFPpos and YFPneg cells is plotted. The line of identity is the dashed line; the solid line represents ±2, and the dotted line is ±4-fold difference. Red dots identify genes that were differentially regulated in all three cell types. Green dots identify other genes of interest. The identities of some genes are annotated. D. Ingenuity pathway analysis (IPA) predicted upstream signals for each cell type based on the DRGs. Each bar represents the -log10(p value). E, F, G. IPA predicted canonical pathways based on DRGs. Pathways predicted to be upregulated are shaded using warm colors; pathways predicted to be downregulated are shaded with cool colors. The bars indicate the log10 p values; the line indicates the fraction of genes from each pathway that were identified as DRGs. H. Top pathways predicted by GSEA for each cell type. Bars, normalized enrichment score (NES). FDR<0.05 (solid bars); FDR>0.05 (open bars).
Fig 6
Fig 6. 25 genes are upregulated genes in infected AM, CD11cHi MDC, and RM.
A. The distribution of the 724 genes that are upregulated in YFPpos or YFPneg AM, YFPpos or YFPneg CD11cHi MDC, or YFPpos or YFPneg RM. B. The expression levels of the 25 shared genes in YFPpos vs. YFPneg AM, CD11cHi MDC, or RM. For AM, data from uninfected AM obtained from uninfected mice, is also shown.
Fig 7
Fig 7. CD38+/CD14+/ABCA1+ (‘TP’ cells) myeloid cells are highly Mtb-infected.
A. The expression of CD38, CD14, and ABCA1 by non-PMN myeloid cells from the lungs of B6 mice, 3 wpi. Quadrants are defined as follows: Q1, CD38+CD14-ve; Q2, CD38+CD14+; Q3, CD38-veCD14+; and Q4, CD38-veCD14-ve. Each quadrant was then further divided into Abca1 negative and positive cells. This Boolean gating based on CD38, CD14, and ABCA1 expression defines 8 populations (labelled ‘A’ through ‘H’). B. The frequency of TP cells in each myeloid cell subsets. Each point represents one individual subject. C. CD38+CD14+ABCA1+ (‘TP’ cells) are enriched among YFP+ cells. Quadrants, based on CD38 and CD14 staining, were analyzed for YFP and ABCA1 expression. The highest frequency of YFP+ cells is found in CD38+CD14+ABCA1+ cells. D. For each of the gated cells populations labelled in Fig 7A as A through H, we determined: (1) the percentage of total myeloid cells in each gate; (2) the frequency of cells in each gate that are infected with Rv.YFP; (3) the contribution that each population makes to the total number of infected cells; and, (4) the MFI of the YFP+ cells in each gate. These data are representative of five independent experiments. Empty bars, ‘TN’ cells; red bars, ‘TP’ cells. Statistics, one-way ANOVA compared to ‘TN’ cells. Error bars, SD. *, p<0.05; **, <0.01, ***, <0.001, ****, <0.0001.
Fig 8
Fig 8. TP cells are NOS2-producing.
A. The frequency of NOS2+ cells among CD11cHi MDC, AM and RM. B. Most Mtb-infected cells (Rv.YFP+) produce NOS2 and many produce IL-1β. C. NOS2 was produced nearly exclusively by CD14/CD38 double positive cells. The expression of CD14 and CD38 by NOS2-ve (R1) and NOS2+ (R2) cells was determined by flow cytometry. D. CD38+/CD14+ cells are highly enriched in cells producing NOS2 and IL-1β. CD14/CD38 double positive cells (Q2), or double negative cells (Q4) were analyzed for intracellular NOS2 and IL-1β expression. E. TP cells produce the highest amount of NOS2. For each of the cell populations expressing various combinations of CD38, CD14 and ABCA1 (A-H, defined by Boolean gating, see Fig 6), we determined the: (1) percentage of cells that produce NOS2; and, (2) the MFI of NOS2 expression. Empty bars, ‘TN’ cells; red bars, ‘TP’ cells. The plots were gated on non-PMN myeloid cells and are representative of three independent experiments. Statistics, one-way ANOVA compared to ‘TN’ cells. Error bars, SD. *, p<0.05; **, <0.01, ***, <0.001, ****, <0.0001.
Fig 9
Fig 9. TP cell phagocytosis and IFNγ responsiveness.
A. Lung TP myeloid cells are not more phagocytic or likely to become infected by Mtb. Four weeks after infection with Rv.YFP, single cell suspensions from the lung were obtained and infected in vitro with Rv.mCherry (MOI 5, 2.5 h). Cells were also incubated with YO-beads to measure phagocytosis. Top row, Distribution of Rv.YFP among CD14/CD38-expressing myeloid cells. After excluding the Rv.YFP+ cells by gating, the Rv.YFP-ve cells were analyzed for their uptake of Rv.mCherry (middle row), or phagocytosis of YO-beads (bottom row). B. IFNγ promotes CD38 and CD14 expression by myeloid cells. BMDC and BMDC were infected with Rv.YFP at an MOI of 0.2 in the presence or absence of IFNγ for 1, 2, or 5 days, and the expression of CD28, CD14, and ABCA1 were determined. C. IFNγ promotes TP cell generation in vivo. IFNγ KO or WT mice were infected with Rv.YFP and on day 25, non-PMN myeloid cells were analyzed for the expression of CD14, CD38, and Abca1. These data are from individually analyzed mice (WT, n = 3; IFNγ KO, n = 3).
Fig 10
Fig 10. TP CD11cHi MDC are frequently infected by Mtb.
A. CD64 and MerTK expression by CD14+/CD38+ myeloid cells at 2, 3, or 6 weeks after Mtb infection. B. CD14+/CD38+ myeloid cells (i.e., “Q2”) are exclusively located in the lung parenchymal compartment while 35% of the CD14-/CD38- myeloid cells (i.e., “Q4”) are in the vasculature staining from intravenously administered anti-CD45 mAb. C. Quantification of parenchymal location of CD14+/CD38+ myeloid cells CD38 staining (from Fig 10B) (left) and the frequency of YFP+ cells among the four subsets (right). D. A majority of CD64+/MerTK+ myeloid “IM” cells express CD14 and CD38, 3 and 6 wpi. E. The frequency of YFP+ cells among CD64+/MerTK+ myeloid “IM” cells based on their expression of CD14 and CD38 expression at 3 and 6 wpi. F. The frequencies of CD11cHi MDC, AM and CD103 DC among myeloid cells after infection with Rv.YFP over time. Error bars, SD. *, p<0.05; t-test compared to the prior timepoint. Each time point represents five mice. G. The infection rate (%YFP+) for each of the seven myeloid cell types (top row) and the contribution of each cell type to the total YFP+ population (bottom row). Non-PMN myeloid cells (A-E) or total myeloid cells (F, G) were analyzed. Each time experimental group consists of five mice and is representative of at least two independent experiments.
Fig 11
Fig 11. Mtb-infected CD11cHi MDC have high class II MHC expression.
Class II MHC expression by uninfected and Mtb-infected (i.e., YFP+) non-PMN myeloid cells, or the AM, RM, and CD11cHi MDC subsets from the lungs of C57BL/6 mice, three and six weeks after infection by aerosol route with ~100 Rv.YFP. Numbers represent the quadrant means ± SD (n = 4–5 mice/time point).

References

    1. Schyns J, Bai Q, Ruscitti C, Radermecker C, De Schepper S, Chakarov S, et al. Non-classical tissue monocytes and two functionally distinct populations of interstitial macrophages populate the mouse lung. Nat Commun. 2019;10(1):3964 Epub 2019/09/05. 10.1038/s41467-019-11843-0 - DOI - PMC - PubMed
    1. Gibbings SL, Thomas SM, Atif SM, McCubbrey AL, Desch AN, Danhorn T, et al. Three Unique Interstitial Macrophages in the Murine Lung at Steady State. Am J Respir Cell Mol Biol. 2017;57(1):66–76. 10.1165/rcmb.2016-0361OC - DOI - PMC - PubMed
    1. Yona S, Kim KW, Wolf Y, Mildner A, Varol D, Breker M, et al. Fate mapping reveals origins and dynamics of monocytes and tissue macrophages under homeostasis. Immunity. 2013;38(1):79–91. Epub 2013/01/01. 10.1016/j.immuni.2012.12.001 - DOI - PMC - PubMed
    1. Scott CL, Henri S, Guilliams M. Mononuclear phagocytes of the intestine, the skin, and the lung. Immunol Rev. 2014;262(1):9–24. Epub 2014/10/17. 10.1111/imr.12220 . - DOI - PubMed
    1. Guilliams M, Mildner A, Yona S. Developmental and Functional Heterogeneity of Monocytes. Immunity. 2018;49(4):595–613. Epub 2018/10/18. 10.1016/j.immuni.2018.10.005 . - DOI - PubMed

Publication types

MeSH terms