Case Reports
. 2020 Jun 16;16(6):e1008841.
doi: 10.1371/journal.pgen.1008841. eCollection 2020 Jun.

yippee like 3 (ypel3) is a novel gene required for myelinating and perineurial glia development

Affiliations
Case Reports

yippee like 3 (ypel3) is a novel gene required for myelinating and perineurial glia development

Bernardo Blanco-Sánchez et al. PLoS Genet. .

Erratum in

  • Correction: yippee like 3 (ypel3) is a novel gene required for myelinating and perineurial glia development.
    Blanco-Sánchez B, Clément A, Stednitz SJ, Kyle J, Peirce JL, McFadden M, Wegner J, Phillips JB, Macnamara E, Huang Y, Adams DR, Toro C, Gahl WA, Malicdan MCV, Tifft CJ, Zink EM, Bloodsworth KJ, Stratton KG; Undiagnosed Diseases Network; Koeller DM, Metz TO, Washbourne P, Westerfield M. Blanco-Sánchez B, et al. PLoS Genet. 2020 Oct 26;16(10):e1009156. doi: 10.1371/journal.pgen.1009156. eCollection 2020 Oct. PLoS Genet. 2020. PMID: 33104717 Free PMC article.

Abstract

Hypomyelination, a neurological condition characterized by decreased production of myelin sheets by glial cells, often has no known etiology. Elucidating the genetic causes of hypomyelination provides a better understanding of myelination, as well as means to diagnose, council, and treat patients. Here, we present evidence that YIPPEE LIKE 3 (YPEL3), a gene whose developmental role was previously unknown, is required for central and peripheral glial cell development. We identified a child with a constellation of clinical features including cerebral hypomyelination, abnormal peripheral nerve conduction, hypotonia, areflexia, and hypertrophic peripheral nerves. Exome and genome sequencing revealed a de novo mutation that creates a frameshift in the open reading frame of YPEL3, leading to an early stop codon. We used zebrafish as a model system to validate that YPEL3 mutations are causative of neuropathy. We found that ypel3 is expressed in the zebrafish central and peripheral nervous system. Using CRISPR/Cas9 technology, we created zebrafish mutants carrying a genomic lesion similar to that of the patient. Our analysis revealed that Ypel3 is required for development of oligodendrocyte precursor cells, timely exit of the perineurial glial precursors from the central nervous system (CNS), formation of the perineurium, and Schwann cell maturation. Consistent with these observations, zebrafish ypel3 mutants have metabolomic signatures characteristic of oligodendrocyte and Schwann cell differentiation defects, show decreased levels of Myelin basic protein in the central and peripheral nervous system, and develop defasciculated peripheral nerves. Locomotion defects were observed in adult zebrafish ypel3 mutants. These studies demonstrate that Ypel3 is a novel gene required for perineurial cell development and glial myelination.


Conflict of interest statement

"The authors have declared that no competing interests exist."

Figures
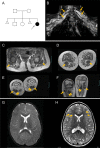
Fig 1
Fig 1. Proband has myelination defects and greatly enlarged nerves.
(A) Pedigree of the family; arrow points to the proband; triangular shapes indicate instances of spontaneous abortion. (B-F) MRI of upper and lower extremities demonstrates enlarged nerves. (B) Image showing greatly enlarged brachial plexus. Arrows indicate the thick peripheral nerves. (C) Sciatic nerve at the level of the femoral head (arrows). (D) Sciatic nerve at the level of the mid-thigh (arrows). (E) Posterior tibial (double arrows) and peroneal (single arrows) nerves at their origins. (F) Posterior tibial (double arrows) and peroneal (single arrows) nerves at the level of the fibular head. Scale bars, 3 cm. (G) Representative brain MRI (axial, T2-weighted) showing poor delineation of white and gray matter, indicating reduced myelination, when compared to age-matched control (H). Note the delineation of white and gray matter in control (arrows) that is not seen in the patient.
Fig 2
Fig 2. YPEL3 is an evolutionarily conserved disease-causing candidate gene.
(A-C) ypel3 is maternally deposited and expressed during neural development in zebrafish. (A) Two-cell stage embryo. (B-C) Transverse sections. (B) At 24 hours postfertilization (hpf), ypel3 is expressed broadly in the spinal cord and sparsely in the somites (red arrows). (C) At 56 hpf, ypel3 is expressed in the spinal cord and in the region where the motor roots develop (red arrows). (D) Diagram of spinal cord domains, their derivatives, and molecular markers. The pMN domain (olig 2+) gives rise first to motoneurons, and then later oligodendrocytes (Briscoe et al., 2000; Jessell, 2000; Danesin and Soula, 2017). The p3 domain (nkx2.2+) is localized ventral to the pMN domain and gives rise to oligodendrocytes and a subset of perineurial cells (Clark et al., 2014; Kucenas et al., 2008b). Schwann cells (SC) are neural crest derivatives. Scale bar: 250 μm in A, 25 μm in B and C.
Fig 3
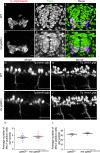
Fig 3. Specification and development of motoneurons are unaffected in maternal-zygotic ypel3 mutants.
(A-F) Analysis of the pMN domain and its derivatives. Transverse sections. (A-C) WT. (D-F) maternal zygotic (mz) ypel3-/-. (A, D) pMN domain and its derivatives labeled by olig2:kaede transgene. (B, E) Topro nuclear labeling. (C, F) Merge. (G-J) Analysis of motoneuron development in mz ypel3 mutants. Lateral views. Motoneurons are labeled by the mnx1:gfp transgene. (G-H) WT embryo at 26 hpf (G) and larva at 52 hpf (H). (I-J) mz ypel3 mutant at 26 hpf (I) and larva at 52 hpf (J). Images were taken at the level of somites 6 to10. (K-L) Quantification of the number of motoneurons at 26 hpf (K) and at 52 hpf (L). Bars show +/- SEM. Scale bars: 5 μm in A-F, 25 μm in G-J.
Fig 4
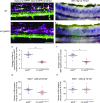
Fig 4. ypel3 is required for myelinating oligodendrocyte development.
(A-B) WT larvae at 52 hpf (A) and at 72 hpf (B). (C-D) mz ypel3 mutants at 52 hpf (C) and at 72 hpf (D). Arrows indicate myelinating oligodendrocytes (double mRFP, mGFP positive cells) in (A) and (C). Black arrowheads show myelinating oligodendrocytes expressing mbpb in (B and D). Scale bars: 25 μm. Images are lateral views. (E-H) Quantification of the number of myelinating oligodendrocytes at 52 hpf (E), mbpb expressing cells at 72 hpf (F), EdU positive cells at 52 hpf (G) and 72 hpf (H). Bars represent +/- SEM.
Fig 5
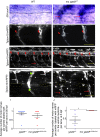
Fig 5. Ypel3 is required for proper development of Schwann cells.
(A-B) sox10 mRNA in situ hybridization (ISH) in WT (A) and mz ypel3 mutant (B) showing maintained sox10 expression (red arrows) in the mz ypel3 mutant at 26 hpf. (C-D) Schwann cell precursors migrate correctly in the region of the developing motor nerves in the mz ypel3 mutant. WT (C) and mz ypel3 mutant (D) embryos at 26 hpf. Arrowheads indicate Schwann cell precursors. (E-F) Initial ensheathing of motor axons by Schwann cells occurs properly in the mz ypel3 mutant. WT (E) and mz ypel3 mutant (F) larvae at 56 hpf. Arrowheads indicate motor nerves. Arrow indicates ventral Schwann cells ensheathing motor nerve. (G-H) Schwann cells fail to form normal structures in the mz ypel3 mutant. At 5 days postfertilization (dpf), in WT (G), Schwann cells form slender rod-like structures (arrows). At this stage, the mRFP signal has cleared from the ventral myotome. In the mz ypel3 mutant (F), Schwann cells fail to wrap the motor axon tightly and sox10 expression as indicated by mRFP is maintained within the ventral region of the myotome. Yellow dashed lines outline melanocytes. Green arrowheads indicate blood vessels. All images are lateral views. Scale bars: 25 μm. (I) Quantification of the average number of motor nerves per somite labeled with sox10:mRFP at 56 hpf. (J) Quantification of the average number of motor nerves per somite labeled with sox10:mRFP at the level of ventral myotome. Bars represent +/-SEM.
Fig 6
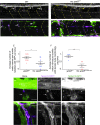
Fig 6. Ypel3 is required for perineurial glia ensheathing.
(A) WT larva at 56 hpf. Perineurial glia (expressing nkx2.2a:GFP, green) have migrated out of the CNS and begun to ensheath the motor nerve. White arrows indicate perineurial glia associated with the immature motor nerve. (B) mz ypel3-/- mutant at 56 hpf. At this stage, perineurial glia are largely absent, and the few that migrate out of the CNS appear wispy and thin (yellow arrows). (C) In WT larvae at 5 dpf, perineurial glia are tightly associated with Schwann cells (expressing sox10:mRFP, magenta) forming slender tubes (white arrows). A small percentage of WT perineurial cells have not formed these slender tubes (arrowhead). (D) In mz ypel3-/- mutants, at 5 dpf, perineurial glia are overgrown and fail to associate with the Schwann cells. Yellow dashed lines label the somite boundaries. Scale bar: 25 μm. (E-F) Quantification of the average number of motor nerves per somite labeled with GFP (E) and the average number of motor nerves per somite with slender tube morphology (F). (G-G”) WT larvae at 7 dpf. Perineurial glia have completely wrapped the Schwann cells forming a tubular structure (arrows). Some mRFP expression remains within the Schwann cells. (G) Merge. (G’) mRFP expression is clustered within the GFP positive domain (outlined with white dashed lines), which is composed of perineurial cells. (G”) Perineurial cells form a tubular structure (outlined with white dashed lines). (H-H”) mz ypel3 mutant at 7 dpf. Perineurial glia are overgrown and form a defasciculated structure. (H) Merge. (H’) mRFP signal is elevated in the mz ypel3 mutant Schwann cells and delineates three defasciculated structures (1, 2, 3). (H”) mz ypel3 mutant perineurial glia fail to wrap Schwann cells correctly resulting in an enlarged nerve (outlined with white dashed lines). White horizontal line in (G-H”) spinal cord ventral border. White horizontal dashed line (A-D) horizontal myoseptum. SC: spinal cord. *: loose perineurial cells. All images are lateral views. Scale bars: 25 μm in A-D, 5 μm in G-H”.
Fig 7
Fig 7. Ypel3 is required for myelination and locomotory behavior.
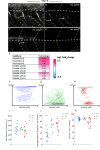
(A-D) Myelin basic protein b (Mbpb) expression. Lateral views of embryos labeled for Mbpb at 7 dpf. (A) WT. (B-D) mz ypel3 mutants. Mbpb levels are undetectable in the spinal cord (sc) and variably reduced in the motor nerves (arrows). Yellow arrow shows a fasciculated nerve with a homogenous distribution of the Mbpb signal in WT. White arrows show defasciculated nerves in mz ypel3 mutants. Mutant nerves have variable levels and an uneven distribution of Mbpb. White horizontal dashed lines indicate the spinal cord ventral border in (A-B) and the horizontal myoseptum in (C-D). Yellow dashed chevron: somite borders. Scale bar: 25 μm. (E) Lipidomics panel showing an increase in phosphatic acids (PA) and ceramides (Cer) except Cer(d18:1/20:0) in the mz ypel3 mutant compared to WT. (F-K) Adult mz ypel3-/- mutants have behavioral and locomotion defects. (F-H) Representative swimming traces of WT (F), heterozygous ypel3b1309 (G), and homozygous mz ypel3b1309 mutants (H). (I-K) Quantification of total distance traveled (I), average relative distance from the surface (J), and percent time spent in motion (K). +/+: WT. +/-: heterozygous. -/-: mz ypel3 mutants. Bars represent +/- standard error of the mean (+/- SEM).

References

    1. Zalc B (2016) The acquisition of myelin: An evolutionary perspective. Brain Res 1641: 4–10. 10.1016/j.brainres.2015.09.005 - DOI - PubMed
    1. Hodgkin AL (1937) Evidence for electrical transmission in nerve: Part I. J Physiol 90: 183–210. 10.1113/jphysiol.1937.sp003507 - DOI - PMC - PubMed
    1. Lillie RS (1925) Factors Affecting Transmission and Recovery in the Passive Iron Nerve Model. J Gen Physiol 7: 473–507. 10.1085/jgp.7.4.473 - DOI - PMC - PubMed
    1. Seidl AH (2014) Regulation of conduction time along axons. Neuroscience 276: 126–134. 10.1016/j.neuroscience.2013.06.047 - DOI - PMC - PubMed
    1. Zhou Q, Anderson DJ (2002) The bHLH transcription factors OLIG2 and OLIG1 couple neuronal and glial subtype specification. Cell 109: 61–73. 10.1016/s0092-8674(02)00677-3 - DOI - PubMed

Publication types

MeSH terms