

Frailty Parameters, Morbidity and Mortality in Older Adults with Cancer: A Structural Equation Modelling Approach Based on the Fried Phenotype
- PMID: 32545298
- PMCID: PMC7356550
- DOI: 10.3390/jcm9061826
Frailty Parameters, Morbidity and Mortality in Older Adults with Cancer: A Structural Equation Modelling Approach Based on the Fried Phenotype
Abstract
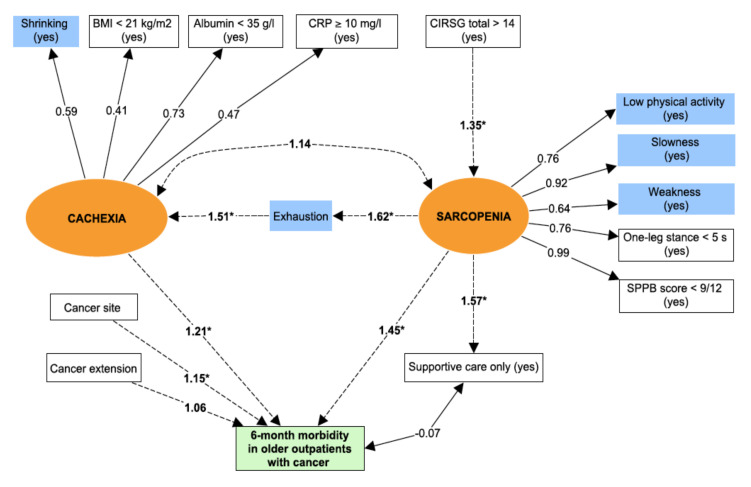
Background: to distinguish direct and indirect pathways to frailty phenotype, and quantify associations between two frailty components (i.e., sarcopenia and cachexia) regarding mortality and morbidity in older adults with cancer.
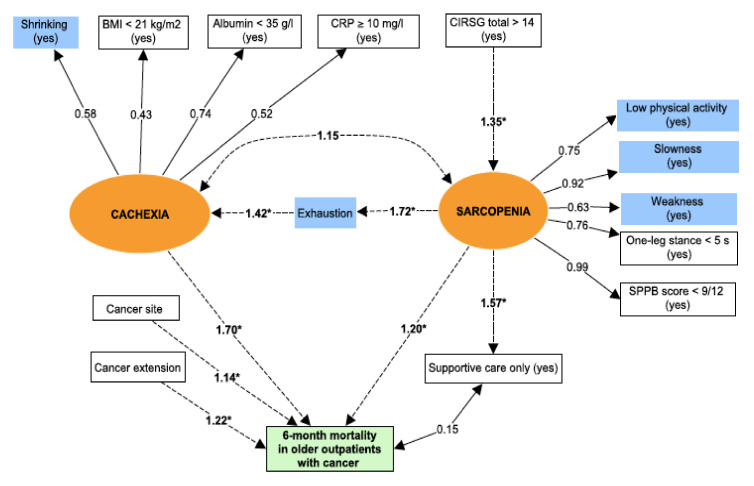
Methods: all consecutive older outpatients with cancer were included in a prospective two-centre cohort study between 2013 and 2017 and had geriatric assessment. We used the frailty phenotype. Sarcopenia and cachexia were built as latent variables by including observed variables related to physical performances and related to nutrition and inflammation respectively. Structural equation modelling was used to distinguish between direct and indirect effects of the frailty parameters on the risk of death (Model 1) and the risk of morbidity (defined by unplanned hospitalization and/or disability and/or a fall; Model 2). The root mean square error of approximation (RMSEA) and the comparative fit index (CFI) were used to assess the model fit.
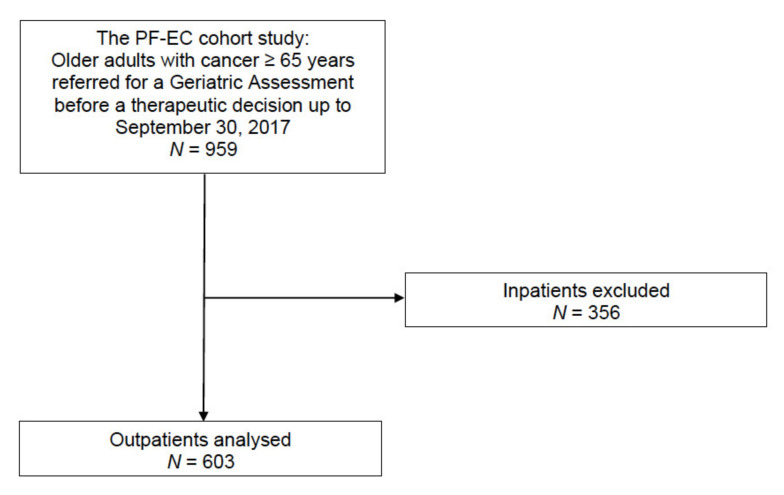
Results: 603 older outpatients were included (mean age: 81.2 ± 6.1; women: 54%; frailty phenotype: 58%). The 6-month mortality and morbidity rates were 18% and 64%, respectively. The fit was good for both models (RMSEA and CFI = 0.029 [0.017-0.039] and 0.99 for Model 1, and 0.028 [0.017-0.039] and 0.99 for Model 2, respectively). Sarcopenia and cachexia were both directly and significantly associated with 6-month mortality (βsarcopenia = 0.18, p = 0.01; βcachexia = 0.52, p < 0.0001) and morbidity (βsarcopenia = 0.37, p < 0.0001; βcachexia = 0.19, p < 0.02).
Conclusions: sarcopenia and cachexia had a direct pathway with 6-month mortality and morbidity in older cancer patients.
Keywords: cachexia; cancer; morbidity; mortality; sarcopenia; structural equation modelling.
Conflict of interest statement
The authors declare no conflict of interest.
Figures
References
-
- Walston J., Hadley E.C., Ferrucci L., Guralnik J.M., Newman A.B., Studenski S.A., Ershler W.B., Harris T., Fried L.P. Research Agenda for Frailty in Older Adults: Toward a Better Understanding of Physiology and Etiology: Summary from the American Geriatrics Society/National Institute on Aging Research Conference on Frailty in Older Adults. J. Am. Geriatr. Soc. 2006;54:991–1001. doi: 10.1111/j.1532-5415.2006.00745.x. - DOI - PubMed
-
- Buta B.J., Walston J.D., Godino J.G., Park M., Kalyani R.R., Xue Q.-L., Bandeen-Roche K., Varadhan R. Frailty assessment instruments: Systematic characterization of the uses and contexts of highly-cited instruments. Ageing Res. Rev. 2016;26:53–61. doi: 10.1016/j.arr.2015.12.003. - DOI - PMC - PubMed
LinkOut - more resources
Full Text Sources
Miscellaneous
