. 2020 Jun 11;9(6):774.
doi: 10.3390/foods9060774.

A Multisensor Data Fusion Approach for Predicting Consumer Acceptance of Food Products

Affiliations

A Multisensor Data Fusion Approach for Predicting Consumer Acceptance of Food Products

Víctor M Álvarez-Pato et al. Foods. .

Abstract

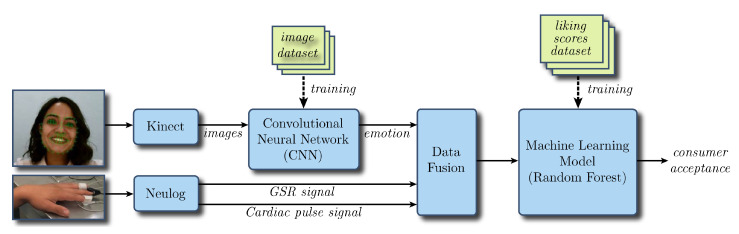
Sensory experiences play an important role in consumer response, purchase decision, and fidelity towards food products. Consumer studies when launching new food products must incorporate physiological response assessment to be more precise and, thus, increase their chances of success in the market. This paper introduces a novel sensory analysis system that incorporates facial emotion recognition (FER), galvanic skin response (GSR), and cardiac pulse to determine consumer acceptance of food samples. Taste and smell experiments were conducted with 120 participants recording facial images, biometric signals, and reported liking when trying a set of pleasant and unpleasant flavors and odors. Data fusion and analysis by machine learning models allow predicting the acceptance elicited by the samples. Results confirm that FER alone is not sufficient to determine consumers' acceptance. However, when combined with GSR and, to a lesser extent, with pulse signals, acceptance prediction can be improved. This research targets predicting consumer's acceptance without the continuous use of liking scores. In addition, the findings of this work may be used to explore the relationships between facial expressions and physiological reactions for non-rational decision-making when interacting with new food products.

Keywords: consumer acceptance prediction; data fusion; emotion recognition; facial expression recognition; galvanic skin response; machine learning; neural networks; sensory analysis.


Conflict of interest statement

The authors declare no conflict of interest.

Figures

Figure 1
Figure 1
Sweet gum elaboration process: (a) gelatin in water, (b) sugar, water, and glucose mixture, (c) gelatin solution, color, flavor, and citric acid in the mixture, (d) bed of starch, (e) mixture in the bed of starch, and (f) resulting sweet gums.
Figure 2
Figure 2
Odor sample: (a) Soaking cotton with solution. (b) Wooden stick in container.
Figure 3
Figure 3
Booth setup.
Figure 4
Figure 4
The sensory analysis system architecture. GSR, galvanic skin response.
Figure 5
Figure 5
Schematic representation of a three-input perceptron.
Figure 6
Figure 6
Two-layer neural network architecture. For the sake of simplicity and clarity, individual weights are not shown.
Figure 7
Figure 7
Numbered facial landmarks.
Figure 8
Figure 8
Neural network architecture for the first stage.
Figure 9
Figure 9
Example of detected emotion probabilities.
Figure 10
Figure 10
Decision tree example: to predict the consumer’s evaluation, questions need to be answered from top to bottom and following the path of the answers. At the end of the path, the last node contains the prediction of the consumer’s evaluation.
Figure 11
Figure 11
Acceptance results for taste evaluations.
Figure 12
Figure 12
Acceptance results for smell evaluations.
Figure 13
Figure 13
Recognized emotions: (a) taste and (b) smell experiments.
Figure 14
Figure 14
Correlation matrix of facial emotion recognition (FER), sensor responses, and consumer acceptance: (a,c) display the correlation matrices of taste experiments, while (b,d) show the correlation matrices of smell experiments. Cells contain correlations between column and row features.
Figure 15
Figure 15
Feature importance: (a) taste and (b) smell regression models.
Figure 16
Figure 16
GSR and pulse measurements for the taste tests: (a) The participants’ GSR average values and (b) standard deviation. (c) The participants’ pulse average values and (d) standard deviation.
Figure 17
Figure 17
GSR and pulse measurements for the smell tests. (a) The participants’ GSR average values and (b) standard deviation. (c) The participants’ pulse average values and (d) standard deviation.

References

    1. Köster E.P. Diversity in the determinants of food choice: A psychological perspective. Food Q. Prefer. 2009;20:70–82. doi: 10.1016/j.foodqual.2007.11.002. - DOI
    1. Bredie W.L., Tan H.S.G., Wendin K. A comparative study on facially expressed emotions in response to basic tastes. Chemosens. Percept. 2014;7:1–9. doi: 10.1007/s12078-014-9163-6. - DOI
    1. Soodan V., Pandey A.C. Influence of emotions on consumer buying behavior: A study on FMCG purchases in Uttarakhand, India. J. Entrepreneurship Bus. Econ. 2016;4:163–181.
    1. Macht M. How emotions affect eating: A five-way model. Appetite. 2008;50:1–11. doi: 10.1016/j.appet.2007.07.002. - DOI - PubMed
    1. Evers C., Dingemans A., Junghans A., Boeve A. Feeling bad or feeling good, does emotion affect your consumption of food? A meta-analysis of the experimental evidence. Neurosci. Biobehav. Rev. 2018;92:195–208. doi: 10.1016/j.neubiorev.2018.05.028. - DOI - PubMed

LinkOut - more resources