. 2020 Jun 11;9(6):1454.
doi: 10.3390/cells9061454.

Parkin Overexpression Attenuates Sepsis-Induced Muscle Wasting

Affiliations

Parkin Overexpression Attenuates Sepsis-Induced Muscle Wasting

Jean-Philippe Leduc-Gaudet et al. Cells. .

Abstract

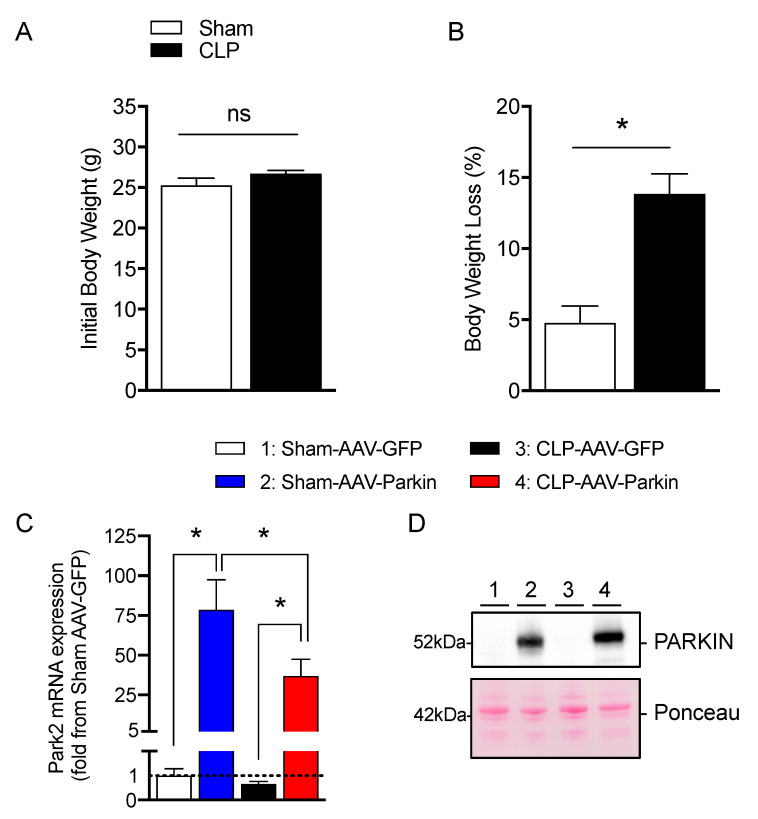
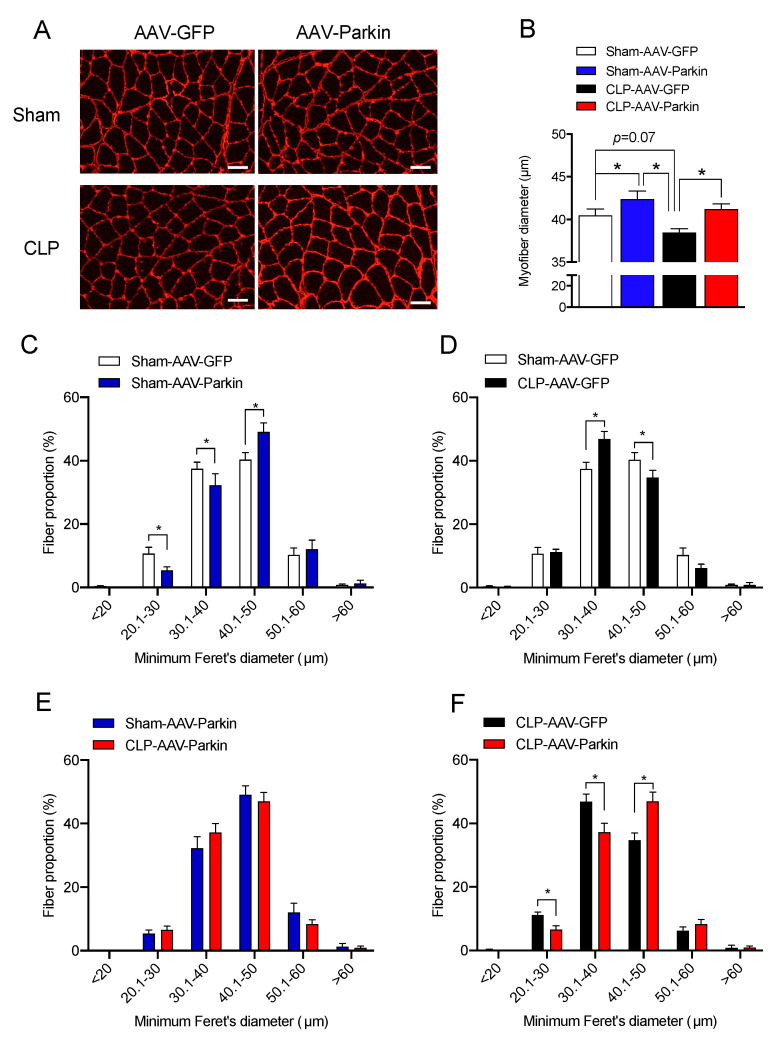
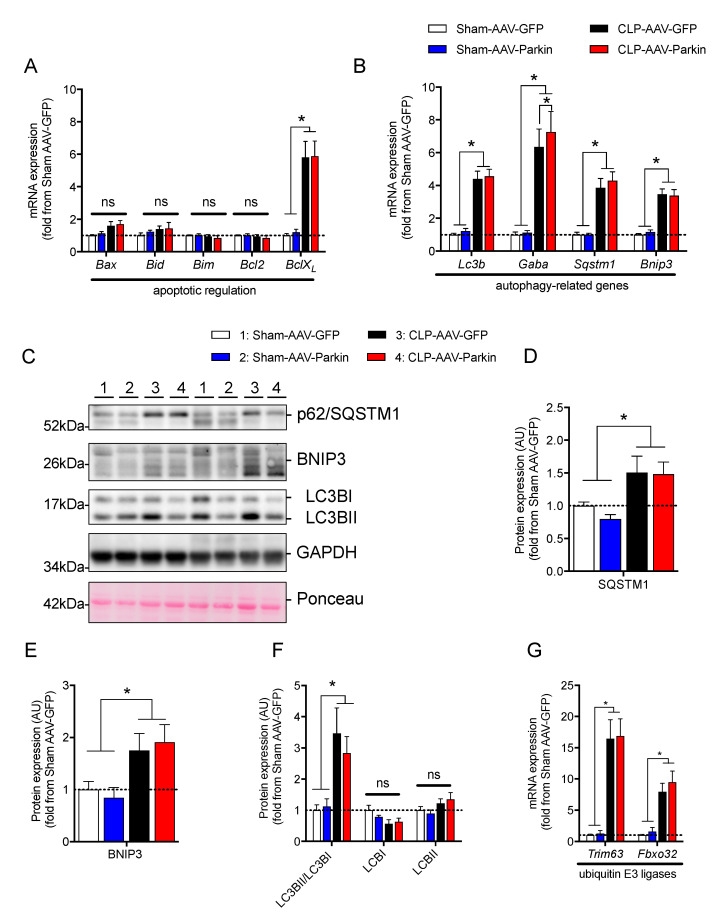
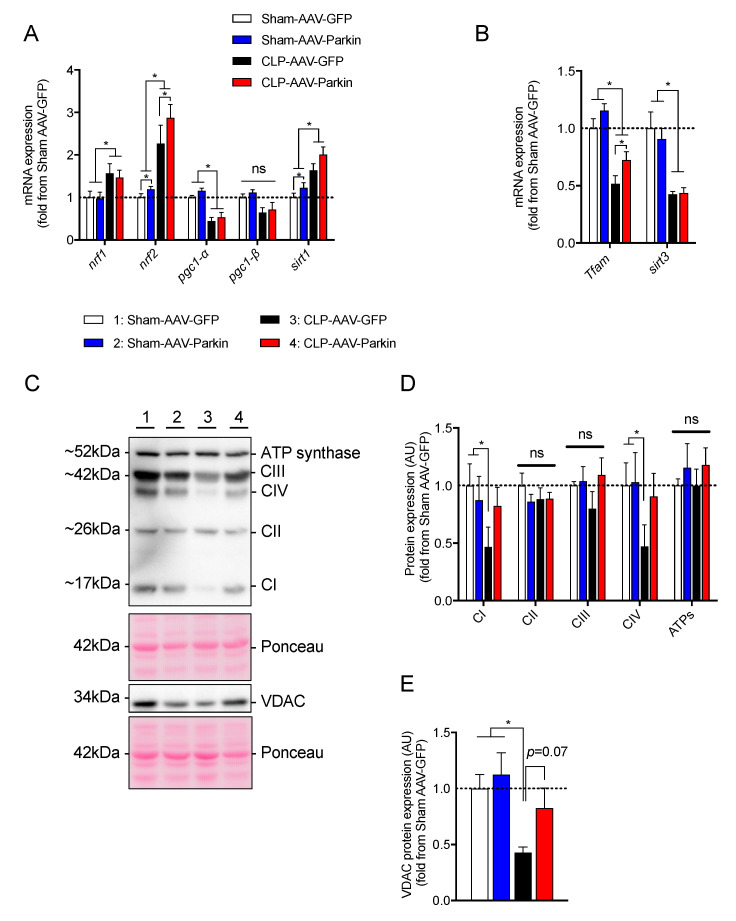
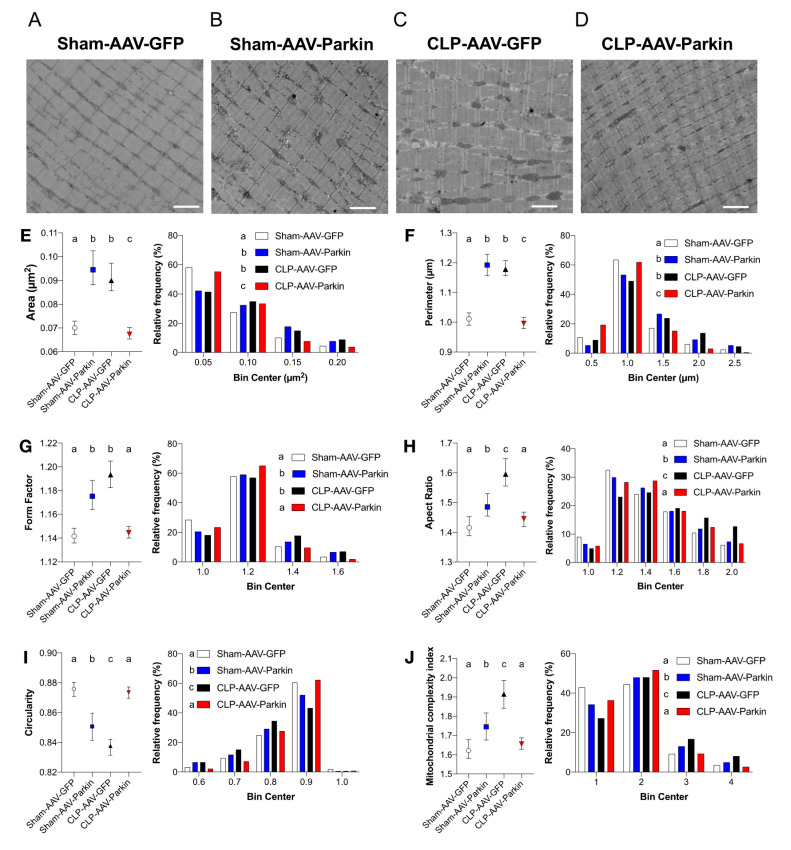
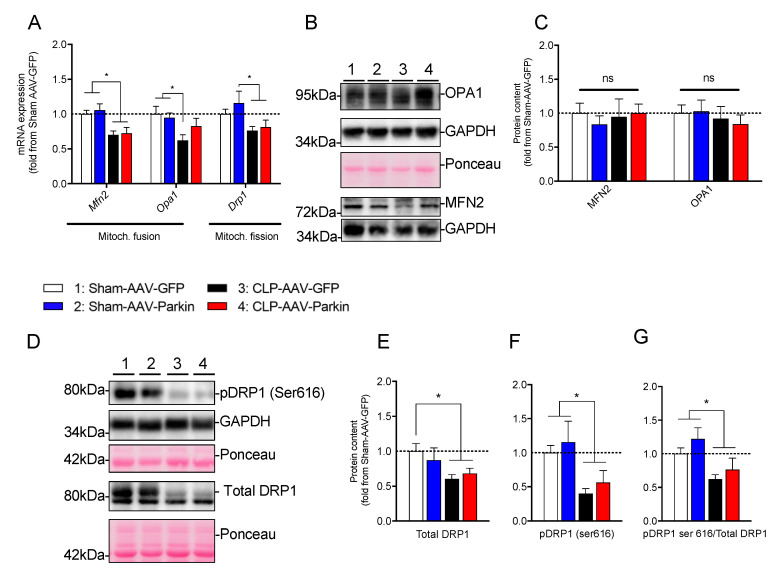
Sepsis elicits skeletal muscle weakness and fiber atrophy. The accumulation of injured mitochondria and depressed mitochondrial functions are considered as important triggers of sepsis-induced muscle atrophy. It is unclear whether mitochondrial dysfunctions in septic muscles are due to the inadequate activation of quality control processes. We hypothesized that overexpressing Parkin, a protein responsible for the recycling of dysfunctional mitochondria by the autophagy pathway (mitophagy), would confer protection against sepsis-induced muscle atrophy by improving mitochondrial quality and content. Parkin was overexpressed for four weeks in the limb muscles of four-week old mice using intramuscular injections of adeno-associated viruses (AAVs). The cecal ligation and perforation (CLP) procedure was used to induce sepsis. Sham operated animals were used as controls. All animals were studied for 48 h post CLP. Sepsis resulted in major body weight loss and myofiber atrophy. Parkin overexpression prevented myofiber atrophy in CLP mice. Quantitative two-dimensional transmission electron microscopy revealed that sepsis is associated with the accumulation of enlarged and complex mitochondria, an effect which was attenuated by Parkin overexpression. Parkin overexpression also prevented a sepsis-induced decrease in the content of mitochondrial subunits of NADH dehydrogenase and cytochrome C oxidase. We conclude that Parkin overexpression prevents sepsis-induced skeletal muscle atrophy, likely by improving mitochondrial quality and contents.

Keywords: mitochondria; mitochondrial fission; mitochondrial fusion; muscle atrophy; septicemia.


Conflict of interest statement

The authors declare no conflict of interest.

Figures

Figure 1
Figure 1
Effective Parkin overexpression in skeletal muscles of Sham and CLP operated mice. (A) Initial body weight and (B) percent of body weight loss in Sham-operated and or CLP mice. (C) qPCR analysis of Park2 expression levels in the gastrocnemius muscles injected with either AAV-GFP or AAV-Parkin in Sham and CLP mice. (D) Representative Parkin immunoblots and its corresponding ponceau S stain performed on gastrocnemius samples of Sham and CLP mice injected with either AAV-GFP or AAV-Parkin. 1 = Sham-AAV-GFP; 2 = Sham-AAV-Parkin; 3 = CLP-AAV-GFP; 4 = CLP-AAV-Parkin. Data are presented as mean ± SEM (n = 7–9/group; * = statistically significant; ns = not statistically significant).
Figure 2
Figure 2
The impact of Parkin overexpression and sepsis on skeletal muscle fiber size. (A) Representative gastrocnemius (GAS) cryosections stained for laminin in all experimental groups. Scale bar: 50µm. (B) Quantification of minimum Ferret diameter of GAS myofibers of Sham and CLP animals injected with either AAV-GFP or AAV-Parkin. (C) Minimum Ferret distribution of the GAS myofibers of Sham AAV-GFP (n = 8 mice; 316 ± 21 fibers per GAS were traced) vs. Sham AAV-Parkin (n = 8 mice; 300 ± 5 fibers per GAS were traced). (D) Minimum Ferret distribution of the GAS myofibers of Sham AAV-GFP (n = 8 mice; 316 ± 21 fibers per GAS were traced) vs. CLP AAV-GFP (n = 6 mice; 345 ± fibers per GAS were traced). (E) Minimum Ferret distribution of the GAS myofibers of Sham AAV-Parkin (n = 8 mice; 300 ± 5 fibers per GAS were traced) vs. CLP AAV-Parkin (n = 6 mice; 304 ± 18 fibers per GAS were traced). (F) Minimum Ferret distribution of the GAS myofibers of CLP AAV-GFP (n = 6 mice; 345 ± fibers per GAS were traced) vs. CLP AAV-Parkin (n = 6 mice; 304 ± 18 fibers per GAS were traced). Data are presented as mean ± SEM. (n = 6–8/group; * = statistically significant).
Figure 3
Figure 3
The impact of Parkin overexpression and sepsis on skeletal muscle catabolic signaling. (A) qPCR analysis of the mRNA expression of genes regulating apoptosis in the gastrocnemius (GAS) muscles of Sham and CLP animals injected with either AAV-GFP or AAV-Parkin. (B) qPCR analysis of autophagy-related gene expression in the gastrocnemius (GAS) muscles of Sham and CLP animals injected with either AAV-GFP or AAV-Parkin. Gaba. refers to Gabarapl1. (C) Immunoblot detection of SQSMT1(p62), BNIP3, LC3I/LC3II and GAPDH. (D) Quantification of SQSMT1 (p62) content. (E) Quantification of BNIP3 protein content. (F) Quantification of LC3I and LC3II protein content, as well as the LC3II to LC3I ratio. (G) qPCR analysis of Fbxo32 (Atrogin-1) and Trim63 (MuRF1) gene expression levels in the GAS muscles of Sham and CLP animals injected with either AAV-GFP or AAV-Parkin. 1 = Sham-AAV-GFP; 2 = Sham-AAV-Parkin; 3 = CLP-AAV-GFP; 4 = CLP-AAV-Parkin. Data are presented as mean ± SEM. (n = 6–9/group, * = statistically significant; ns = not statistically significant).
Figure 4
Figure 4
The impact of Parkin overexpression and sepsis in skeletal muscle on genes regulating mitochondrial biogenesis and on mitochondrial protein contents. (A,B) qPCR analysis of genes involved in mitochondrial biology. (C) Representative immunoblots performed with primary antibodies against representative subunits of the OXPHOS complexes and VDAC. Ponceau stains were used as loading controls. (D,E) Quantification of the contents of (D) representative subunits of the OXPHOS complexes and (E) VDAC. 1 = Sham-AAV-GFP; 2 = Sham-AAV-Parkin; 3 = CLP-AAV-GFP; 4 = CLP-AAV-Parkin. Data are presented as mean ± SEM. (n = 6–9/group, * = statistically significant; ns = not statistically significant).
Figure 5
Figure 5
The impact of sepsis and Parkin overexpression on mitochondrial morphology in skeletal muscle. (AD) Representative longitudinal TEM images from all groups that were used to assess mitochondrial morphology. Scale bar: 2µm. (EJ) Median values with 95% confidence interval (left) and relative frequencies (right) of multiple mitochondrial shape descriptors (Sham-AAV-GFP: n = 1246; Sham-AAV-Parkin: n = 728; CLP-AAV-GFP: n = 1149; CLP-AAV-Parkin: n = 1206). Groups not sharing a letter are significantly different (differences were tested using a Kruskal–Wallis test followed by a Dunn’s multiple comparisons test; p < 0.05).
Figure 6
Figure 6
The impact of sepsis and Parkin overexpression on mitochondrial dynamics in skeletal muscle. (A) qPCR analysis of mitochondrial dynamic-related gene expression in the GAS muscles of Sham and CLP animals injected with either AAV-GFP or AAV-Parkin. (B) Representative immunoblots of OPA1, GADPH and MFN2. Ponceau stains or GAPDH immunoblots were used as loading controls. (C) Quantification of OPA1, GADPH and MFN2 content. (D) Representative immunoblots performed with primary antibodies against pDRP1(ser616) and total DRP1. Ponceau stains or GAPDH immunoblots were used as loading controls. (E) Quantification of DRP1 content. (F) Quantification of the contents of pDRP1(ser 616) content. (G) Quantification of the pDRP1(ser 616) to total DRP1 ratio. 1 = Sham-AAV-GFP; 2 = Sham-AAV-Parkin; 3 = CLP-AAV-GFP; 4 = CLP-AAV-Parkin. Data are presented as mean ± SEM. (n = 6–9/group; * = statistically significant; ns = not statistically significant).

References

    1. Angus D.C., van der Poll T. Severe sepsis and septic shock. N. Engl. J. Med. 2013;369:840–851. doi: 10.1056/NEJMra1208623. - DOI - PubMed
    1. Khan J., Harrison T.B., Rich M.M., Moss M. Early development of critical illness myopathy and neuropathy in patients with severe sepsis. Neurology. 2006;67:1421–1425. doi: 10.1212/01.wnl.0000239826.63523.8e. - DOI - PubMed
    1. Tennila A., Salmi T., Pettila V., Roine R.O., Varpula T., Takkunen O. Early signs of critical illness polyneuropathy in icu patients with systemic inflammatory response syndrome or sepsis. Intensive Care Med. 2000;26:1360–1363. doi: 10.1007/s001340000586. - DOI - PubMed
    1. Supinski G.S., Callahan L.A. Diaphragm weakness in mechanically ventilated critically ill patients. Crit. Care. 2013;17:R120. doi: 10.1186/cc12792. - DOI - PMC - PubMed
    1. De Jonghe B., Bastuji-Garin S., Durand M.C., Malissin I., Rodrigues P., Cerf C., Outin H., Sharshar T. Respiratory weakness is associated with limb weakness and delayed weaning in critical illness. Crit. Care Med. 2007;35:2007–2015. doi: 10.1097/01.ccm.0000281450.01881.d8. - DOI - PubMed

Publication types