

Artificial Neural Network Modeling of Novel Coronavirus (COVID-19) Incidence Rates across the Continental United States
- PMID: 32545581
- PMCID: PMC7344609
- DOI: 10.3390/ijerph17124204
Artificial Neural Network Modeling of Novel Coronavirus (COVID-19) Incidence Rates across the Continental United States
Abstract
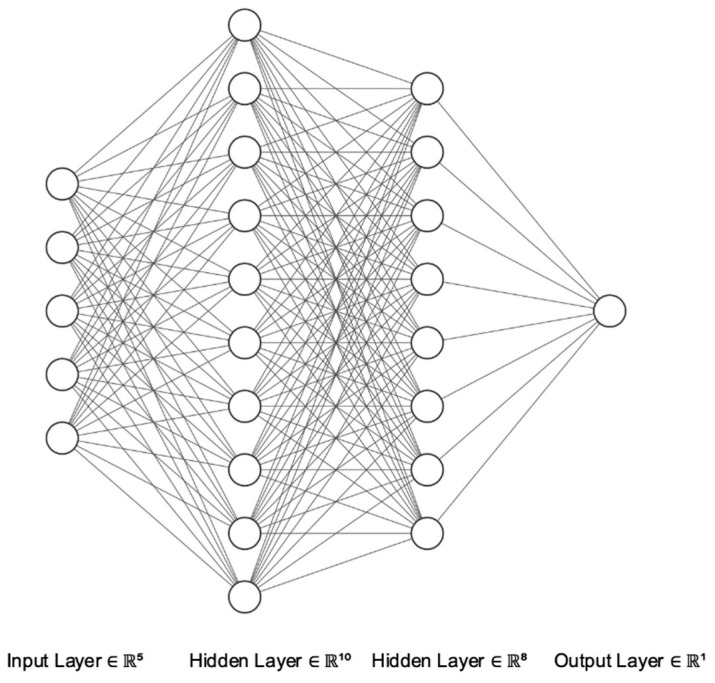
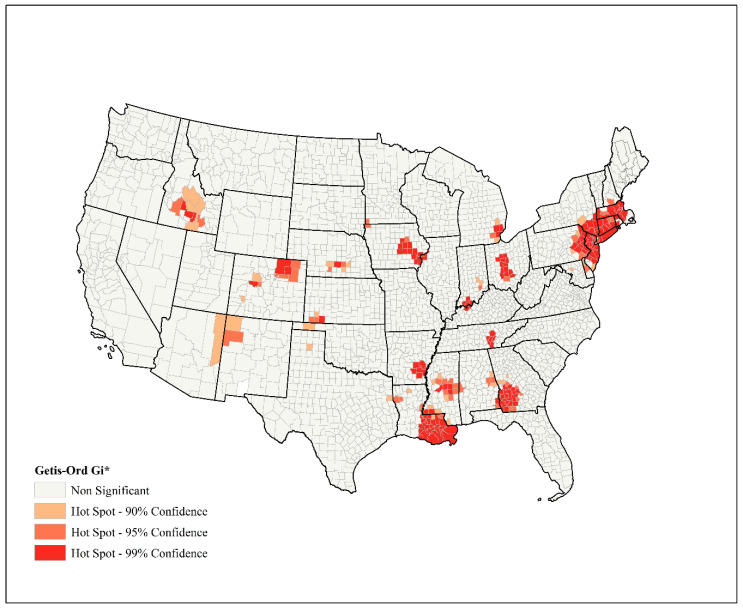
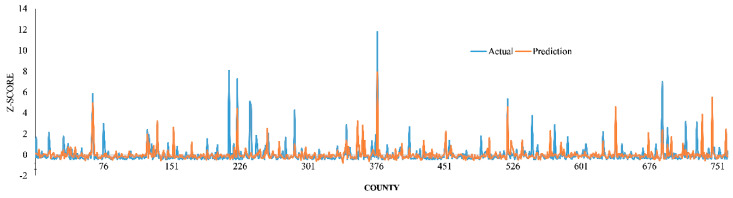
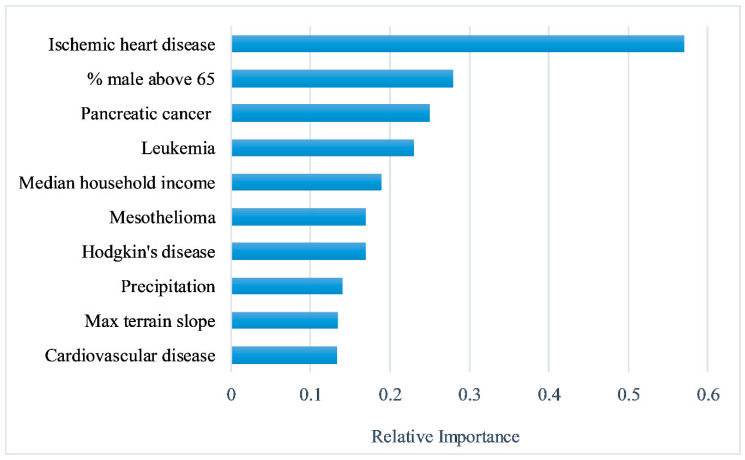
Prediction of the COVID-19 incidence rate is a matter of global importance, particularly in the United States. As of 4 June 2020, more than 1.8 million confirmed cases and over 108 thousand deaths have been reported in this country. Few studies have examined nationwide modeling of COVID-19 incidence in the United States particularly using machine-learning algorithms. Thus, we collected and prepared a database of 57 candidate explanatory variables to examine the performance of multilayer perceptron (MLP) neural network in predicting the cumulative COVID-19 incidence rates across the continental United States. Our results indicated that a single-hidden-layer MLP could explain almost 65% of the correlation with ground truth for the holdout samples. Sensitivity analysis conducted on this model showed that the age-adjusted mortality rates of ischemic heart disease, pancreatic cancer, and leukemia, together with two socioeconomic and environmental factors (median household income and total precipitation), are among the most substantial factors for predicting COVID-19 incidence rates. Moreover, results of the logistic regression model indicated that these variables could explain the presence/absence of the hotspots of disease incidence that were identified by Getis-Ord Gi* (p < 0.05) in a geographic information system environment. The findings may provide useful insights for public health decision makers regarding the influence of potential risk factors associated with the COVID-19 incidence at the county level.
Keywords: COVID-19 (Coronavirus); GIS; United States; artificial neural networks; multilayer perceptron.
Conflict of interest statement
The authors declare no conflict of interest.
Figures
References
-
- World Health Organization WHO Timeline—COVID-19. [(accessed on 15 May 2020)]; Available online: https://www.who.int/news-room/detail/27-04-2020-who-timeline---covid-19.
-
- World Health Organization WHO Coronavirus Disease (COVID-19) Dashboard. [(accessed on 4 June 2020)]; Available online: https://covid19.who.int.
-
- National Institutes of Health COVID-19, MERS & SARS. [(accessed on 15 May 2020)]; Available online: https://www.niaid.nih.gov/diseases-conditions/covid-19.
-
- International Monetary Fund (IMF) World Economic Outlook Chapter 1: The Great Lockdown. [(accessed on 15 May 2020)]; Available online: https://www.imf.org/en/Publications.
MeSH terms
LinkOut - more resources
Full Text Sources
