. 2020 Jun 12;10(6):898.
doi: 10.3390/biom10060898.

Transcriptomically Revealed Oligo-Fucoidan Enhances the Immune System and Protects Hepatocytes via the ASGPR/STAT3/HNF4A Axis

Affiliations

Transcriptomically Revealed Oligo-Fucoidan Enhances the Immune System and Protects Hepatocytes via the ASGPR/STAT3/HNF4A Axis

Chun-Chia Cheng et al. Biomolecules. .

Abstract

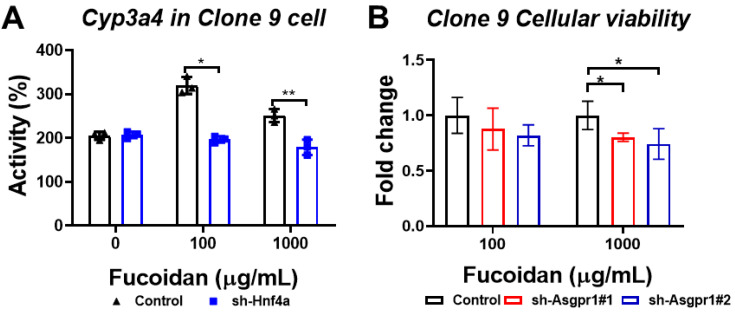
Oligo-fucoidan, a sulfated polysaccharide extracted from brown seaweed, exhibits anti-inflammatory and anti-tumor effects. However, the knowledge concerning the detailed mechanism of oligo-fucoidan on liver cells is obscure. In this study, we investigate the effect of oligo-fucoidan in normal hepatocytes by transcriptomic analysis. Using an oligo-fucoidan oral gavage in wild-type adult zebrafish, we find that oligo-fucoidan pretreatment enhances the immune system and anti-viral genes in hepatocytes. Oligo-fucoidan pretreatment also decreases the expression of lipogenic enzymes and liver fibrosis genes. Using pathway analysis, we identify hepatocyte nuclear factor 4 alpha (HNF4A) to be the potential driver gene. We further investigate whether hepatocyte nuclear factor 4 alpha (HNF4A) could be induced by oligo-fucoidan and the underlying mechanism. Therefore, a normal hepatocyte clone 9 cell as an in vitro model was used. We demonstrate that oligo-fucoidan increases cell viability, Cyp3a4 activity, and Hnf4a expression in clone 9 cells. We further demonstrate that oligo-fucoidan might bind to asialoglycoprotein receptors (ASGPR) in normal hepatocytes through both in vitro and in vivo competition assays. This binding, consequently activating the signal transducer and activator of transcription 3 (STAT3), increases the expression of the P1 isoform of HNF4A. According to our data, we suggest that oligo-fucoidan not only enhances the gene expression associated with anti-viral ability and immunity, but also increases P1-HNF4A levels through ASGPR/STAT3 axis, resulting in protecting hepatocytes.

Keywords: hepatocyte; hepatocyte nuclear factor 4 alpha (HNF4A); oligo-fucoidan.


Conflict of interest statement

Hi-Q Marine Biotech International Ltd. provided the oligo-fucoidan. The funders had no role in the design of the study; in the collection, analyses, or interpretation of data; in the writing of the manuscript, or in the decision to publish the results.

Figures

Figure 1
Figure 1
Upregulation of immune system development-associated genes, such as an anti-viral gatekeeper for mxf as well as host defense multiple microbial, hamp, in oligo-fucoidan (OF)-fed wild-type zebrafish. (A) Venn diagram of the upregulated genes from two batches of experiment between OF-fed and control fish; (B) Gene ontology analysis revealed genes involved in immune system development, hematopoietic or lymphoid development, and hematopoiesis were enriched. (C) The selected genes that are upregulated by OF from the microarray analysis.
Figure 2
Figure 2
Downregulation of fatty acid metabolism, the peroxisome proliferator-activated receptors (PPAR) signaling pathway, and steroid biosynthesis-associated genes in OF-fed wild-type zebrafish. (A) Venn diagram of the downregulated genes from two batches of experiment between OF-fed and control fish. (B) Kyoto Encyclopedia of Genes and Genomes (KEGG) pathway analysis revealed that the genes involved in fatty acid metabolism were enriched. (C) The selected genes that are downregulated by OF from the microarray analysis.
Figure 3
Figure 3
Microarray versus qPCR validation for three upregulated genes in OF-fed and control zebrafish. (AC) The fold changes of oligo-fucoidan fed wild-type (WT+OF) zebrafish versus the no-treatment control (WT), where each dot represents the average of two fish from the same batch. (DF) Quantitative polymerase chain reaction (qPCR) analyses for the same samples that were used in microarray, where each dot represents average of two fish from the same batch. (GI) Quantitative polymerase chain reaction (qPCR) analyses for the all OF-fed wild-type fish (red) versus the untreated controls (black), where each dot represents one fish. Statistical analyses were performed with Student’s t-test (*0.01 < p ≤ 0.05; **0.001 < p ≤ 0.01; *** ≤ 0.001, ns: non-significance).
Figure 4
Figure 4
Microarray versus qPCR validation for five downregulated genes (fasn, scd, loxl2a, foxo3b and soat1) in OF-fed and control zebrafish. (AE) The fold changes of OF-fed wild-type zebrafish versus the no treatment controls, where each dot represents the average of two fish. (GK) qPCR for the same samples that were used in the microarray, where each dot represents the average of two fish. (LP) qPCR analyses for all OF-fed fish (red) versus untreated controls (black), where each dot represents one fish. Statistical analyses were performed with student’s t-test (* 0.01 < p ≤ 0.05; ** 0.001 < p ≤ 0.01; *** 0.0001 < p ≤ 0.001; **** p ≤ 0.0001).
Figure 5
Figure 5
Oligo-fucoidan (OF) enhanced the viability and increased the Cyp3a4 activity in normal liver Clone 9 cells. (A) Oligo-fucoidan enhanced the viability of normal liver cells. The black color indicated control cells without oligo-fucoidan treatment, the blue color denoted oligo-fucoidan treatment at different concentration. The cellular viability was measured by WST-1 assay, and the cell viability (%) was compared to control cells. (B) Cyp3a4 activity in Clone 9 cells was increased by treatment with oligo-fucoidan. The black color indicated control cells without oligo-fucoidan treatment, while the blue color denoted oligo-fucoidan treatment at different concentrations. The Cyp3a4 activities of the oligo-fucoidan-treated cells or control cells were measured by a CYP3A4 activity assay Kit assay, and the activity (%) was compared to the average of activity of the control cells. (C) The mRNA expression level of Hnf4a was increased by treatment with oligo-fucoidan. The black color indicated control cells without oligo-fucoidan treatment, while the blue color denoted oligo-fucoidan treatment at different concentrations. The expression of Hnf4a was measured by qPCR, and the fold changes were compared to control cells. *0.01 < p ≤ 0.05; **p ≤ 0.01.
Figure 6
Figure 6
In vitro and in vivo competition assays demonstrated that oligo-fucoidan binds to C-type lectin-like receptor 2 (CLEC-2)–asialoglycoprotein receptors (ASGPR)1/2 in hepatocytes. (A) Flow cytometry profiles of Clone 9 cells. The black line histogram represents isotype control, the blue indicates cells stained by asialofetuin–fluorescein isothiocyanate (ASF-FITC), and the red line denotes cells treated with OF and stained by asialofetuin–FITC (ASF-FITC). (B) The mean fluorescence intensity (MFI) profiles of Clone 9 cells with or without OF treatment in the flow cytometry analysis. The black color represents isotype control, blue indicates cells with asialofetuin–FITC (ASF-FITC), and the red line denotes cells treated with OF and asialofetuin–FITC (ASF-FITC). (C) 68Ga-NOTA-hexavalent lactoside (HL) positron emission tomography (PET) imaging of the murine livers demonstrates the in vivo ASGPR binding image in vivo. Phosphate-buffered saline (PBS) and OF (100 mg) were administrated through an intravenous injection with 68Ga-NOTA-HL (68Ga-2,2’,2’’-(1,4,7-triazonane-1,4,7-triyl) triacetic acid-hexavalent lactoside) injection (N = 3/group) simultaneously. (D) The relative radioactive intensity of 68Ga-NOTA-HL in vivo between the PBS and OF-injected groups. The bars indicate the mean ± SD, where the black bar represents the PBS group and the red bar indicates the OF treatment group. The radioactivity (%) was compared to PBS (no fucoidan treatment) group. Statistical significance was calculated by Student’s t-test (*p ≤ 0.05; **p ≤ 0.01; ***p ≤ 0.001; ****p ≤ 0.0001).
Figure 7
Figure 7
OF enhanced the phosphorylation of signal transducer and activator of transcription 3 (pSTAT3) and increased hepatocyte nuclear factor 4 alpha (Hnf4a) protein levels. (A) Immunoblotting of pSTAT3, STAT3, and Hnf4a of Clone 9 cells treated with oligo-fucoidan (100 µg/ml) for 0, 15, 30, and 120 min. GAPDH was used as internal control. (B) Statistical analysis of pSTAT3 staining in three batches of oligo-fucoidan-treated Clone 9 cells. The back color indicated no treatment control, while the blue color denoted oligo-fucoidan treatment for 15, 30, or 120 min as indicated at the X-axis. The pSTAT3 intensity was quantified from Western blotting, and the fold changes were compared to control cells (0 min group). (C) Statistical analysis of Hnf4a levels in three batches of oligo-fucoidan-treated Clone 9 cells. The back color indicated no treatment control, the blue color denoted oligo-fucoidan treatment for 15, 30, or 120 min, as indicated at the X-axis. The Hnf4a level was quantified from Western blotting, and the fold changes were compared to control cells (0 min group). Statistical significance was calculated by Student’s t-test (*p ≤ 0.05; **p ≤ 0.01).
Figure 8
Figure 8
Regulations of P1-Hnf4a and Asgpr1/2 expression in normal hepatocytes by oligo-fucoidan (OF) and carcinogen (thioacetamide, TAA). (A) Expression profiles of the P1 and P2 isoforms of Hnf4a after being treated with different concentrations of OF in Clone 9 hepatocytes. The black color indicated control cells without oligo-fucoidan treatment, the red color denoted oligo-fucoidan at 10 µg/mL, and blue color represented the oligo-fucoidan at 100 µg/mL concentration. The expression of P1-Hnf4a or P2-Hnf4a (indicated below the bar) was measured by qPCR, and the fold changes were compared to control cells. (B) Gene expression profiles of ASGPR1/2 after different concentrations of OF in Clone 9 hepatocytes. The black color indicated control cells without oligo-fucoidan treatment, the red color denoted oligo-fucoidan at 10 µg/mL, and the blue color represented the oligo-fucoidan at 100 µg/mL concentration. The expression of Asgpr1 or Asgpr2 (indicated below the bar) was measured by qPCR, and the fold change was compared to control cells. (C) Expression profiles of the P1 and P2 isoforms of Hnf4a after being treated with different concentrations of thioacetamide (TAA) in clone 9 hepatocytes. The black color indicated control cells without oligo-fucoidan treatment, the red color denoted TAA at 2 µg/mL, and blue color represented the oligo-fucoidan at 20 µg/mL concentration. The expression of P1-Hnf4a or P2-Hnf4a (indicated below the bar) were measured by qPCR, and the fold changes were compared to control cells. (D) Gene expression profiles of Asgpr1/2 after different concentrations of TAA in Clone 9 hepatocytes. The black color indicated control cells without oligo-fucoidan treatment, the red color denoted TAA at 2 µg/mL, and the blue color represented the TAA at 20 µg/mL concentration. The expression of Asgpr1 or Asgpr2 (indicated below the bar) was measured by qPCR, and the fold changes were compared to control cells. Statistical significance was calculated by t-test (*p ≤ 0.05; **p ≤ 0.01).
Figure 9
Figure 9
STAT3 regulated Hnf4a expression in Clone 9 cells. (A) STAT3 inhibitor (BBI608) decreased the viability of normal liver cells. The black color indicated control cells without STAT3 inhibitor treatment, the red color denoted BBI608 treatment at different concentrations. The cellular viability was measured by WST-1 assay, and the cell viability (%) was compared to control cells. (B) Cyp3a4 activity in Clone 9 cells was decreased by treatment with a STAT3 inhibitor (BBI608). The black color indicated control cells without STAT3 inhibitor treatment, and the red color denoted BBI608 treatment at different concentration. The Cyp3a4 activities of the STAT3 inhibitor-treated cells or control cells were measured by CYP3A4 Activity Assay Kit assay, and the activity (%) was compared to the average of activity of the control cells. (C) The mRNA expression level of Hnf4a was decreased by treatment with a STAT3 inhibitor (BBI608). The black color indicated control cells without STAT3 inhibitor treatment, and the red color denoted BBI608 treatment at 0.1 µg/ml. The expression of Hnf4a was measured by qPCR, and the fold changes were compared to control cells. Statistical significance was calculated by Student’s t-test (*0.01 < p ≤ 0.05; **0.001 < p ≤ 0.01; ***0.0001 < p ≤ 0.001; ****p ≤ 0.0001).
Figure 10
Figure 10
Knockdown of Hnf4a and Asgpr1 in Clone 9 cells neutralized the OF-promoting effects in both Cyp3a4 activity and the cellular viability of normal liver cells. (A) Knockdown of Hnf4a abolished the fucoidan-mediated enhancement of Cyp3a4 activity. The blue color indicated sh-Hnf4a transfected cells, and the black color denoted the control transfected cells. The Cyp3a4 activities of the sh-Hnf4a knockdown or control cells were measured by CYP3A4 Activity Assay Kit. (B) The knockdown of Asgpr1 abolished the fucoidan-mediated enhancement of cellular viability in normal liver cells. The red color indicated first short hairpin RNA (shRNA) against Asgpr1-transfected cells, and the blue color denoted the second sh-RNA against Asgpr1-transfected cells, and the black color showed the control-transfected cells. The cellular viability was determined using WST-1 assay, and the fold changes were compared to control cells. Statistical significance was calculated by Student’s t-test (*p ≤ 0.05; **p ≤ 0.01).

References

    1. Henderson J.M., Polak N., Chen J., Roediger B., Weninger W., Kench J.G., McCaughan G.W., Zhang H.E., Gorrell M.D. Multiple liver insults synergize to accelerate experimental hepatocellular carcinoma. Sci. Rep. 2018;8:10283. doi: 10.1038/s41598-018-28486-8. - DOI - PMC - PubMed
    1. Fu J., Wang H. Precision diagnosis and treatment of liver cancer in China. Cancer Lett. 2018;412:283–288. doi: 10.1016/j.canlet.2017.10.008. - DOI - PubMed
    1. Hsu H.-Y., Hwang P.-A. Clinical applications of fucoidan in translational medicine for adjuvant cancer therapy. Clin. Transl. Med. 2019;8:15. doi: 10.1186/s40169-019-0234-9. - DOI - PMC - PubMed
    1. Guo C., Li J., Chen K., Li S., Feng J., Liu T., Wang F., Zhang R., Xu S., Zhou Y., et al. Protective effect of fucoidan from Fucus vesiculosus on liver fibrosis via the TGF-β1/Smad pathway-mediated inhibition of extracellular matrix and autophagy. Drug Des. Dev. Ther. 2016;10:619–630. doi: 10.2147/DDDT.S98740. - DOI - PMC - PubMed
    1. Hayashi S., Itoh A., Isoda K., Kondoh M., Kawase M., Yagi K. Fucoidan partly prevents CCl4-induced liver fibrosis. Eur. J. Pharmacol. 2007;580:380–384. doi: 10.1016/j.ejphar.2007.11.015. - DOI - PMC - PubMed

Publication types

MeSH terms