. 2020 Jun 14;9(6):748.
doi: 10.3390/plants9060748.

The Complete Chloroplast Genome Sequencing and Comparative Analysis of Reed Canary Grass (Phalaris arundinacea) and Hardinggrass (P. aquatica)

Affiliations

The Complete Chloroplast Genome Sequencing and Comparative Analysis of Reed Canary Grass (Phalaris arundinacea) and Hardinggrass (P. aquatica)

Yi Xiong et al. Plants (Basel). .

Abstract

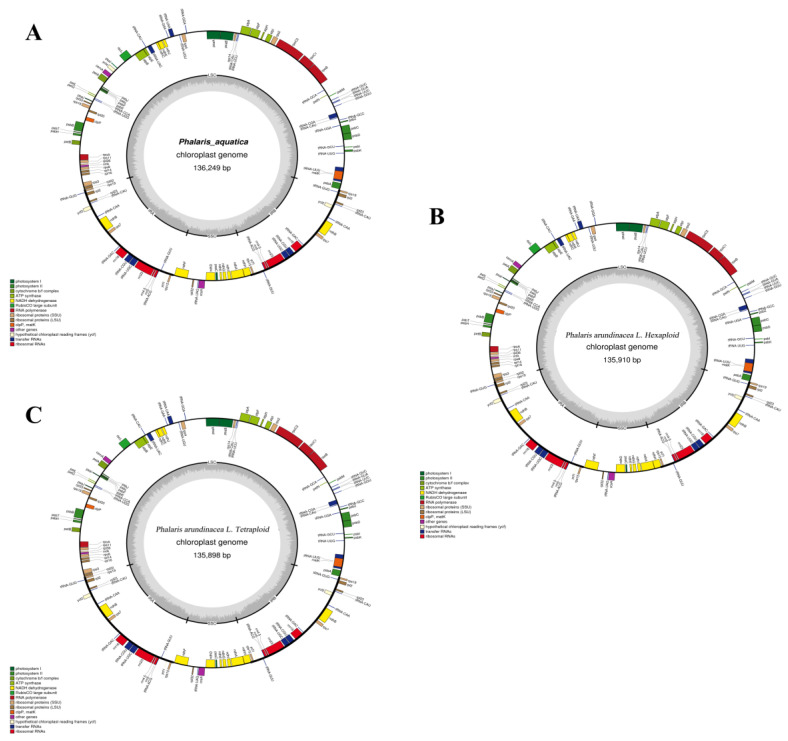
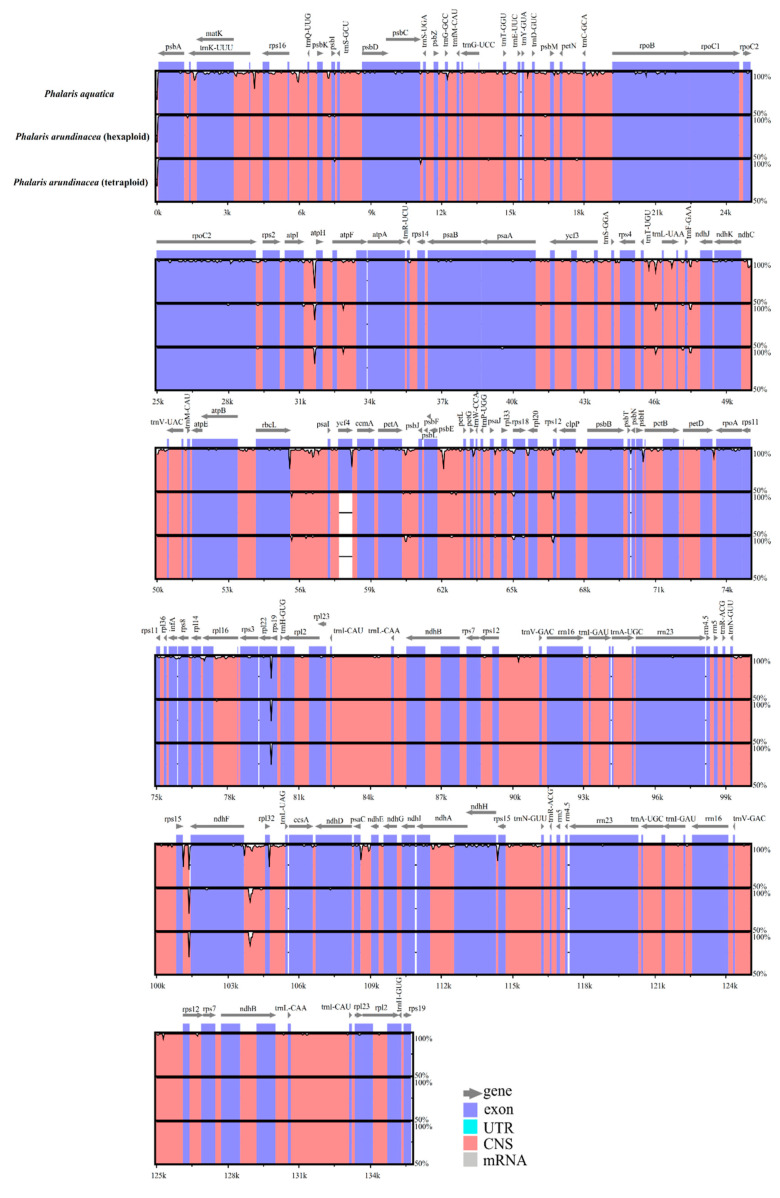
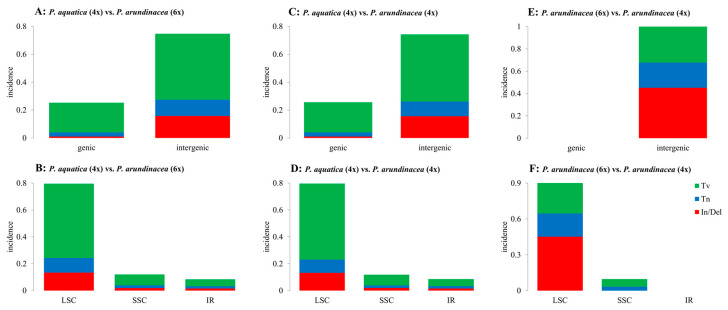
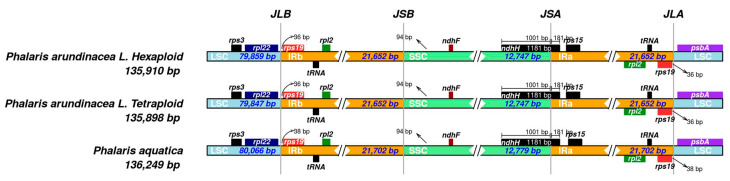
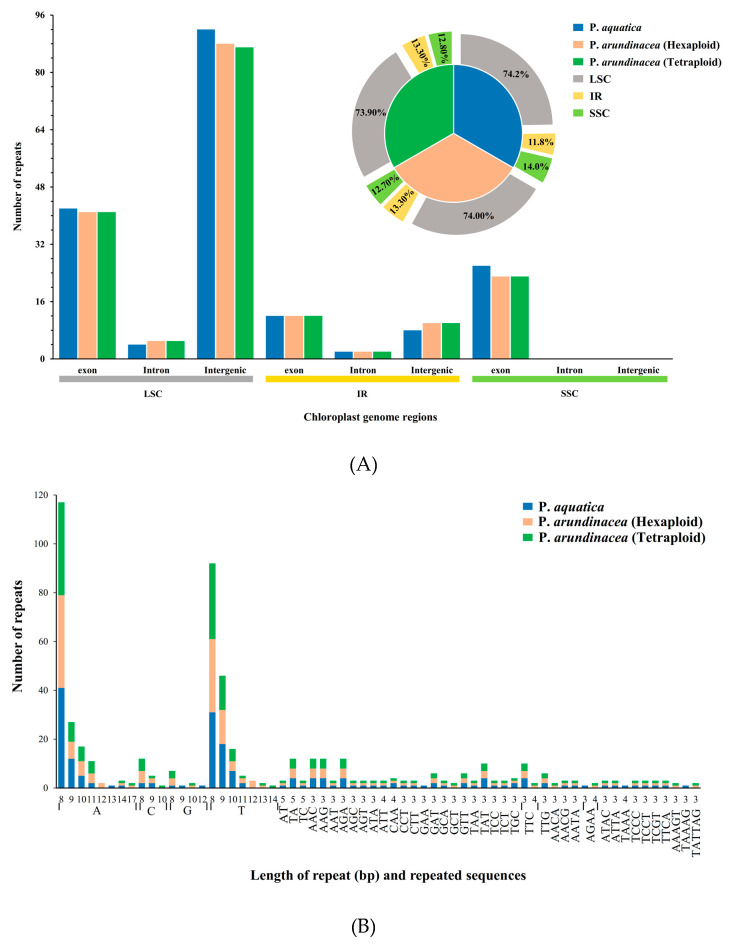
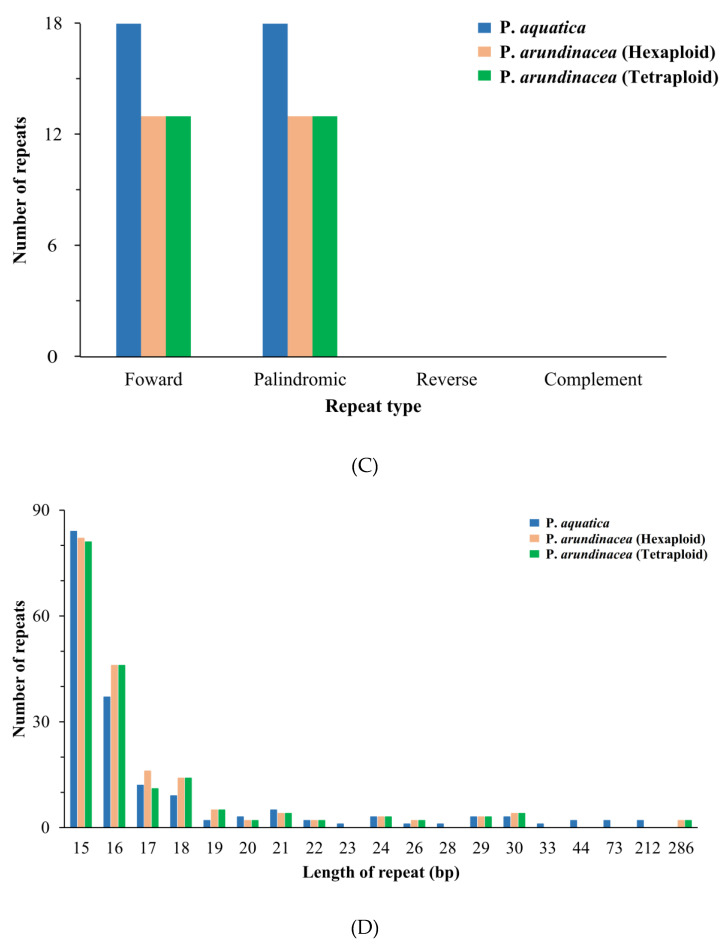
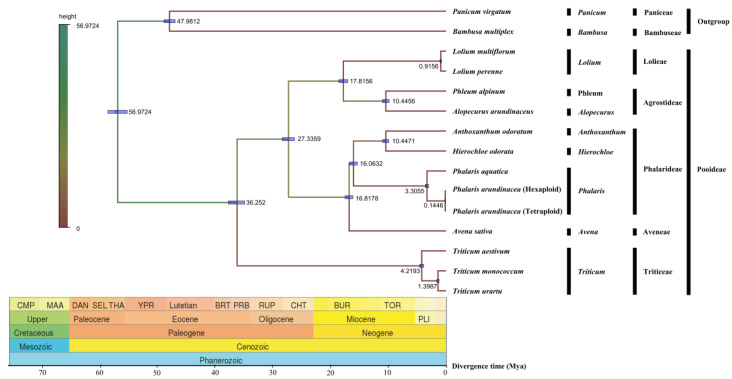
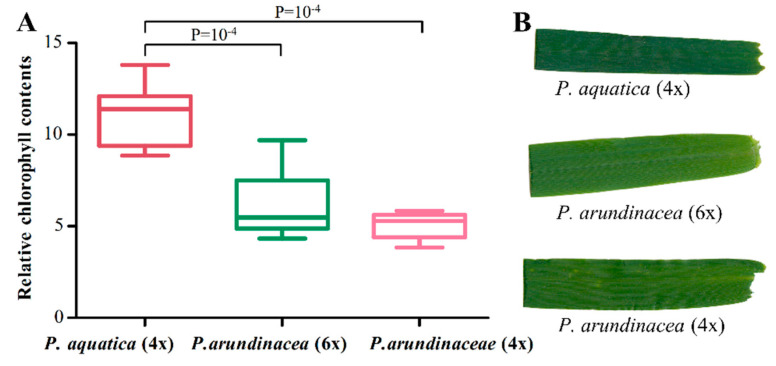
There are 22 species in the Phalaris genera that distribute almost all over the temperate regions of the world. Among them, reed canary grass (Phalaris arundinacea, tetraploid and hexaploid) and hardinggrass (P. aquatica, tetraploid) have been long cultivated as forage grass and have received attention as bio-energy materials in recent years. We aimed to facilitate inter-species/ploidies comparisons, and to illuminate the degree of sequence variation within existing gene pools, chloroplast (cp) genomes of three Phalaris cytotypes (P. aquatica/4x, P. arundinacea/4x and P. arundinacea/6x) were sequenced and assembled. The result indicated that certain sequence variations existed between the cp genomes of P. arundinacea and P. aquatica. Several hotspot regions (atpI~atpH, trnT-UGU~ndhJ, rbcL~psaI, and ndhF~rpl32) were found, and variable genes (infA, psaI, psbK, etc.) were detected. SNPs (single nucleotide polymorphisms) and/or indels (insertions and deletions) were confirmed by the high Ka/Ks and Pi value. Furthermore, distribution and presence of cp simple sequence repeats (cpSSRs) were identified in the three Phalaris cp genomes, although little difference was found between hexaploid and tetraploid P. arundinacea, and no rearrangement was detected among the three Phalaris cp genomes. The evolutionary relationship and divergent time among these species were discussed. The RNA-seq revealed several differentially expressed genes (DEGs), among which psaA, psaB, and psbB related to leaf color were further verified by leaf color differences.

Keywords: Phalaris aquatica L.; Phalaris arundinacea L.; RNA-seq; chloroplast genome; high-throughput sequencing; ploidy.


Conflict of interest statement

The authors declare that they have no competing interest.

Figures

Figure 1
Figure 1
Gene maps of the Phalaris chloroplast genomes. Genes inside and outside of the circle are transcribed in clockwise and counterclockwise directions, respectively. The GC content and adenylate and thymine (AT) content are shown in dark gray and light gray, respectively. (A) P. aquatica; (B) hexaploid P. arundinacea; (C) tetraploid P. arundinacea.
Figure 2
Figure 2
Alignment of the Phalaris chloroplast genome sequences. Exon, untranslated region (UTR), conserved noncoding sequences (CNS), and mRNA were color-marked. The x-axis and horizontal bars represent the coordinate and sequences similarity in the chloroplast genome, and the peaks indicate hotspot regions.
Figure 3
Figure 3
Summary of single nucleotide polymorphisms (SNPs) and indels. Tv, transversion; Tn, transition; In/Del, insertion and deletion; LSC, large single-copy region; SSC, small single-copy region; IR, inverted repeat region; (A,B), (C,D), and (E,F) reflect differences between P. aquatica (4x) vs. P. arundinacea (6x), P. aquatica (4x) vs. P. arundinacea (4x), and P. arundinacea (6x) vs. P. arundinacea (4x), respectively.
Figure 4
Figure 4
IRscope analysis of the three Phalaris cp genomes. JLB, junction of LSC and IRB region; JSB, junction of SSC and IRB region; JSA, junction of SSC and IRA region; JLA, junction of LSC and IRA region.
Figure 5
Figure 5
Simple sequence repeats (SSRs) and repeated sequences in the three Phalaris cp genomes. (A), SSRs in the different region of Phalaris cp genome; (B), motifs in the cp genome of Phalaris; (C), frequency of repeat types; (D), frequency of repeats length.
Figure 5
Figure 5
Simple sequence repeats (SSRs) and repeated sequences in the three Phalaris cp genomes. (A), SSRs in the different region of Phalaris cp genome; (B), motifs in the cp genome of Phalaris; (C), frequency of repeat types; (D), frequency of repeats length.
Figure 6
Figure 6
Divergence time among fifteen chloroplast genomes of seven tribes. Node values of the tree represent the average divergence time and blue bars of every node represent 95% credible interval.
Figure 7
Figure 7
Comparison of the relative chlorophyll content of the leaves (A) and the leave color (B) of three Phalaris cultivars.

Similar articles

Cited by

References

    1. Ravi V., Khurana J.P., Tyagi A.K., Khurana P. An update on chloroplast genomes. Plant Syst. Evol. 2008;271:101–122. doi: 10.1007/s00606-007-0608-0. - DOI
    1. Allen F.J. The function of genomes in bioenergetic organelles. Philos. Trans. R. Soc. B. 2003;358:19–38. doi: 10.1098/rstb.2002.1191. - DOI - PMC - PubMed
    1. Liu L.X., Wang Y.W., He P.Z., Li P., Fu C.X. Chloroplast genome analyses and genomic resource development for epilithic sister genera Oresitrophe and Mukdenia (Saxifragaceae), using genome skimming data. BMC Genom. 2018;19:235. doi: 10.1186/s12864-018-4633-x. - DOI - PMC - PubMed
    1. Daniell H., Lin C.S., Yu M., Chang W.J. Chloroplast genomes: Diversity, evolution, and applications in genetic engineering. Genome Biol. 2016;17:134. doi: 10.1186/s13059-016-1004-2. - DOI - PMC - PubMed
    1. Miller J.T., Bayer R.J. Molecular phylogenetics of Acacia (Fabaceae: Mimosoideae) based on the chloroplast MATK coding sequence and flanking TRNK intron spacer regions. Am. J. Bot. 2001;88:697–705. doi: 10.2307/2657071. - DOI - PubMed