Comparative Study
. 2020 Jun 14;21(12):4236.
doi: 10.3390/ijms21124236.

Differential Urinary Proteome Analysis for Predicting Prognosis in Type 2 Diabetes Patients with and without Renal Dysfunction

Affiliations
Comparative Study

Differential Urinary Proteome Analysis for Predicting Prognosis in Type 2 Diabetes Patients with and without Renal Dysfunction

Hee-Sung Ahn et al. Int J Mol Sci. .

Abstract

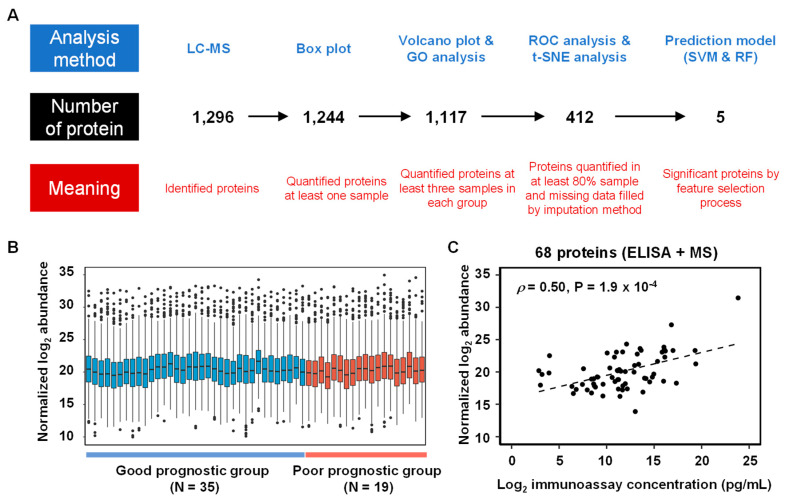
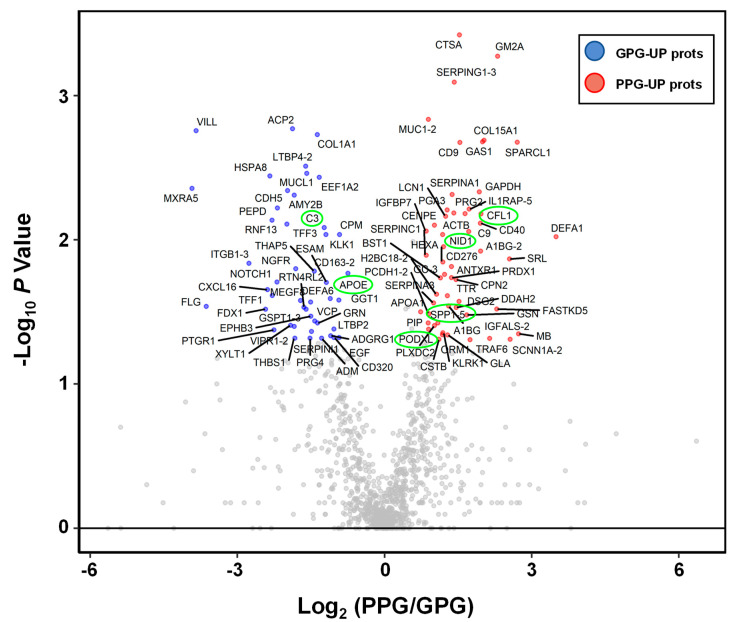
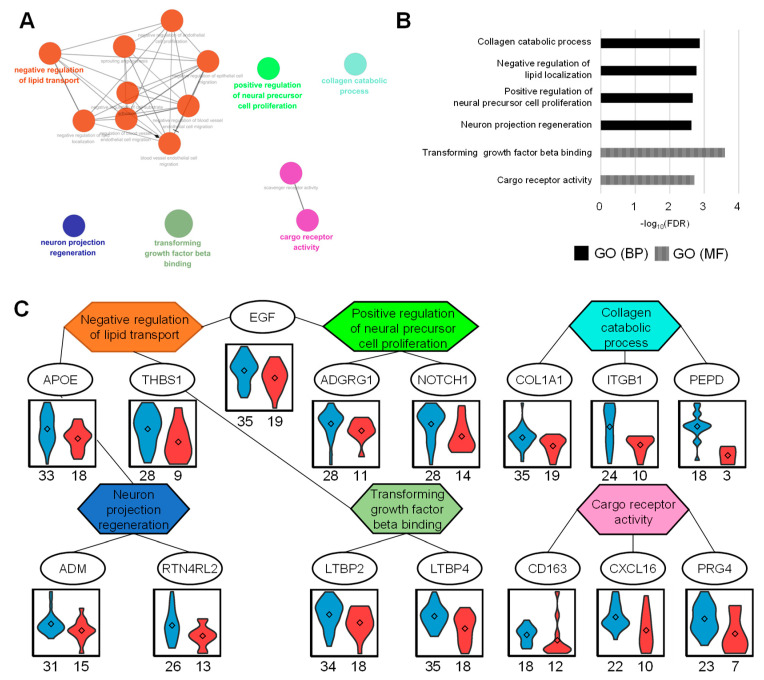
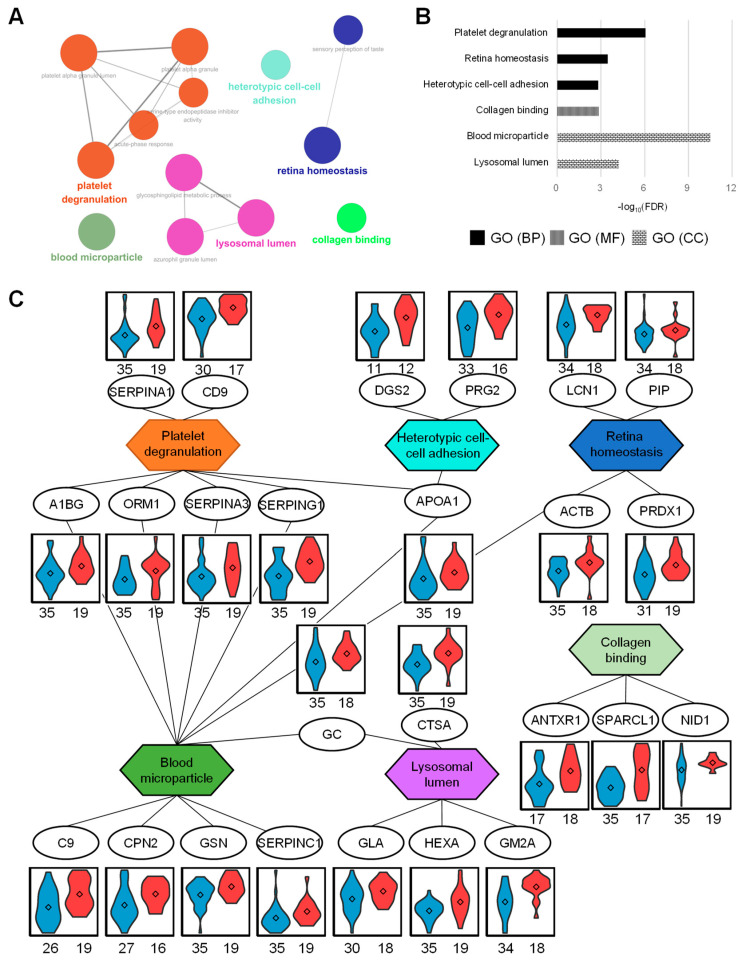
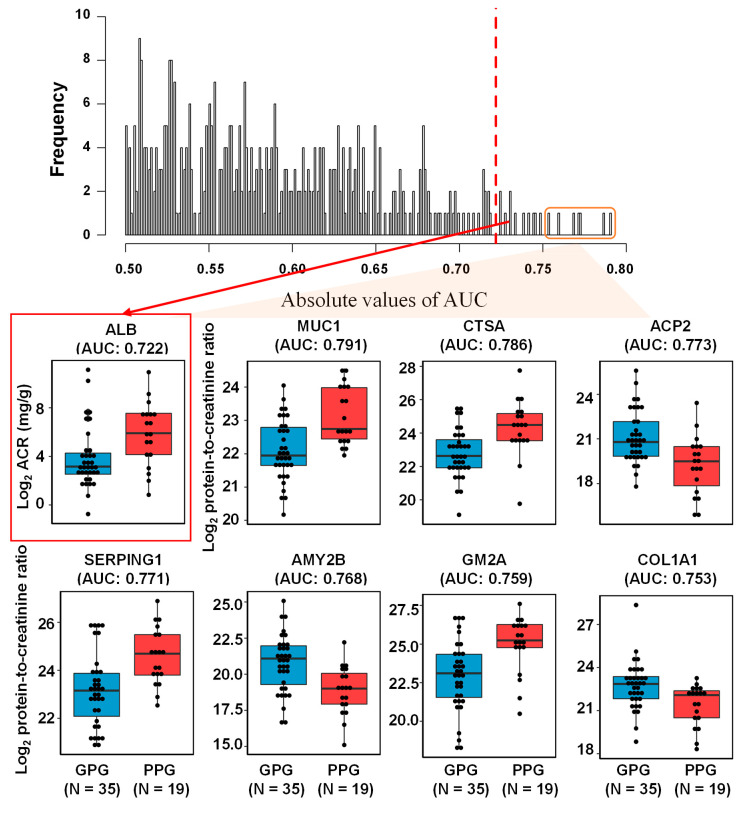
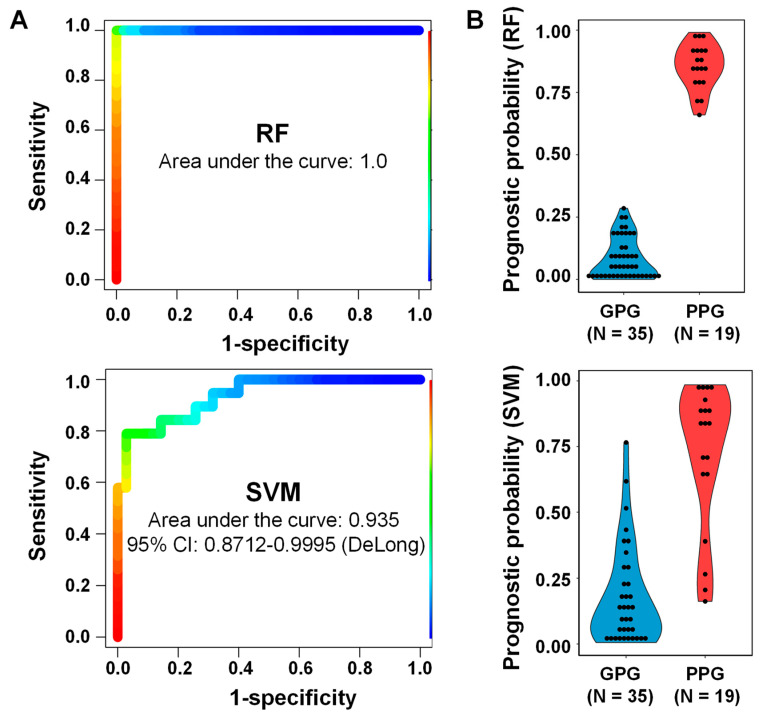
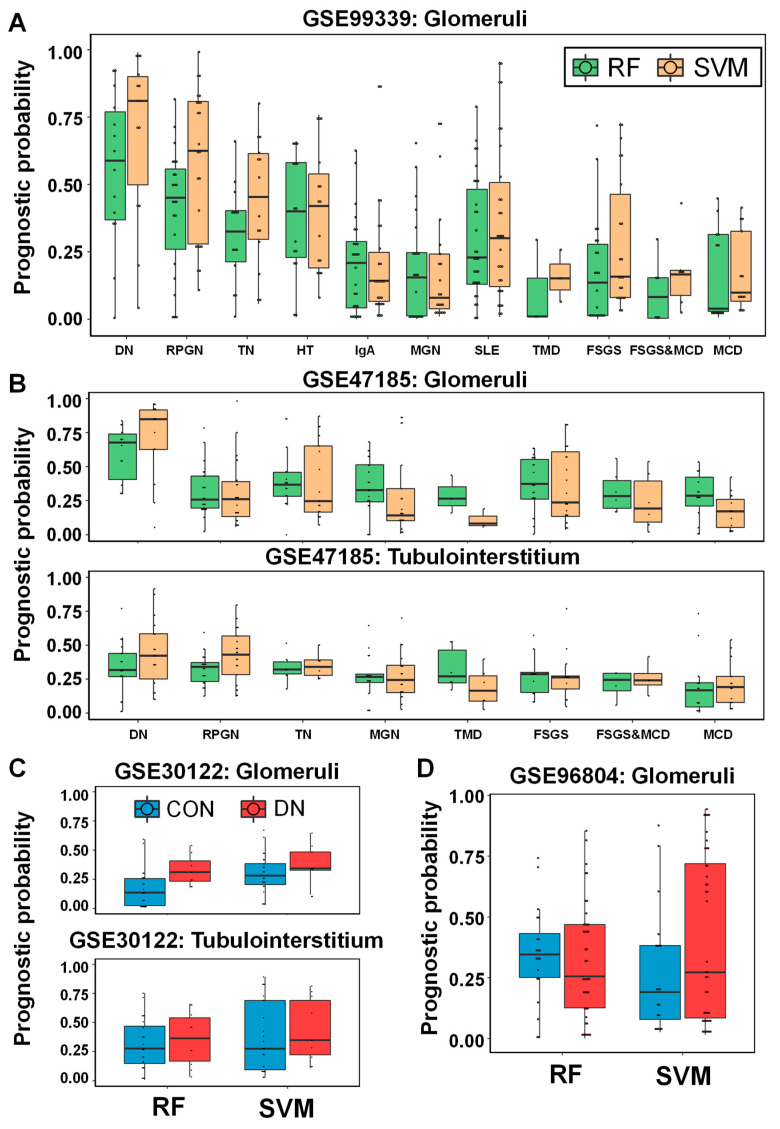
Renal dysfunction, a major complication of type 2 diabetes, can be predicted from estimated glomerular filtration rate (eGFR) and protein markers such as albumin concentration. Urinary protein biomarkers may be used to monitor or predict patient status. Urine samples were selected from patients enrolled in the retrospective diabetic kidney disease (DKD) study, including 35 with good and 19 with poor prognosis. After removal of albumin and immunoglobulin, the remaining proteins were reduced, alkylated, digested, and analyzed qualitatively and quantitatively with a nano LC-MS platform. Each protein was identified, and its concentration normalized to that of creatinine. A prognostic model of DKD was formulated based on the adjusted quantities of each protein in the two groups. Of 1296 proteins identified in the 54 urine samples, 66 were differentially abundant in the two groups (area under the curve (AUC): p-value < 0.05), but none showed significantly better performance than albumin. To improve the predictive power by multivariate analysis, five proteins (ACP2, CTSA, GM2A, MUC1, and SPARCL1) were selected as significant by an AUC-based random forest method. The application of two classifiers-support vector machine and random forest-showed that the multivariate model performed better than univariate analysis of mucin-1 (AUC: 0.935 vs. 0.791) and albumin (AUC: 1.0 vs. 0.722). The urinary proteome can reflect kidney function directly and can predict the prognosis of patients with chronic kidney dysfunction. Classification based on five urinary proteins may better predict the prognosis of DKD patients than urinary albumin concentration or eGFR.

Keywords: diabetic kidney disease; kidney function; machine learning; mass spectrometry; proteomics; statistical clinical model; urine.


Conflict of interest statement

The authors declare no conflict of interest.

Figures

Figure 1
Figure 1
(A) Analysis workflow of urinary proteins in the 54 diabetic kidney disease (DKD) patients. The analysis method is written in the upper part, the number of proteins in the middle, and the meaning of the protein in the bottom part. (B) Boxplots of normalized urinary protein abundances in the 54 samples (35 patients in good-prognostic group and 19 patients in poor-prognostic group) measured by LC-MS analysis. (C) Scatter plot of 68 urine proteins between normalized log2 abundance and log2 immunoassays concentration (Pearson correlation coefficient (ρ): 0.5 and p-value: 1.9 × 10⁻⁴).
Figure 2
Figure 2
Volcano plot of urinary proteomic data. Volcano plots are depicted with the fold change of each protein abundance and the p value was calculated by performing a Mann–Whitney U-test. The averages of the urinary proteomic abundance data of good prognostic group (N = 35) were compared with the averages of the data for poor prognostic group (N = 19). Red circles show 54 urinary proteins that have significant increases in PPG. Blue circles show 46 urinary proteins which have significant decreases in PPG. Gray circles are urinary proteins without statistical meaning. Green circles are previously released as urinary protein markers for glomerular injury or tubular injury.
Figure 3
Figure 3
Up-regulated proteome in good prognosis group (GPG) and gene ontology (GO) analysis. (A) Functional GO network displaying grouping of GO terms enriched in GPG up-regulated proteins. (B) Enriched GO terms in biological process and molecular function. (C) The network between GO terms and corresponding proteins represents the relationship between GO terms via the proteins. The abundances of each protein represent the violin plots in two groups. The numbers listed below represent the measured numbers for each group.
Figure 4
Figure 4
Up-regulated proteome in poor-prognostic group (PPG) and GO analysis. (A) Functional GO network displaying grouping of GO terms enriched in PPG up-regulated proteins. (B) Enriched GO terms in biological process, molecular function, and cellular component. (C) The network between GO terms and their contained proteins represents the relationship between GO terms via the proteins. The abundance of proteins represents the violin plots in two sample groups. The numbers listed below represent the measured numbers for each group.
Figure 5
Figure 5
Histogram of area under the ROC curves (AUC) of 412 urinary proteins and ACR. Top seven proteins (MUC1, CTSA, ACP2, SERPING1, AMY2B, GM2A, and COL1A1) and ACR are represented with box plots.
Figure 6
Figure 6
ROC curves of RF and SVM classifiers for five selected proteins (ACP2, CTSA, GM2A, MUC1 and SPARCL1). Performance of the two classifiers in the set of 54 samples, 35 from patients with good prognosis and 19 from patients with poor prognosis. (A) Areas under the curve (AUC) for the RF (1.0) and SVM (0.935) classifiers. (B) Clinical indices (0–1) of the two classifiers.
Figure 7
Figure 7
External validation of RF and SVM clinical models in public four GEO datasets (GSE99339, GSE47185, GSE30122 and GSE96804). (A) In the GSE99339 dataset, boxplot of the prognostic probabilities of the two classifiers in 11 disease groups including DN (N = 14), RPGN (N = 23), TN (N = 14), HT (N = 15), IgA nephropathy (N = 26), MGN (N = 21), SLE (N = 30), TMD (N = 3), FSGS (N = 22), FSGS&MCD (N = 6), and MCD (N = 13). (B) In the GSE30122 data set, the prognostic indexes of the two classifiers in the eight disease groups in the renal glomeruli with DN (N = 14), RPGN, (N = 23), TN (N = 17), MGN (N = 21), TMD (N = 3), FSGS (N = 23), FSGS&MCD (N = 6), and MCD (N = 15) and in the renal tubulointerstitia with DN (N = 18), RPGN (N = 21), TN (N = 6), MGN (N = 18), TMD (N = 6), FSGS (N = 13), FSGS&MCD (N = 4), and MCD (N = 15). (C) In the GSE30122 data set, the prediction values of the two classifiers in the control and disease groups in renal glomerulus (N = 26; control and N = 9; disease) and in renal tubulus (N = 24; control and N = 10; disease). (D) In the GSE30122 data set, the prediction probabilities of the two classifiers in the control (N = 20) and disease (N = 41) groups in renal glomeruli.

References

    1. Ahn J.H., Yu J.H., Ko S.H., Kwon H.S., Kim D.J., Kim J.H., Kim C.S., Song K.H., Won J.C., Lim S., et al. Prevalence and determinants of diabetic nephropathy in Korea: Korea national health and nutrition examination survey. Diabetes Metab. J. 2014;38:109–119. doi: 10.4093/dmj.2014.38.2.109. - DOI - PMC - PubMed
    1. Tuttle K.R., Bakris G.L., Bilous R.W., Chiang J.L., de Boer I.H., Goldstein-Fuchs J., Hirsch I.B., Kalantar-Zadeh K., Narva A.S., Navaneethan S.D., et al. Diabetic kidney disease: A report from an ADA Consensus Conference. Diabetes Care. 2014;37:2864–2883. doi: 10.2337/dc14-1296. - DOI - PMC - PubMed
    1. Collins A.J., Foley R.N., Chavers B., Gilbertson D., Herzog C., Johansen K., Kasiske B., Kutner N., Liu J., St Peter W., et al. United States Renal Data System 2011 Annual Data Report: Atlas of chronic kidney disease & end-stage renal disease in the United States. Am. J. Kidney Dis. 2012;59:A7. doi: 10.1053/j.ajkd.2011.11.015. - DOI - PubMed
    1. Currie G., Delles C. Urinary Proteomics for Diagnosis and Monitoring of Diabetic Nephropathy. Curr. Diabetes Rep. 2016;16:104. doi: 10.1007/s11892-016-0798-3. - DOI - PubMed
    1. KDIGO Working Group KDIGO clinical practice guideline for the evaluation and management of chronic kidney disease. Chapter 2: Definition, identification, and prediction of CKD progression. Kidney Int. Suppl. 2013;3:63–72. doi: 10.1038/kisup.2012.65. - DOI - PMC - PubMed

Publication types

MeSH terms