. 2020 Jun 30;117(26):15132-15136.
doi: 10.1073/pnas.2004944117. Epub 2020 Jun 16.

A high-coverage Neandertal genome from Chagyrskaya Cave

Affiliations

A high-coverage Neandertal genome from Chagyrskaya Cave

Fabrizio Mafessoni et al. Proc Natl Acad Sci U S A. .

Abstract

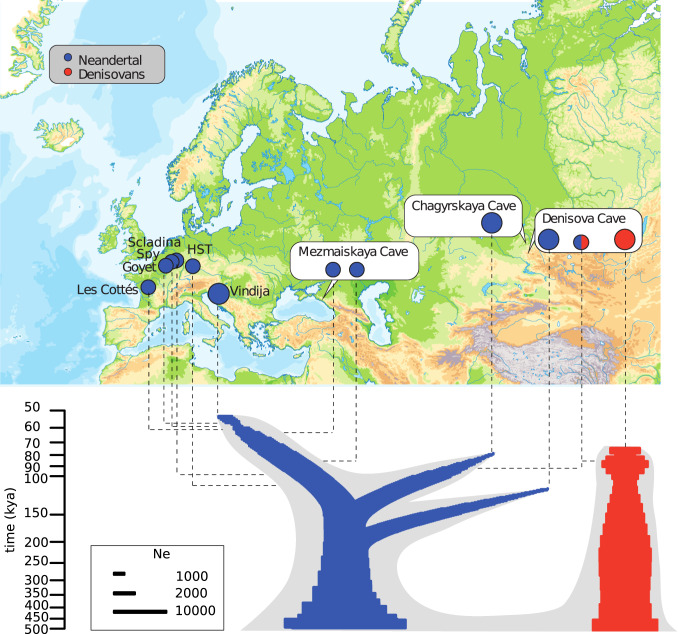
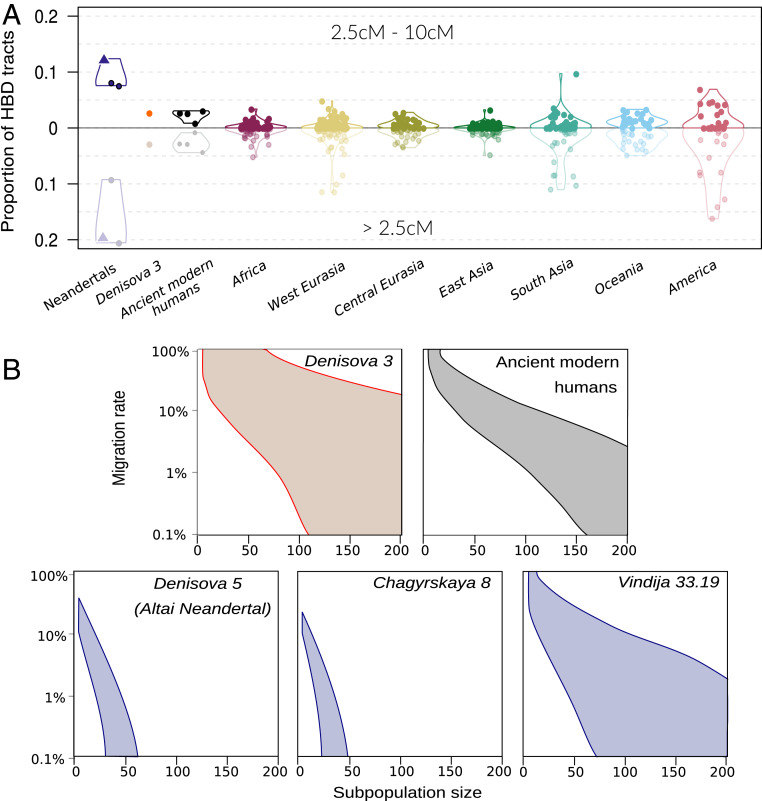
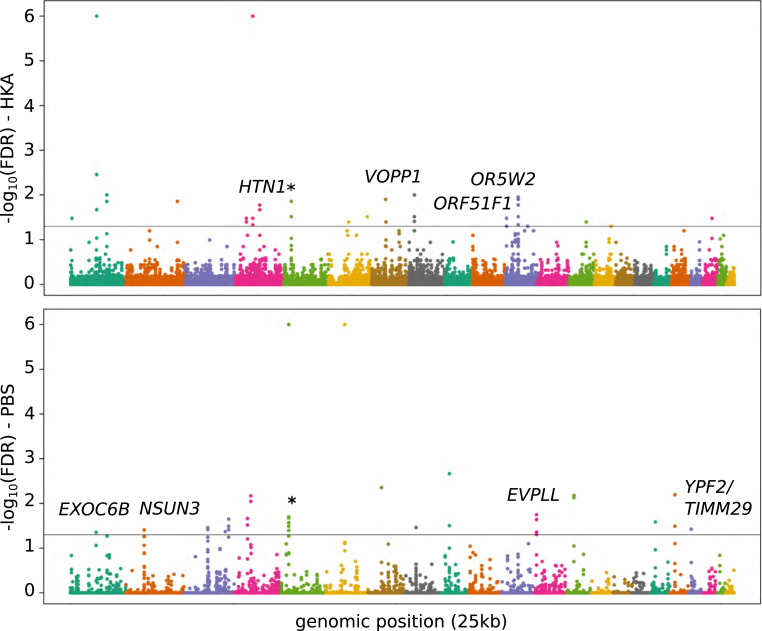
We sequenced the genome of a Neandertal from Chagyrskaya Cave in the Altai Mountains, Russia, to 27-fold genomic coverage. We show that this Neandertal was a female and that she was more related to Neandertals in western Eurasia [Prüfer et al., Science 358, 655-658 (2017); Hajdinjak et al., Nature 555, 652-656 (2018)] than to Neandertals who lived earlier in Denisova Cave [Prüfer et al., Nature 505, 43-49 (2014)], which is located about 100 km away. About 12.9% of the Chagyrskaya genome is spanned by homozygous regions that are between 2.5 and 10 centiMorgans (cM) long. This is consistent with the fact that Siberian Neandertals lived in relatively isolated populations of less than 60 individuals. In contrast, a Neandertal from Europe, a Denisovan from the Altai Mountains, and ancient modern humans seem to have lived in populations of larger sizes. The availability of three Neandertal genomes of high quality allows a view of genetic features that were unique to Neandertals and that are likely to have been at high frequency among them. We find that genes highly expressed in the striatum in the basal ganglia of the brain carry more amino-acid-changing substitutions than genes expressed elsewhere in the brain, suggesting that the striatum may have evolved unique functions in Neandertals.

Keywords: Neandertals; genetics; genome; human evolution.


Conflict of interest statement

The authors declare no competing interest.

Figures

Fig. 1.
Fig. 1.
The Chagyrskaya 8 Neandertal and its relationship with other archaic individuals. (Top) Locations of Chagyrskaya Cave and other sites where archaic specimens analyzed here were found are indicated. (Bottom) Schematic illustration of the relationship among archaic genomes. The gray outline describes relationships between high-coverage genomes (SI Appendix 7). Population split times estimated using the F(A|B) statistics (3, 4, 8) (SI Appendix 7) between high-coverage and low-coverage genomes are indicated by horizontal dashed line. Within the gray outlines, colored silhouettes schematically indicate population sizes (Ne) over time as estimated in SI Appendix 6. Neandertals are indicated in blue, Denisovans in red. Genomes determined to high genomic coverage (>27-fold) are indicated by large circles. The genomes from Spy, Goyet, and Les Cottés are reported in ref. , Scladina and Holehnstein-Stadel in ref. , other genomes in refs. –, .
Fig. 2.
Fig. 2.
Relative sharing of derived allele among the Chagyrskaya 8 and other archaic genomes. Positive values in the D statistic indicate more allele sharing with Chagyrskaya 8 than with Denisova 5 (A) or than with Vindija 33.19 (B). Error bars indicate one SE. One asterisk indicates Z > 2; two asterisks indicate Z > 3. Late Neandertals of low genomic coverage refer to the genomes in ref. .
Fig. 3.
Fig. 3.
Homozygous tracts in archaic genomes. (A) Proportion of the genome spanned by HBD tracts of size 2.5–10 cM (Top, dark) and all HBD tracts (Bottom, light) for archaic genomes, ancient modern humans and present-day humans from the Simons Genome Diversity Project (18). Values for Chagyrskaya 8 are indicated by a triangle. The genetic size of the tracts was estimated assuming a uniform recombination rate of 1.3 × 10⁻⁸ recombinations/bp. (B) Estimated group size (x axis) and migration rate (y axis) for three Neandertals, one Denisovan, and ancient modern human genomes based on HBD tracts >2.5 cM long. The colored areas delimit 95% confidence intervals of likelihood ratios. Ancient modern humans give estimates for the genomes of four individuals dated to between ∼45 and ∼8 kya [“Ust’Ishim” (15), “Sunghir 2” (24), “Loschbour” (25), and “LBK-Stuttgart” (25)].
Fig. 4.
Fig. 4.
Positive selection on the Neandertal lineage. Manhattan plots of HKA (Top) and PBS (Bottom) tests for positive selection applied to three Neandertal genomes. Different colors indicate different autosomes, from 1 (Left) to 22 (Right). The y axis indicates −log10 of false discovery rates (FDR). The gray line indicates FDR = 5%. Candidate windows that overlap exons are indicated by the name of the corresponding gene. The regions that are significant for both tests are indicated by an asterisk.

References

    1. Prüfer K. et al. ., A high-coverage Neandertal genome from Vindija cave in Croatia. Science 358, 655–658 (2017). - PMC - PubMed
    1. Hajdinjak M. et al. ., Reconstructing the genetic history of late Neanderthals. Nature 555, 652–656 (2018). - PMC - PubMed
    1. Prüfer K. et al. ., The complete genome sequence of a Neanderthal from the Altai Mountains. Nature 505, 43–49 (2014). - PMC - PubMed
    1. Green R. E. et al. ., A draft sequence of the Neandertal Genome. Science 328, 710–722 (2010). - PMC - PubMed
    1. Reich D. et al. ., Genetic history of an archaic hominin group from Denisova Cave in Siberia. Nature 468, 1053–1060 (2010). - PMC - PubMed

Publication types

LinkOut - more resources