. 2020 Jun 30;117(26):15281-15292.
doi: 10.1073/pnas.2000500117. Epub 2020 Jun 16.

Endosomal signaling of delta opioid receptors is an endogenous mechanism and therapeutic target for relief from inflammatory pain

Affiliations

Endosomal signaling of delta opioid receptors is an endogenous mechanism and therapeutic target for relief from inflammatory pain

Nestor N Jimenez-Vargas et al. Proc Natl Acad Sci U S A. .

Abstract

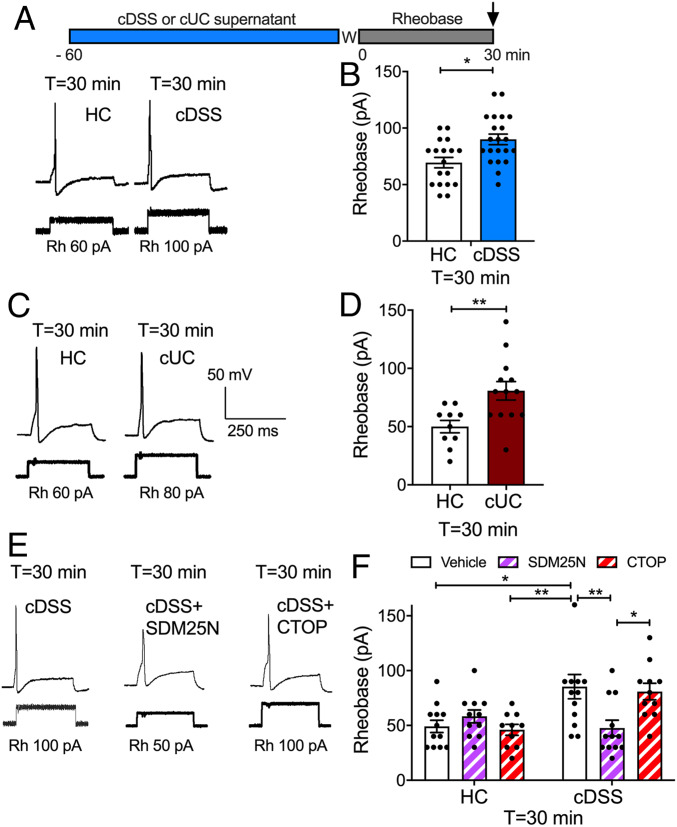
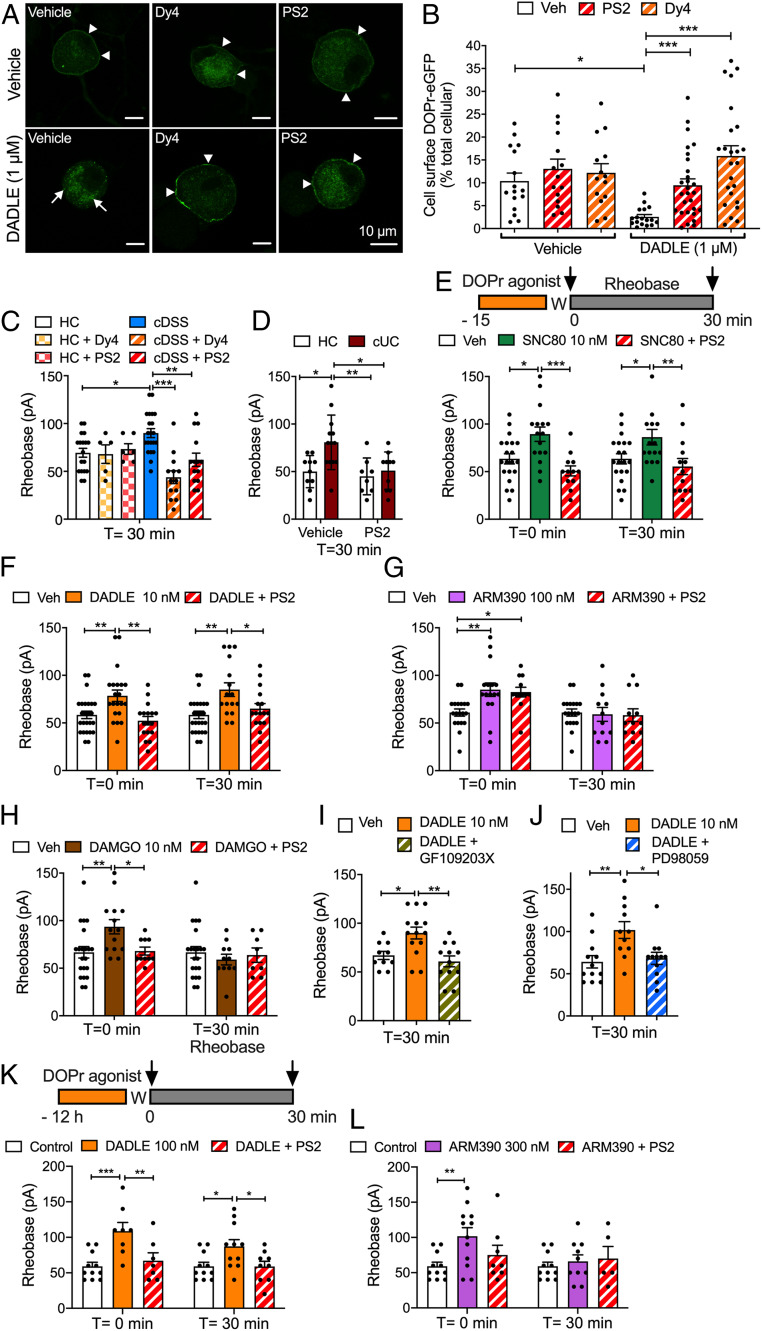
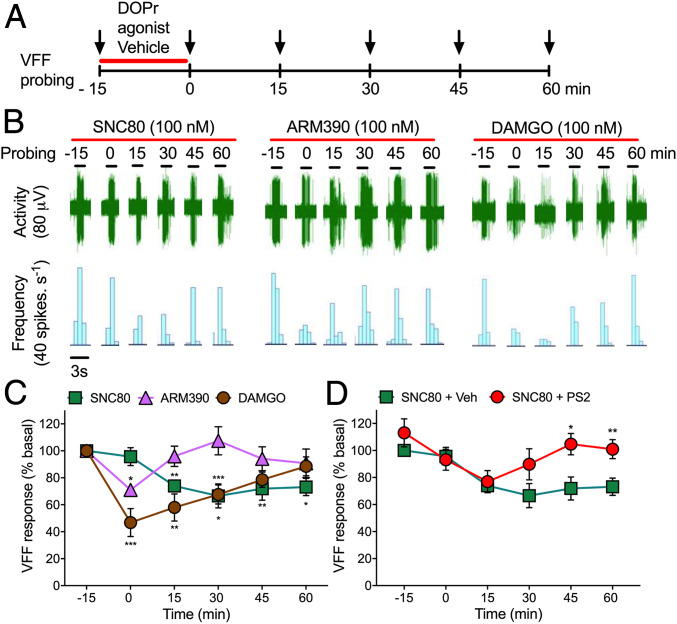
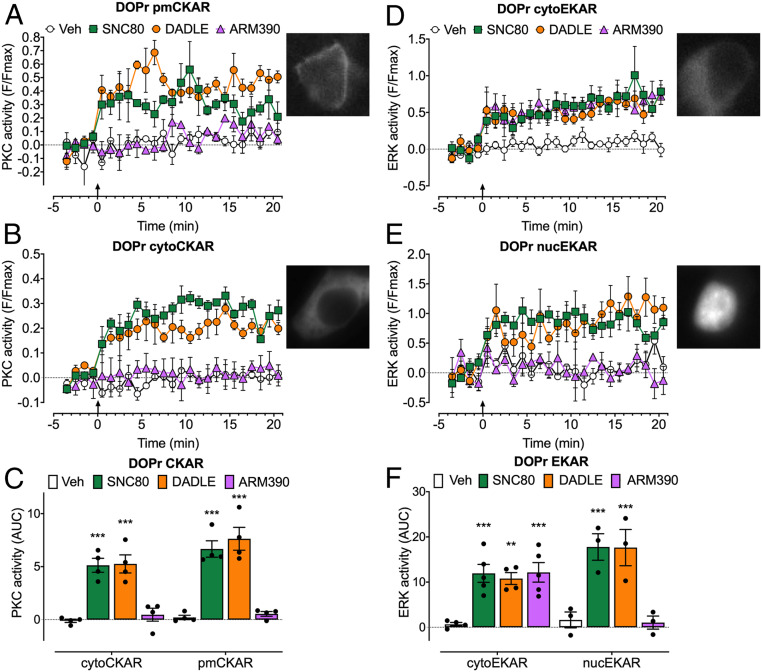
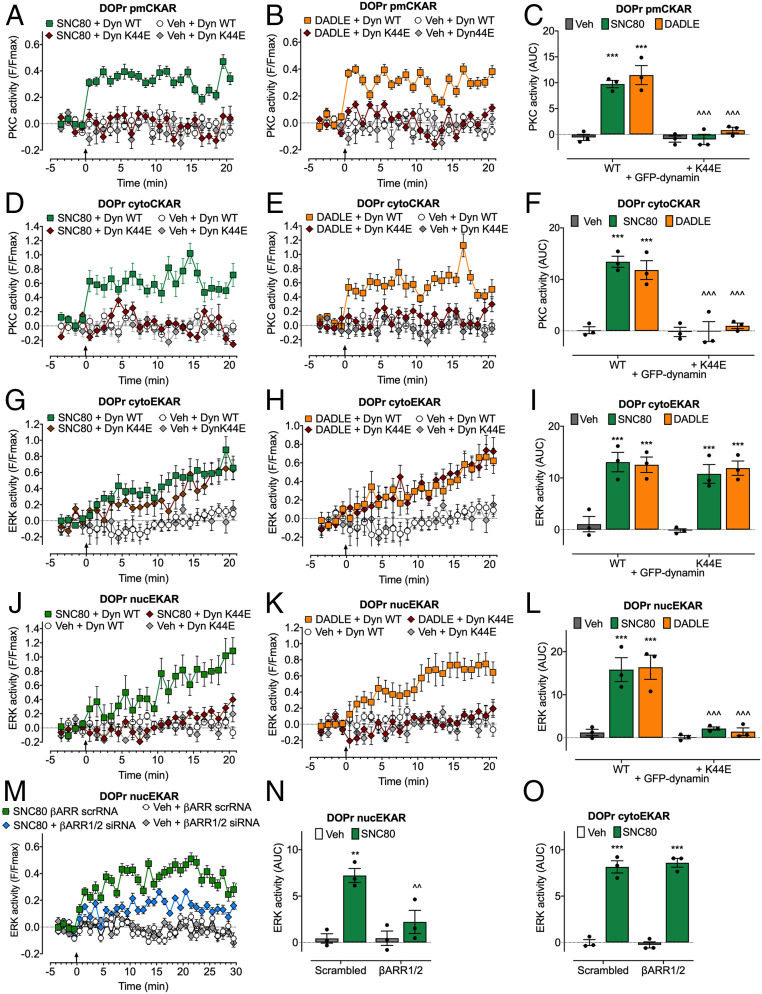
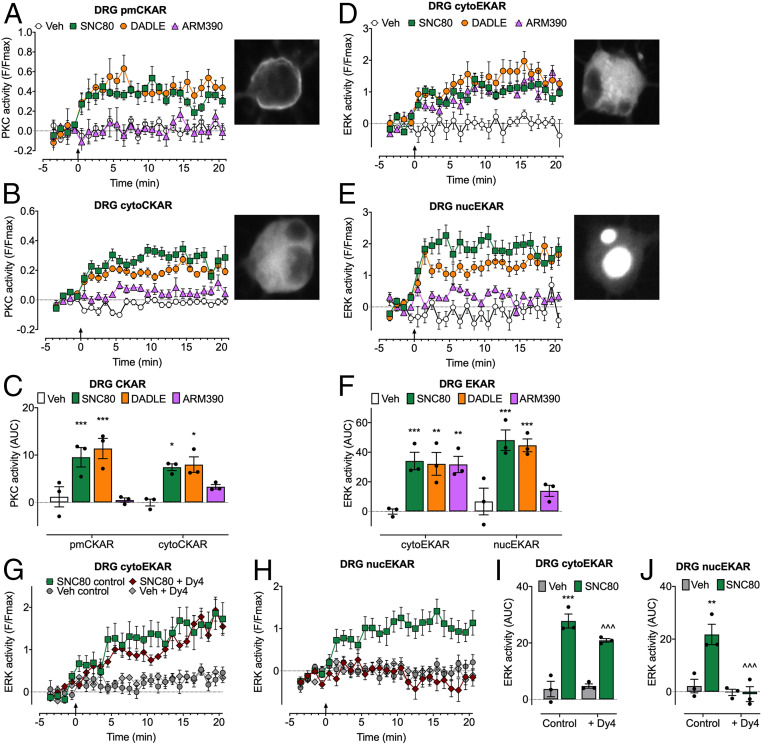
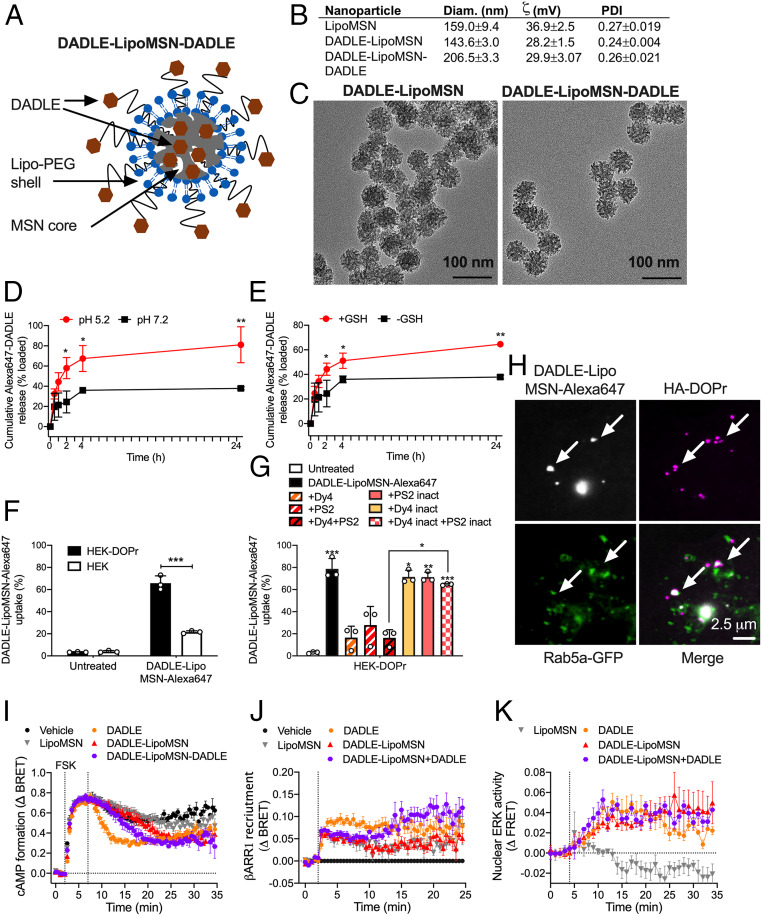
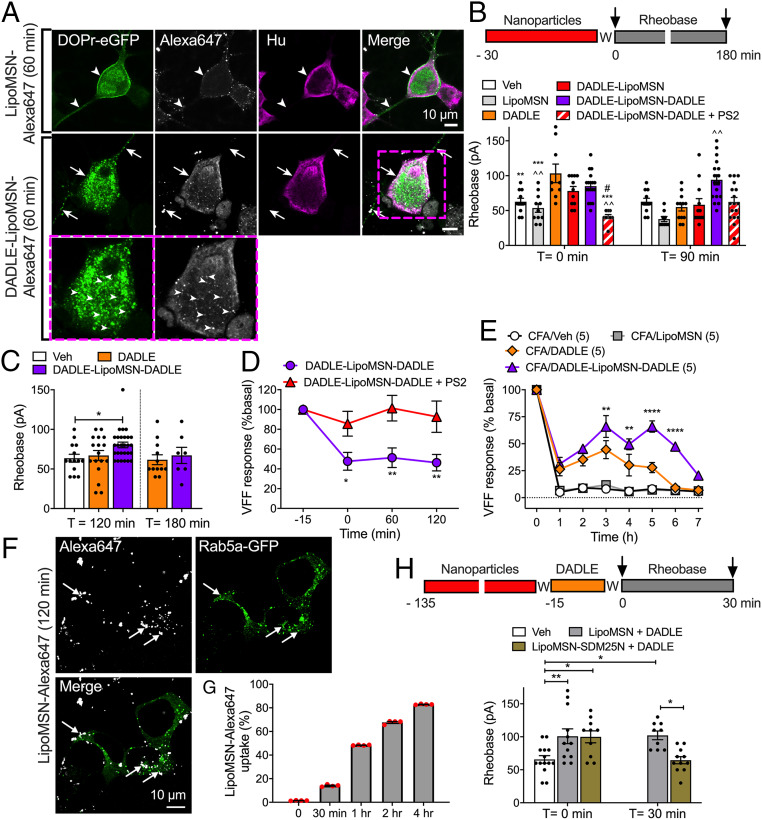
Whether G protein-coupled receptors signal from endosomes to control important pathophysiological processes and are therapeutic targets is uncertain. We report that opioids from the inflamed colon activate δ-opioid receptors (DOPr) in endosomes of nociceptors. Biopsy samples of inflamed colonic mucosa from patients and mice with colitis released opioids that activated DOPr on nociceptors to cause a sustained decrease in excitability. DOPr agonists inhibited mechanically sensitive colonic nociceptors. DOPr endocytosis and endosomal signaling by protein kinase C (PKC) and extracellular signal-regulated kinase (ERK) pathways mediated the sustained inhibitory actions of endogenous opioids and DOPr agonists. DOPr agonists stimulated the recruitment of Gαi/o and β-arrestin1/2 to endosomes. Analysis of compartmentalized signaling revealed a requirement of DOPr endocytosis for activation of PKC at the plasma membrane and in the cytosol and ERK in the nucleus. We explored a nanoparticle delivery strategy to evaluate whether endosomal DOPr might be a therapeutic target for pain. The DOPr agonist DADLE was coupled to a liposome shell for targeting DOPr-positive nociceptors and incorporated into a mesoporous silica core for release in the acidic and reducing endosomal environment. Nanoparticles activated DOPr at the plasma membrane, were preferentially endocytosed by DOPr-expressing cells, and were delivered to DOPr-positive early endosomes. Nanoparticles caused a long-lasting activation of DOPr in endosomes, which provided sustained inhibition of nociceptor excitability and relief from inflammatory pain. Conversely, nanoparticles containing a DOPr antagonist abolished the sustained inhibitory effects of DADLE. Thus, DOPr in endosomes is an endogenous mechanism and a therapeutic target for relief from chronic inflammatory pain.

Keywords: G protein-coupled receptors; inflammation; nanomedicine; pain; signaling.


Conflict of interest statement

Competing interest statement: N.W.B. is a founding scientist of Endosome Therapeutics Inc. Research in the laboratories of N.A.V., N.W.B., and D.P.P. is funded in part by Takeda Pharmaceuticals International.

Figures

Fig. 1.
Fig. 1.
Endogenous opioids and nociceptor excitability. Mouse DRG neurons were preincubated with supernatant from biopsies of HC, cDSS, or cUC colon and washed (W), and rheobase (Rh) was measured at 30 min after washing. Representative traces (A, C, and E) and pooled results (B, D, and F) of effects of supernatants from mouse (A, B, E, and F) and human (C and D) colonic biopsies. (E and F) Effects of antagonists of DOPr (SDM25N) or MOPr (CTOP) on responses to HC or cDSS supernatants. Data points indicate the number of studied neurons from n = 12 to 16 mice in B, 6 mice in D, and 8 mice in F for each treatment (mean ± SEM). *P < 0.05, **P < 0.001, two-way ANOVA with Tukey’s post hoc test.
Fig. 2.
Fig. 2.
Endosomal DOPr signaling and nociceptor excitability. (A and B) Endocytosis of DOPr-eGFP in DRG neurons from DOPr-eGFP mice. Neurons were incubated with vehicle (Veh) or DADLE (1 µM, 30 min), and DOPr-eGFP was localized by immunofluorescence. Neurons were preincubated with vehicle, Dy4, or PS2. (A) Representative images from four independent experiments. Arrowheads denote plasma membrane; arrows, endosomal DOPr-eGFP. (B) Quantification of the proportion of total cellular DOPr-eGFP at the plasma membrane. Data points indicate the number of studied neurons (N). *P < 0.05, ***P < 0.001, two-way ANOVA with Tukey’s post hoc test. (CL) Rheobase of mouse DRG neurons at 0 or 30 min after exposure to supernatant or DOPr agonists and washing. (C and D) Supernatant from cDSS, cUC, or HC biopsy specimens. (EJ) Neurons were incubated with the following agonists for 15 min and washed (W), and rheobase was measured at 0 or 30 min after washing: DOPr agonists SNC80 (E, 10 nM, internalizing), DADLE (F, 10 nM, internalizing) or ARM390 (G, 100 nM, weakly internalizing), and MOPr agonist DAMGO (H, 10 nM). In CH, neurons were preincubated with Dy4, PS2, or vehicle. In I and J, neurons were preincubated with PKC inhibitor GF10923X or MEK1 inhibitor PD98059 before DADLE. (K and L) Neurons were incubated with the following agonists overnight and washed, and rheobase was measured at 0 or 30 min after washing: DADLE (K, 100 nM, internalizing) or ARM390 (L, 300 nM, weakly internalizing). Data points indicate the number of studied neurons from 12 to 16 mice in C, 6 mice in D, 10 to 15 mice in EJ, and 6 mice in K and L for each treatment (mean ± SEM). *P < 0.05, **P < 0.01, ***P < 0.001, one-way or two-way ANOVA with Tukey’s post hoc test.
Fig. 3.
Fig. 3.
MOPr and DOPr inhibition of colonic nociceptors. (A) Experimental protocol to examine MOPr and DOPr regulation of responses of colonic nociceptors to VFF probing. (B) Representative responses to agonists of DOPr (SNC80 and ARM390, 100 nM) and MOPr (DAMGO, 100 nM). (C and D) Time course of responses. In D, tissue was preincubated with PS2 or vehicle (Veh) before SNC80. n = 5 mice for each treatment. Data are mean ± SEM. *P < 0.05, **P < 0.01, ***P < 0.001, two-way ANOVA with Tukey’s post hoc test.
Fig. 4.
Fig. 4.
DOPr-mediated PKC and ERK signaling in subcellular compartments of HEK293 cells. FRET biosensors for pmCKAR and cytoCKAR or cytoEKAR and nucEKAR were coexpressed with DOPr. Insets show cellular localization of FRET biosensors. Agonists (all 100 nM) or vehicle (Veh) were administered at the arrows. (A and B) Time course of plasma membrane (A) and cytosolic (B) PKC. (C) Integrated responses of plasma membrane and cytosolic PKC over 20 min (area under the curve [AUC]). (D and E) Time course of activation of cytosolic (D) and nuclear (E) ERK. (F) Integrated responses of cytosolic and nuclear ERK over 20 min (AUC). Data points show results of individual experiments. n = 4 (AC), n = 5 cytoEKAR, n = 3 nucEKAR (DF) independent experiments. Data are mean ± SEM. **P < 0.01, ***P < 0.001 ligand to vehicle, one-way ANOVA with Tukey’s post hoc test.
Fig. 5.
Fig. 5.
Endosomal DOPr-mediated PKC and ERK signaling in subcellular compartments of HEK293 cells. FRET biosensors for pmCKAR and cytoCKAR or cytoEKAR and nucEKAR were coexpressed with DOPr and either dynamin WT (Dyn WT) or dominant negative dynamin K44E (Dyn K44E) (AL) or with βARR1+2 siRNA or scrambled (scr) siRNA (control) (MO). Agonists (all 100 nM) or vehicle (Veh) were administered at the arrows. (AC) Plasma membrane PKC activity. (DF) Cytosolic PKC activity. (GI and O) Cytosolic ERK activity. (JN) Nuclear ERK activity. (A, B, D, E, G, H, J, K, and M) Time course of responses. (C, F, I, L, N, and O) Integrated responses over 20 or 30 min (AUC). Data points show results of individual experiments. n = 3 independent experiments. Data are mean ± SEM. **P < 0.01, ***P < 0.001 ligand to vehicle; ^^P < 0.01, ^^^P < 0.001 inhibitors to control; two-way ANOVA with Tukey’s post hoc test.
Fig. 6.
Fig. 6.
Endosomal DOPr-mediated PKC and ERK signaling in subcellular compartments of DRG neurons. FRET biosensors for pmCKAR and cytoCKAR or cytoEKAR and nucEKAR were expressed in DRG neurons from DOPr-eGFP mice. Insets show localization of FRET biosensors. Agonists (all 100 nM) or vehicle (Veh) were administered at arrow. (A and B) Time course of plasma membrane (A) and cytosolic (B) PKC. (C) Effects of agonist treatments on PKC over 20 min (AUC). (D and E) Time course of cytosolic ERK (D) and nuclear ERK (E). (F) Effects of agonists on ERK activity over 20 min (AUC). (G and H) Time course of effects of dynamin inhibitor (Dy4) on cytosolic (G) and nuclear (H) ERK activity. (I and J) Effects of Dy4 treatments on ERK over 20 min (AUC). Data points show results of individual experiments. n = 3 independent experiments. Data are mean ± SEM. *P < 0.05, **P < 0.01, ***P < 0.001 ligand to vehicle; ^^^P < 0.001 inhibitor to control; one-way ANOVA with Tukey’s post hoc test.
Fig. 7.
Fig. 7.
Characterization of nanoparticles. (A) Structure of DADLE-LipoMSN-DADLE. (B) Physical properties of nanoparticles. n = 4 experiments. (C) Transmission electron micrographs of DADLE-LipoMSN and DADLE-LipoMSN-DADLE. Representative images, n = 3 independent experiments. (D and E) Time course of in vitro release of DADLE-Alexa647 from MSN-DADLE-Alexa647 at graded pH (D) and glutathione concentrations (E). n = 3 independent experiments. *P < 0.05, **P < 0.01, t test with Holm–Sidak correction. (F and G) Uptake of DADLE-LipoMSN-DADLE-Alexa647 into HEK293 control and HEK-DOPr cells determined by flow cytometry. (F) Uptake into HEK293 control and HEK-DOPr cells after 2 h. ***P < 0.001, t test with Holm–Sidak correction. (G) Effects of inhibitors of clathrin and dynamin and inactive analogs on uptake into HEK-DOPr cells after 2 h. n = 3 independent experiments. *P < 0.05, **P < 0.01, ***P < 0.001 compared with untreated cells, one-way ANOVA with Tukey’s post hoc test. (H) Uptake of DADLE-LipoMSN-DADLE-Alexa647 into HEK-HA-DOPr cells after 30 min. Arrows show colocalization of DADLE-LipoMSN-DADLE-Alexa647 with DOPr in Rab5a-positive early endosomes. Representative images from four independent experiments. (IK) Effects of DADLE (100 nM), DADLE-LipoMSN (20 µM), and DADLE-LipoMSN-DADLE (20 µM) on forskolin (FSK; 10 µM)-stimulated cAMP formation (I), βARR1 recruitment (J), and activation of nuclear ERK (K). n = 5 independent experiments. All results are mean ± SEM.
Fig. 8.
Fig. 8.
Effects of nanoparticle-encapsulated DOPr ligands on nociceptors. (A) Uptake of LipoMSN-Alexa647 (control) or DADLE-LipoMSN-Alexa647 into primary cultures of DRG neurons from DOPr-eGFP mice. Neurons were incubated with nanoparticles for 60 min. Representative images from two experiments, from four mice. (B and C) Rheobase of mouse DRG neurons at 0, 90, 120, or 180 min after exposure to DADLE, DADLE-LipoMSN-DADLE, DADLE-LipoMSN (all 100 nM), LipoMSN (control), or vehicle (control) and washing. Some neurons were exposed to PS2 and DADLE-LipoMSN-DADLE. Data points indicate the number of studied neurons from n = 6 to 12 mice in B and C for each treatment. Compared with *DADLE, ^DADLE-LipoMSN-DADLE, and #DADLE-LipoMSN; *#P < 0.05, **^^P < 0.01, ***P < 0.001, one-way (B) or two-way (C) ANOVA with Tukey’s post hoc test. (D) Colonic afferent activity at 0, 60, or 120 min after exposure of tissues to DADLE-LipoMSN-DADLE (100 nM). Some preparations were exposed to PS2 and DADLE-LipoMSN-DADLE. n = 5 mice per group. *P < 0.05, **P < 0.01, two-way (*) ANOVA with Sidak’s post hoc test. (E) Ipsilateral paw withdrawal responses in mice. DADLE, DADLE-LipoMSN-DADLE (both 100 nM DADLE), LipoMSN, or vehicle (Veh) was injected intrathecally at 48 h after intraplantar CFA. n = 5 mice per group. **P < 0.01, ****P < 0.0001 DADLE compared with DADLE-LipoMSN-DADLE, two-way ANOVA with Tukey’s multiple comparison post hoc test. (F) Uptake of LipoMSN-Alexa647 into endosomes of HEK293 cells expressing Rab5a-GFP after 120 min. (G) Time course of uptake of LipoMSN-Alexa647 into HEK293 cells. n = 3 independent experiments. (H) Rheobase of mouse DRG neurons. Neurons were incubated with LipoMSN-SDM25N (100 nM) or LipoMSN (control) for 120 min, washed (W), incubated with DADLE (10 nM, 15 min), and washed again. Rheobase was measured at 0 or 30 min after washing. Data points indicate the number of studied neurons from four mice for each treatment. *P < 0.05, **P < 0.01, two-way ANOVA with Tukey’s post hoc test. All results are mean ± SEM.

References

    1. Hauser A. S., Attwood M. M., Rask-Andersen M., Schiöth H. B., Gloriam D. E., Trends in GPCR drug discovery: New agents, targets and indications. Nat. Rev. Drug Discov. 16, 829–842 (2017). - PMC - PubMed
    1. Komolov K. E., Benovic J. L., G protein-coupled receptor kinases: Past, present and future. Cell. Signal. 41, 17–24 (2018). - PMC - PubMed
    1. Peterson Y. K., Luttrell L. M., The diverse roles of arrestin scaffolds in G protein-coupled receptor signaling. Pharmacol. Rev. 69, 256–297 (2017). - PMC - PubMed
    1. DeFea K. A., et al. , The proliferative and antiapoptotic effects of substance P are facilitated by formation of a beta-arrestin-dependent scaffolding complex. Proc. Natl. Acad. Sci. U.S.A. 97, 11086–11091 (2000). - PMC - PubMed
    1. DeFea K. A., et al. , Beta-arrestin-dependent endocytosis of proteinase-activated receptor 2 is required for intracellular targeting of activated ERK1/2. J. Cell Biol. 148, 1267–1281 (2000). - PMC - PubMed

Publication types

Substances