. 2020 Jun 16;13(636):eaay1451.
doi: 10.1126/scisignal.aay1451.

High-throughput dynamic BH3 profiling may quickly and accurately predict effective therapies in solid tumors

Affiliations

High-throughput dynamic BH3 profiling may quickly and accurately predict effective therapies in solid tumors

Patrick D Bhola et al. Sci Signal. .

Abstract

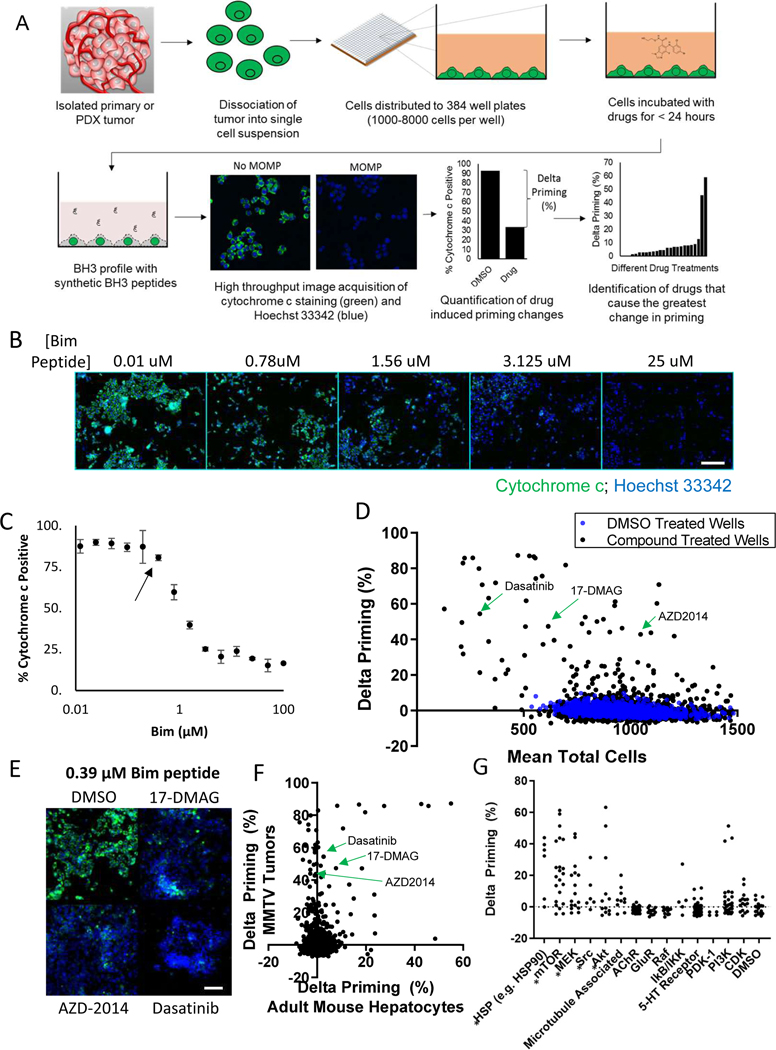
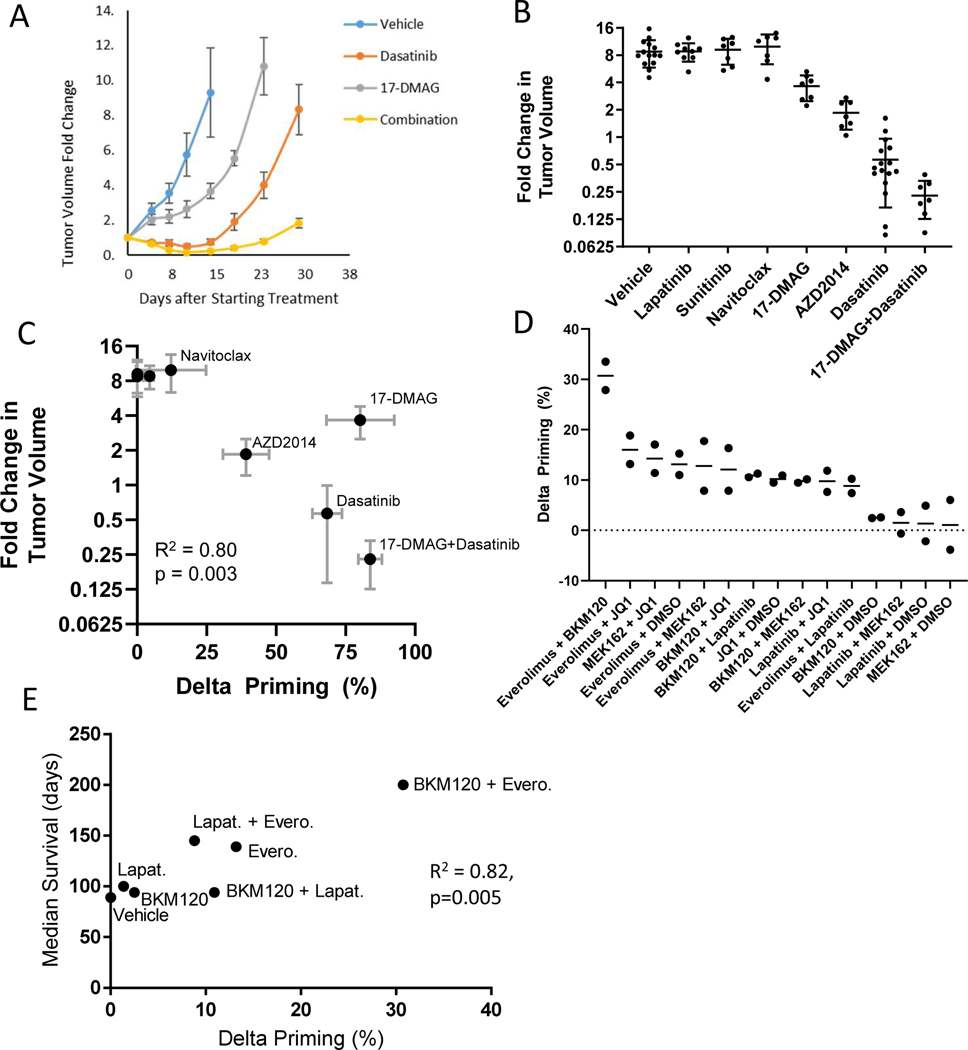
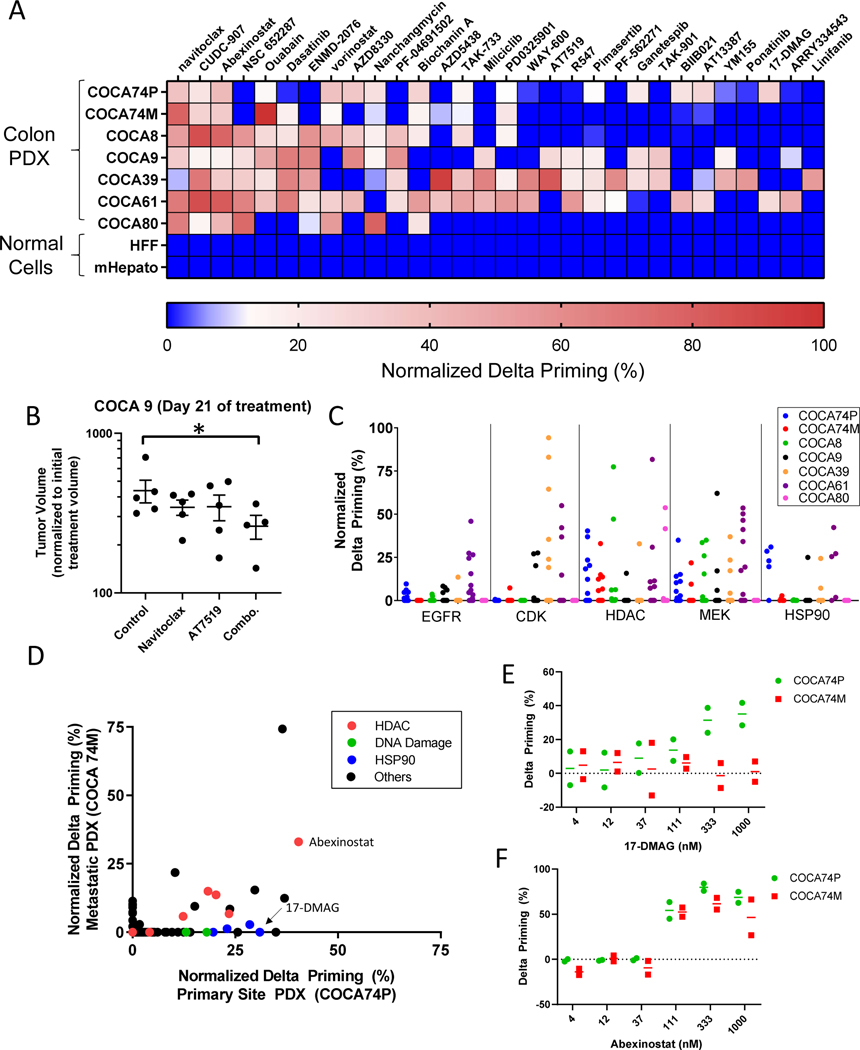
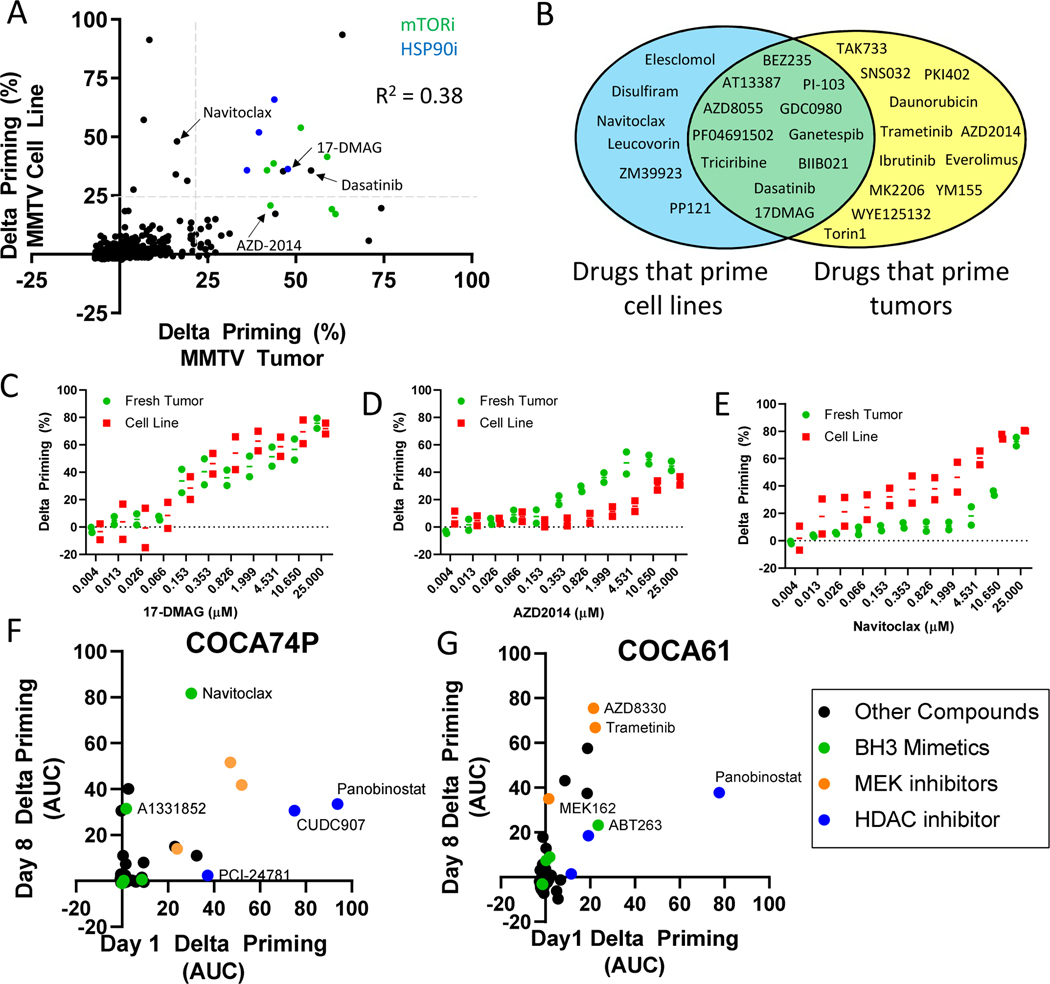
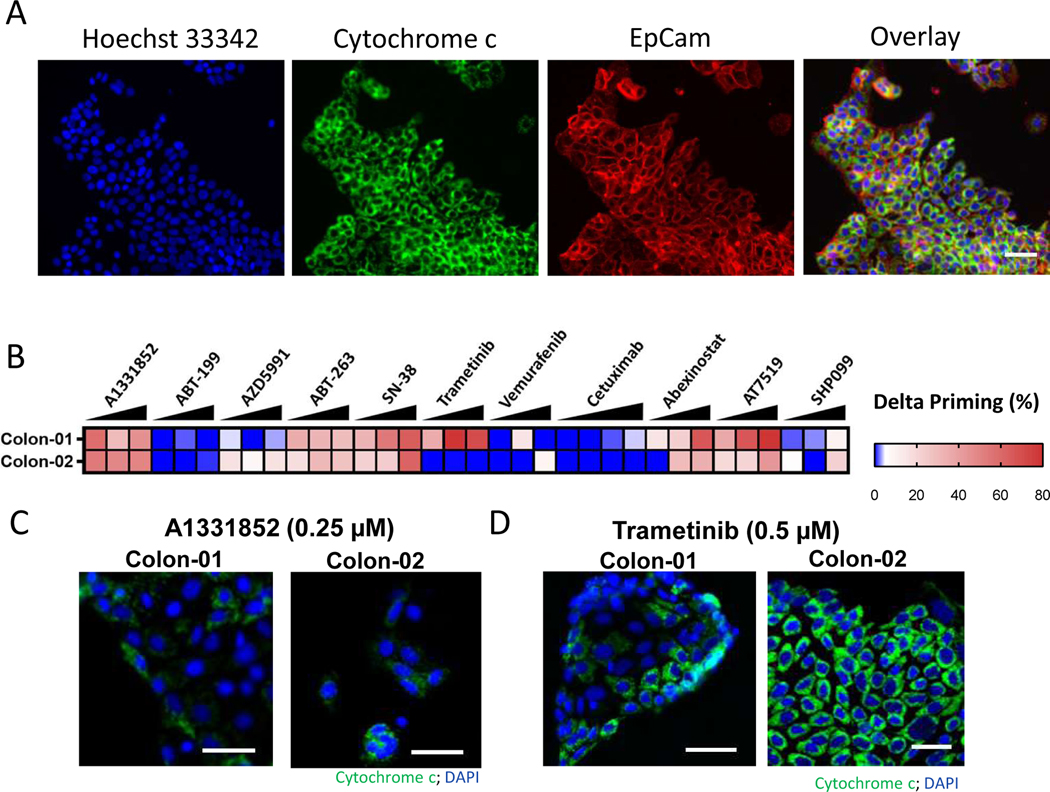
Despite decades of effort, the sensitivity of patient tumors to individual drugs is often not predictable on the basis of molecular markers alone. Therefore, unbiased, high-throughput approaches to match patient tumors to effective drugs, without requiring a priori molecular hypotheses, are critically needed. Here, we improved upon a method that we previously reported and developed called high-throughput dynamic BH3 profiling (HT-DBP). HT-DBP is a microscopy-based, single-cell resolution assay that enables chemical screens of hundreds to thousands of candidate drugs on freshly isolated tumor cells. The method identifies chemical inducers of mitochondrial apoptotic signaling, a mechanism of cell death. HT-DBP requires only 24 hours of ex vivo culture, which enables a more immediate study of fresh primary tumor cells and minimizes adaptive changes that occur with prolonged ex vivo culture. Effective compounds identified by HT-DBP induced tumor regression in genetically engineered and patient-derived xenograft (PDX) models of breast cancer. We additionally found that chemical vulnerabilities changed as cancer cells expanded ex vivo. Furthermore, using PDX models of colon cancer and resected tumors from colon cancer patients, our data demonstrated that HT-DBP could be used to generate personalized pharmacotypes. Thus, HT-DBP appears to be an ex vivo functional method with sufficient scale to simultaneously function as a companion diagnostic, therapeutic personalization, and discovery tool.


Figures

Fig. 1:
Fig. 1:. High-throughput dynamic BH3 profiling screen of 1650 compounds identifies chemicals that sensitize freshly isolated tumor cells, and not healthy cells for apoptosis.
(A) Schematic showing the workflow of the HT-DBP screening platform. Compounds with the largest delta priming cause the largest increase in apoptotic sensitivity. (B) Cytochrome c staining in response to Bim peptide dose in MMTV-PyMT tumors. Scale bars, 100 μm. Images are representative of 2 independent experiments. (C) Quantification of the dose response curve from imaging described in (B). Arrow indicates the peptide concentration chosen for use in the screening. Data are mean ± SD of 6 replicates, representative of 2 independent experiments. (D) HT-DBP on MMTV-PyMT tumors to identify compounds that increase apoptotic sensitivity. DMSO-treated wells shown in blue; compound-treated wells shown in black. Data are mean of 2 independent experiments. (E) Images of selected wells from the chemical screen and the DMSO. Wells were treated with the indicated for 24 hours and subsequently treated with 0.39 μM of the synthetic peptide. Cytochrome c immunofluorescence is shown in green, and Hoechst 33342 staining is shown in blue. Images are representative of 2 independent screens. (F) Comparison of a screen on freshly isolated adult mouse hepatocytes and freshly isolated MMTV-PyMT tumor cells. Data represents mean of 2 independent experiments. (G) Chemical annotation of drug targets from the HT-DBP screen on MMTV-PyMT tumors. Each dot represents a single compound. Asterisks indicate instances where compounds with a similar target increase apoptotic priming (p<0.0001, one-way ANOVA). Data represents mean of 2 independent experiments.
Fig. 2:
Fig. 2:. HT-DBP predicts in vivo response in breast cancer models.
(A) Change in tumor volume relative to the start of treatment over time for select drug treatment in MMTV-PyMT tumors. Data are mean ± SEM of at least 7 mice per group. (B) Fold change in tumor volume at day 14 relative to the start of treatment for MMTV-PyMT tumors. Each dot represents a single mouse; data are mean ± SEM of at least 7 mice per group. Dasatinib (10 mg/kg, i.p), 17-DMAG (10 mg/kg, i.p), AZD2014 (15 mg/kg, p.o), lapatinib (50 mg/kg, p.o), or sunitinib (50 mg/kg, p.o) were dosed daily 5 days a week for 2 weeks. Navitoclax (100mg/kg, p.o) was dosed daily for 2 weeks. (C) Correlation between dynamic BH3 profiling, and MMTV-PyMT tumor response in vivo. (R2 = 0.83; p = 0.004; Pearson). Delta priming data (horizontal) are mean ± SD of n=3 independent experiments at 1 μM of drug. Tumor volume data (vertical) are mean ± SEM from 7–15 mice per group. (D) HT-DBP of select drug combinations in the DF-BM355 breast cancer PDX model. Each point represents an independent experiment. Lines represent mean of N = 2 experiments. (E) Correlation between dynamic BH3 profiling, and median survival of DF-BM355 mice treated with compounds. N = 5–9 mice per group. (R2 = 0.82, p=0.005; Pearson).
Fig. 3:
Fig. 3:. Identification of apoptotic sensitizing compounds and drug targets in patient derived xenografts of colorectal cancer.
(A) Delta priming measurements of the top 35 hits from HT-DBP on seven PDX models of colorectal cancer and healthy cells Red indicates compounds that cause the highest increase in apoptotic priming. Dark blue indicates compounds that are less than 3 times standard deviation of DMSO treated wells. Data represent mean of 2 replicates. (B) Tumor volume after 21 days of in vivo treatment of COCA9 with navitoclax (100 mg/kg, p.o., daily), AT7519 (15 mg/kg, i.p., daily) or a combination of navitoclax and AT7519. Asterisk indicates a significant difference in tumor volume relative to vehicle treated cells (Mann-Whitney, p=0.03). Each point represents a single mouse; n = 4–5 mice per treatment arm. (C) Delta priming of the different PDX models based on nominal drug targets. Nominal targets include EGFR (31 compounds), pan-CDK (15 compounds), pan-HDAC (20 compounds), MEK (12 compounds), HSP90 (5 compounds). Data represent mean of 2 replicates. (D) Comparison of delta priming in COCA74P and COCA74M. Data represent mean of 2 replicates. (E) Delta priming of 17-DMAG for COCA74P and COCA74M. Each point represents an independent experiment. Lines represent mean of N = 2 experiments. (F) Delta priming of abexinostat for COCA74P and COCA74M. Each point represents an independent experiment. Lines represent mean of N = 2 experiments.
Fig. 4:
Fig. 4:. Evolution of apoptotic chemical vulnerabilities in cell culture conditions measured by HT-DBP.
(A) Comparison of freshly isolated MMTV-PyMT tumors with cells cultured ex vivo for one month. Compounds that inhibit HSP90 are colored blue. Compounds that inhibit mTOR are colored green. Grey dotted lines indicate 3 standard deviations of DMSO treated wells. R2 = 0.38 by Pearson analysis. Data are means of two independent screens. (B) Identity of compounds that primed the freshly isolated tumor only, the cell line only, or both. This analysis only evaluated compounds that did not prime healthy cells for apoptosis. (C to E) Comparison of delta priming by (C) 17-DMAG, (D) AZD2014, and (E) navitoclax on freshly isolated MMTV-PyMT tumor cells cultured ex vivo for one month. Each point represents an independent experiment. Lines represent mean of N = 2 experiments. (F and G) Comparison of drug-induced delta priming in (F) COCA74P and (G) COCA61 cells at days 1 and 8 after tumor extraction. Data are means of triplicates.
Fig. 5:
Fig. 5:. Identification of apoptotic sensitizers in primary colon cancer using HT-DBP.
(A) Representative image of Hoechst 33342 (blue), EpCam immunofluorescence (red) and cytochrome c immunofluorescence (green) in a primary colon tumor after 24 hours of ex vivo DMSO treatment and after a BH3 profile. Scale bars, 75 μm. (B) HT-DBP on colon tumors (n=3) using a limited panel of compounds at concentrations of 100 nM, 250 nM and 500 nM. (C) Images of cytochrome c loss in colon tumors using DBP with of the Bcl-XL inhibitor A-1331852. Scale bars, 50 μm. (D) Images of cytochrome c loss in Colon-01 and cytochrome c retention in Colon-02 tumors using DBP of the MEK inhibitor trametinib. Scale bars, 50 μm. Images are representative of 3 replicates.

References

    1. Flaherty KT, Puzanov I, Kim KB, Ribas A, McArthur GA, Sosman JA, O’Dwyer PJ, Lee RJ, Grippo JF, Nolop K, and Chapman PB. 2010. Inhibition of mutated, activated BRAF in metastatic melanoma. The New England journal of medicine 363: 809–819. - PMC - PubMed
    1. Paez JG, Janne PA, Lee JC, Tracy S, Greulich H, Gabriel S, Herman P, Kaye FJ, Lindeman N, Boggon TJ, Naoki K, Sasaki H, Fujii Y, Eck MJ, Sellers WR, Johnson BE, and Meyerson M.. 2004. EGFR mutations in lung cancer: correlation with clinical response to gefitinib therapy. Science 304: 1497–1500. - PubMed
    1. Aguirre AJ, Nowak JA, Camarda ND, Moffitt RA, Ghazani AA, Hazar-Rethinam M, Raghavan S, Kim J, Brais LK, Ragon D, Welch MW, Reilly E, McCabe D, Marini L, Anderka K, Helvie K, Oliver N, Babic A, Da Silva A, Nadres B, Van Seventer EE, Shahzade HA, St Pierre JP, Burke KP, Clancy T, Cleary JM, Doyle LA, Jajoo K, McCleary NJ, Meyerhardt JA, Murphy JE, Ng K, Patel AK, Perez K, Rosenthal MH, Rubinson DA, Ryou M, Shapiro GI, Sicinska E, Silverman SG, Nagy RJ, Lanman RB, Knoerzer D, Welsch DJ, Yurgelun MB, Fuchs CS, Garraway LA, Getz G, Hornick JL, Johnson BE, Kulke MH, Mayer RJ, Miller JW, Shyn PB, Tuveson DA, Wagle N, Yeh JJ, Hahn WC, Corcoran RB, Carter SL, and Wolpin BM. 2018. Real-time Genomic Characterization of Advanced Pancreatic Cancer to Enable Precision Medicine. Cancer Discov 8: 1096–1111. - PMC - PubMed
    1. Letai A. 2017. Functional precision cancer medicine-moving beyond pure genomics. Nat Med 23: 1028–1035. - PubMed
    1. Burstein HJ, Mangu PB, Somerfield MR, Schrag D, Samson D, Holt L, Zelman D, Ajani JA, and American O. Society of Clinical. 2011. American Society of Clinical Oncology clinical practice guideline update on the use of chemotherapy sensitivity and resistance assays. Journal of clinical oncology : official journal of the American Society of Clinical Oncology 29: 3328–3330. - PubMed

Publication types