. 2020 Jun 16;11(1):3045.
doi: 10.1038/s41467-020-16853-x.

Intragenic recruitment of NF-κB drives splicing modifications upon activation by the oncogene Tax of HTLV-1

Affiliations

Intragenic recruitment of NF-κB drives splicing modifications upon activation by the oncogene Tax of HTLV-1

Lamya Ben Ameur et al. Nat Commun. .

Abstract

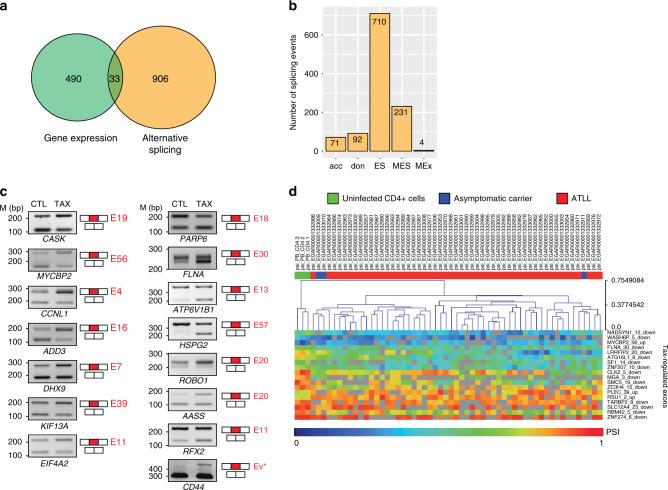
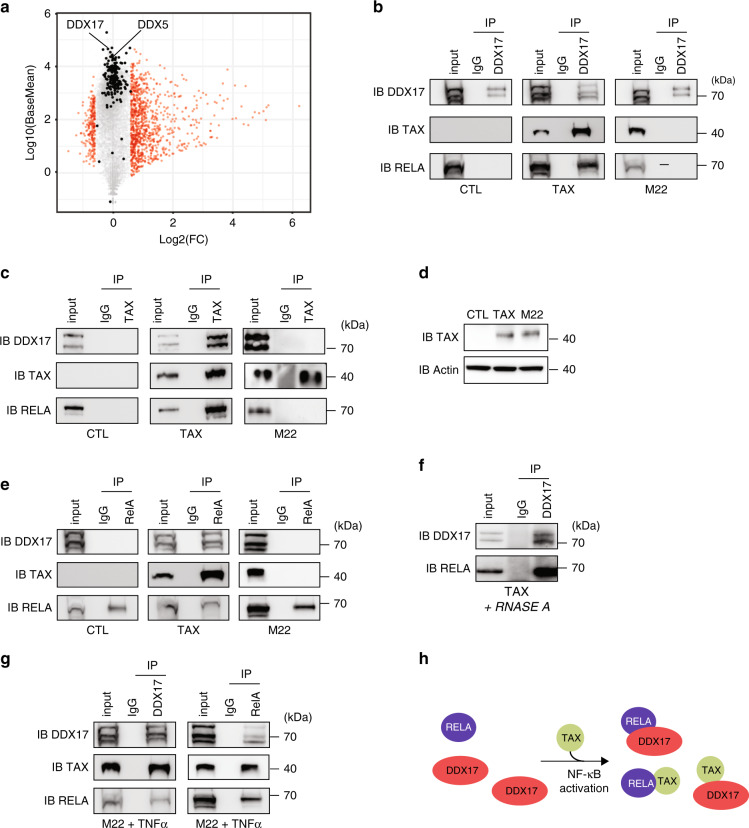
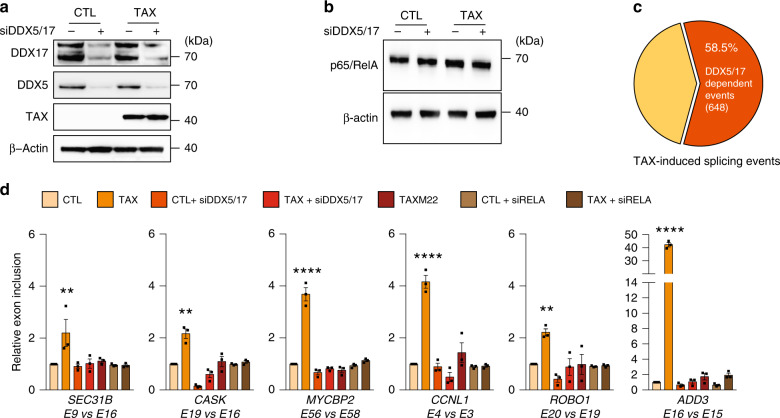
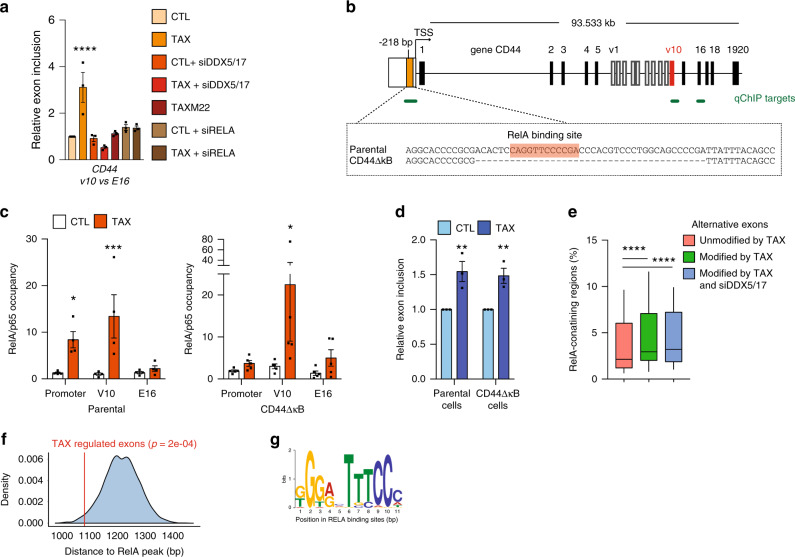
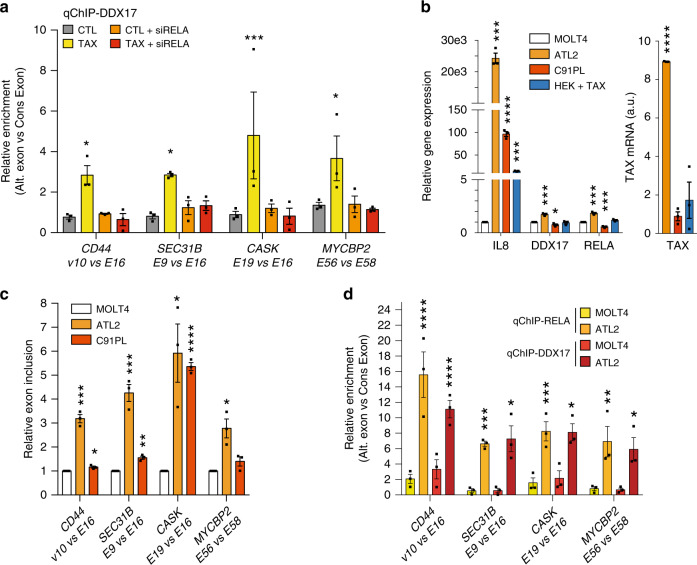
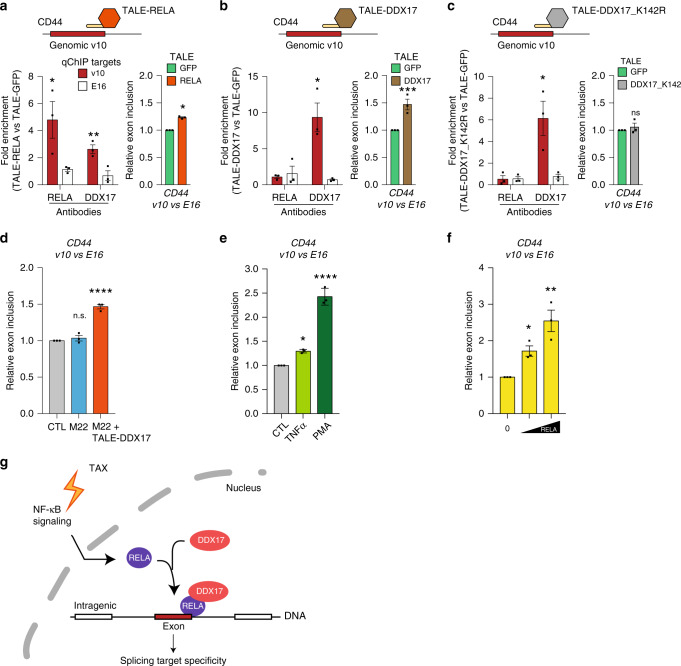
Chronic NF-κB activation in inflammation and cancer has long been linked to persistent activation of NF-κB-responsive gene promoters. However, NF-κB factors also massively bind to gene bodies. Here, we demonstrate that recruitment of the NF-κB factor RELA to intragenic regions regulates alternative splicing upon NF-κB activation by the viral oncogene Tax of HTLV-1. Integrative analyses of RNA splicing and chromatin occupancy, combined with chromatin tethering assays, demonstrate that DNA-bound RELA interacts with and recruits the splicing regulator DDX17, in an NF-κB activation-dependent manner. This leads to alternative splicing of target exons due to the RNA helicase activity of DDX17. Similar results were obtained upon Tax-independent NF-κB activation, indicating that Tax likely exacerbates a physiological process where RELA provides splice target specificity. Collectively, our results demonstrate a physical and direct involvement of NF-κB in alternative splicing regulation, which significantly revisits our knowledge of HTLV-1 pathogenesis and other NF-κB-related diseases.


Conflict of interest statement

The authors declare no competing interests.

Figures

Fig. 1
Fig. 1. Tax induces alternative splicing modifications independently of its transcriptional effects.
a Genes regulated at the steady-state expression level and at the splicing level upon Tax expression in HEK cells. The significance thresholds were typically set to 10% for ∆PSI (differential percentage of spliced-in sequence) and 0.6 for log2-gene expression changes (p < 0.05, Fisher’s exact test), respectively. b Different alternative splicing events induced by Tax: alternative acceptor (acc), alternative donor (don), exon skipping (ES), multi-exon skipping (MES), and multi-exclusive exon skipping (MEx). c Validation of alternative splicing predictions by RT-PCR (using 35 cycles). The exon number is indicated in red. CD44 full variants (Ev*) were assessed using primers C13 and C12A (Supplementary Fig. 5). Representative image from three independent experiments is shown. d Exon-based hierarchical clustering. Kruskal–Wallis ANOVA (p < 0.05) was carried out with Mev4.0 software (http://www.tm4.org/) using the PSI values of exons that share similar regulations upon Tax and in clinical samples (EGAS00001001296). Only the most significant exon regulations are presented. Source data are provided as a Source Data file.
Fig. 2
Fig. 2. Physical interactions between Tax, RELA, and DDX17 in an NF-kB dependent manner.
a Mean average plot (n = 3, p < 0.05) of cellular gene expressions upon Tax. Each gene is plotted according to its expression level (log10(BaseMean) from DESeq2 analysis) and to fold change (log2-FC) upon Tax. Red dots show significant gene expression changes in HEK cells (log2-FC > 0.6, p < 0.05, Fisher’s exact test). Black dots highlight genes encoding splicing factors. DDX5 and DDX17 are indicated. b Immunoprecipitation assays (IP) were carried out in HEK cells using isotype IgG or anti-DDX17 (b, g), anti-RELA (e, g), and anti-Tax (c, g) antibodies, followed by immunoblotting (IB) with indicated antibodies. d Western blot analysis of Tax and M22 expression 48-h post-transfection. f RNA-free IP assays. g TNFa exposure of M22-expressing cells promotes RELA–DDX17 interactions. h Model of NF-κB-dependent interplay between Tax, RELA, and DDX17. For bg, a representative image from three independent experiments is shown. Source data are provided as a Source Data file.
Fig. 3
Fig. 3. DDX5/17 regulates Tax splicing targets in an NF-kB-dependent manner.
a Western blot analysis of DDX5 and DDX17 expression in HEK cells expressing or not Tax and depleted or not of DDX5 and DDX17 by siRNA. b Western blot analysis of RELA and β-actin upon Tax expression and siRNA-DDX5/17 delivery. c Splicing events modified upon the depletion of DDX5/17 in Tax-positive HEK cells. The significant threshold was set to ≥2 in comparisons between TaxvsCTL and TaxsiDDX5/17vsCTL. For b and c, a representative image from three independent experiments is shown. d Validation of alternative splicing predictions of a set of Tax- and DDX5/17-regulated exons. TaxM22 and siRNA-mediated RELA depletion were used in order to assess the dependency of splicing events on NF-κB activation. Histograms represent the results of exon-specific quantitative RT-PCR measurements computed as a relative exon inclusion (alternatively spliced exon vs constitutive exon reflecting the total gene expression level). All genes but MYCBP2 were unmodified at the whole transcript level upon Tax expression (Supplementary Fig. 2c). Data are presented as the mean ± SEM values from biological replicates. Each black square represents a biological replicate. Statistical significance was determined with two-way ANOVA followed by Fisher’s LSD test (**p < 0.01, ****p < 0.0001). Exact p-values for Tax vs CTL: 0.0068 for SEC31B; 0.0084 for CASK; <0.0001 for MYCBP2; <0.0001 for CCNL1; 0.0063 for ROBO1; <0.0001 for ADD3. Source data are provided as a Source Data file.
Fig. 4
Fig. 4. Intragenic RELA-binding sites associate with alternative splicing events.
a Alternative splicing modifications of the CD44 exon v10 upon in HEK cells expressing or not Tax and knocked down or not for RELA or DDX5/17 expressions. TaxM22 and siRNA-mediated RELA depletion were used to assess the dependency of splicing events after NF-κB activation. Histograms represent the results of exon-specific quantitative RT-PCR measurements computed as a relative exon inclusion (alternatively spliced exon vs constitutive exon reflecting the total gene expression level). b Schematic representation of the human CD44 gene. Black and white boxes represent constitutive and alternative exons, respectively, as previously annotated (50). The orange box represents the kB site localized at –218 bp from the TSS and the 40 bp fragment deleted by CRISPR/Cas9 in CD44ΔkB HEK cells. c qChIP analysis of RELA occupancy across the promoter, the exon v10, and the constitutive exon E16 of CD44. RELA enrichment is expressed as the fold-increase in signal relative to the background signal obtained using a control IgG. d Relative exon inclusion of CD44 exon v10 was quantified by qRT-PCR in parental cells and its CD44∆kB counterparts. e Distribution of alternative exons that are regulated or not by Tax and DDX5/17 in RELA-enriched intragenic regions. The analysis was restricted to alternative exons expressed in HEK cells and regulated or not by Tax. Boxes extend from the 25th to 75th percentiles, the mid line represents the median and the whiskers indicate the maximum and the minimum values. f Bootstrapped distribution of median distance between intragenic RELA peaks and either Tax-regulated exons (red line, 1079 bp) or randomly chosen exons (105 repetitions) (blue). p-values were determined by sample t-test. g Consensus de novo motif for RELA-binding sites <1 kb of Tax-regulated exons. Data are presented as the mean ± SEM values from biological replicates. Each black square represents a biological replicate. Statistical significance was determined with two-way ANOVA followed by Fisher’s LSD test (*p < 0.05, **p < 0.01, ***p < 0.001) (a, c, and d) and two-tailed Wilcoxon test (e, ****p < 0.0001). Exact p-values for Tax vs CTL: a <0.0001, c parental, promoter: 0.0248 and V10: 0.0005; CD44∆kB, V10: 0.021; d parental: 0.0028; CD44∆kB: 0.0054. Source data are provided as a Source Data file.
Fig. 5
Fig. 5. RELA locally recruits DDX17 at the genomic target exons, leading to splicing regulation.
a Relative occupancy of DDX17 at Tax-regulated genomic exons in cells that did or did not express Tax and knocked down or not with RELA-specific siRNA. b Relative gene expression levels of IL8, DDX17, and RELA in ATL2, C91PL, or HEK cells transiently transfected by pSG5M-Tax as compared uninfected MOLT4 cells. Tax mRNAs levels are expressed in arbitrary units (a.u.). c Alternative splicing modifications in the HTLV-1-infected cell lines ATL2 and C91PL as compared to those in the uninfected cell line MOLT4. Relative exon inclusion was measured as described in Fig. 3. d Relative RELA and DDX17 occupancies of regulated exons in ATL2 cells as compared to MOLT4 cells. Each occupancy of regulated exon by RELA and DDX17 is represented as a fold of that measured at its neighboring constitutive exon. Source data are provided as a Source Data file. Data are presented as the mean ± SEM values from biological replicates. Each black square represents a biological replicate. Statistical significance was determined with two-way ANOVA followed by Fisher’s LSD test (a, d) and two-tailed unpaired t-test (b, c) (*p < 0.05, **p < 0.01, ***p < 0.001, ****p < 0.0001). Exact p-values for Tax vs CTL (a): 0.0312 (CD44), 0.0337 (SEC31B), 0.0002 (CASK), 0.0171 (MYCBP2). Exact p-values for ATL2- and C91PL vs MOLT4 (b): 0.0001, 0.0004, 0.0003 and <0.0001, 0.0365, 0.0007 corresponding to IL8, DDX17, and RELA, respectively. For Tax expression, p = 0.0016 HEK + Tax vs ATL2. Exact p-values for ATL2- and C91PL vs MOLT4 (c): 0.0002, 0.0008, 0.0153, 0.0105 and 0.019, 0.0013, <0.0001, 0.11 for CD44, SEC31B, CASK, and MYCBP2 respectively. Exact p-values (d) for ATL2 vs MOLT4: qChIP-RELA < 0.0001 (CD44), 0.0003 (SEC31B), 0.0004 (CASK), 0.0029 (MYCBP2); qChIP-DDX17 0.0004 (CD44), 0.0211 (SEC31B), 0.0207 (CASK), 0.0184 (MYCBP2). Source data are provided as a Source Data file.
Fig. 6
Fig. 6. Chromatin relationship between RELA and DDX17.
ac Chromatin and splicing regulation upon TALE-mediated tethering of RELA and DDX17. The TALE domain was designed to bind the v10 exon of CD44 and fused to either GFP (ac), RELA (a), DDX17, (b), or a helicase-deficient mutant DDX17_K142R (c). The effect of TALEs on RELA and DDX17 chromatin enrichment (left panels) and on the relative v10 exon inclusion (right panels) was monitored in HEK cells by qChIP and qRT-PCR, respectively. Results were normalized to measures obtained in TALE-GFP assays. (d) Relative exon inclusion rate of exon v10 of CD44 in HEK cells expressing or not the Tax mutant M22 and the TALE-DDX17 construct. e Relative exon inclusion rate of exon v10 of CD44 in HEK cells exposed to TNFα and PMA. f Relative exon inclusion rate of exon v10 of CD44 in HEK cells transiently transfected with increasing amounts of RELA expression vector (200 and 500 ng). g Model of NF-κB-dependent regulation of alternative splicing. Upon NF-κB activation, DNA-bound RELA proteins act as chromatin anchors for DDX17, which then provides splicing target specificity due to its RNA helicase activity. Data are presented as the mean ± SEM values from biological replicates. Each black square represents a biological replicate. Statistical significance was determined with two-tailed unpaired t-test (qChIP in ac) and one-way ANOVA followed by Fisher’s LSD test (relative exon inclusion (REI) in af) (*p < 0.05, **p < 0.01, ***p < 0.001, ****p < 0.0001). In ac, exact p-values for TALE-RELA vs TALE-GFP on V10: 0.049 (qChiP RELA), 0.0079 (qChIP DDX17), 0.0276 (REI). Exact p-values for TALE-DDX17 vs TALE-GFP on V10: 0.0139 (qChIP DDX17), 0.0276 (REI). Exact p-values for TALE-DDX17_K142R vs TALE-GFP on V10: 0.0312 (qChIP DDX17). In df, exact p-values are <0.0001 (M22 + TALE-DDX17 (d)), 0.0125 (TNFa (e)), <0.0001 (PMA (e)), 0.0369 (0.2 µg (f)), 0.0012 (0.5 µg (f)). Source data are provided as a Source Data file.

References

    1. Uchiyama T, Yodoi J, Sagawa K, Takatsuki K, Uchino H. Adult T-cell leukemia: clinical and hematologic features of 16 cases. Blood. 1977;50:481–492. - PubMed
    1. Gessain A, et al. Antibodies to human T-lymphotropic virus type-I in patients with tropical spastic paraparesis. Lancet. 1985;2:407–410. - PubMed
    1. Vernin C, et al. HTLV-1 bZIP factor HBZ promotes cell proliferation and genetic instability by activating OncomiRs. Cancer Res. 2014;74:6082–6093. - PubMed
    1. Thenoz M, et al. HTLV-1-infected CD4+ T-cells display alternative exon usages that culminate in adult T-cell leukemia. Retrovirology. 2014;11:119. - PMC - PubMed
    1. Naftelberg S, Schor IE, Ast G, Kornblihtt AR. Regulation of alternative splicing through coupling with transcription and chromatin structure. Annu Rev. Biochem. 2015;84:165–198. - PubMed

Publication types

MeSH terms