. 2020 Jun 16;10(1):191.
doi: 10.1038/s41398-020-00876-5.

Prenatal stress causes intrauterine inflammation and serotonergic dysfunction, and long-term behavioral deficits through microbe- and CCL2-dependent mechanisms

Affiliations

Prenatal stress causes intrauterine inflammation and serotonergic dysfunction, and long-term behavioral deficits through microbe- and CCL2-dependent mechanisms

Helen J Chen et al. Transl Psychiatry. .

Abstract

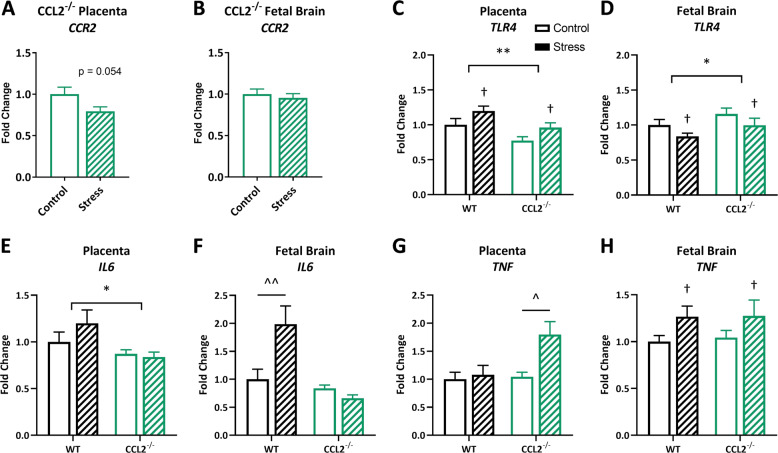
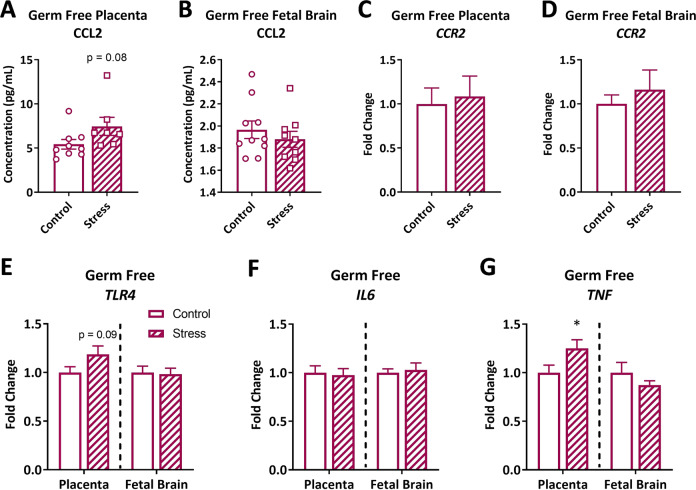
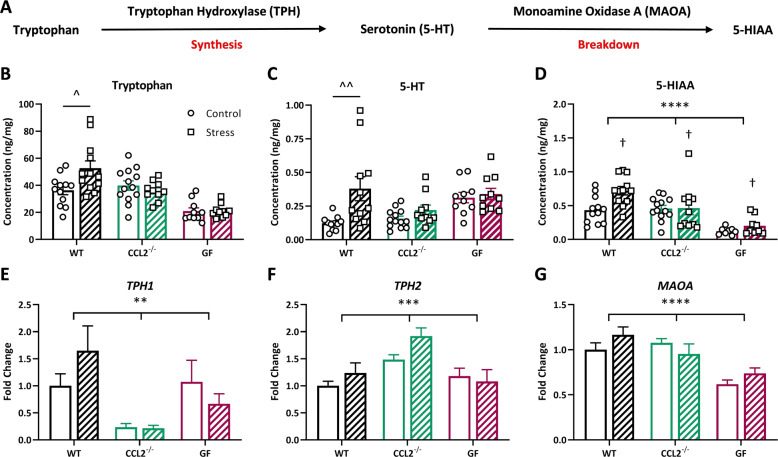
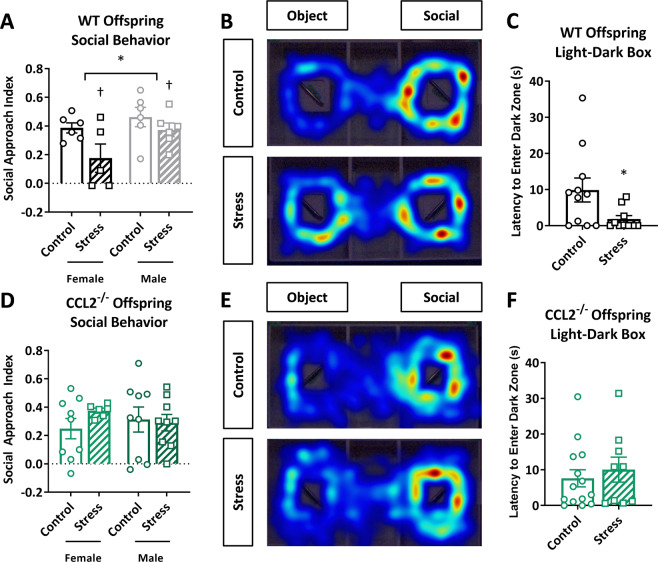
Prenatal stress (PNS) is associated with neuropsychiatric disorders in offspring, including anxiety, depression, and autism spectrum disorders. There is mounting evidence that these behavioral phenotypes have origins in utero. Maternal microbes, inflammation, and serotonergic dysfunction have been implicated as potential mediators of the behavioral consequences of PNS; whether and how these systems interact is unclear. Here, we examine the effects of PNS in utero using late-gestation maternal restraint stress in wild-type (WT), germ-free (GF), and CCL2-/- genetic knock-out (KO) mice. In WT mice, PNS leads to placental and fetal brain inflammation, including an elevation in the chemokine CCL2. This inflammation is largely absent in GF mice, indicating the critical role of maternal microbes in mediating immune processes in utero. Furthermore, PNS in the absence of CCL2 failed to increase pro-inflammatory cytokine IL-6 in the fetal brain. PNS offspring also exhibited deficits in sociability and anxiety-like behavior that were absent in CCL2-/- PNS offspring. Tryptophan and serotonin (5-HT) were elevated in the WT PNS placenta, but not in CCL2-/- and GF animals. Altogether, these findings suggest that a complex interaction between maternal microbes, inflammation, and serotonin metabolism regulates the emergence of behavioral abnormalities following PNS.


Conflict of interest statement

The authors declare that they have no conflict of interest.

Figures

Fig. 1
Fig. 1. Prenatal stress leads to alterations in the CCL2–CCR2 axis in the intrauterine environment.
a WT, CCL2−/−, and GF pregnant mice were exposed to restraint stress for 2 h daily from GD10 to GD16. Placental and fetal brain tissue were collected from Group 1 animals on GD17. In Group 2, dams underwent parturition, and behavior of the WT and CCL2−/− offspring was assessed at 10 weeks of age. CCL2 protein concentration in WT b placental (n = 14/7, 16/8 samples/litters in control, stress conditions) and c fetal brain (n = 16/5, 16/7 samples/litters in control, stress conditions) lysates. CCR2 gene expression in WT d placentas (n = 15/9, 15/8 samples/litters in control, stress conditions) and e fetal brains (n = 14/9, 17/8 samples/litters in control, stress conditions). Bars represent mean ± SEM. T test: *p < 0.05. WT = wild type; GF = germ free; GD = gestational day.
Fig. 2
Fig. 2. Prenatal stress increases fetal brain IL6 in a CCL2-dependent manner.
CCR2 gene expression in CCL2−/−a placentas (n = 13/7, 13/5 samples/litters in control, stress conditions) and b fetal brains (n = 16/8, 13/5 samples/litters in control, stress conditions) following stress. Gene expression of the pattern recognition receptor TLR4 in the WT and CCL2−/− placenta (n = 15/8, 16/8, 14/8, 13/5 samples/litters in WT control, WT stress, CCL2−/− control, CCL2−/− stress conditions) (c) and fetal brain (n = 14/8, 18/8, 15/8, 13/5 samples/litters in WT control, WT stress, CCL2−/− control, CCL2−/− stress conditions) (d). Gene expression of pro-inflammatory cytokines e, fIL6 and g, hTNF in the WT and CCL2−/− placenta (IL6: n = 16/9, 14/8, 14/8, 13/5; TNF: n = 16/9, 16/8, 14/8, 13/5 samples/litters in WT control, WT stress, CCL2−/− control, CCL2−/ stress conditions) and fetal brain (IL6: n = 14/9, 15/7, 16/8, 12/5; TNF: n = 15/9, 14/8, 16/8, 13/5 samples/litters in WT control, WT stress, CCL2−/− control, CCL2−/− stress conditions), respectively. Bars represent mean ± SEM. Two-way ANOVA: asterisks (*) represent main effect of genotype (*p < 0.05; **p < 0.01); daggers (†) represent main effect of stress (†p < 0.05); carets (^) represent stress × genotype interaction with the significant Tukey post hoc test (^p < 0.05; ^^p < 0.01).
Fig. 3
Fig. 3. In the absence of microbes, prenatal stress does not induce intrauterine inflammation.
CCL2 protein concentration in GF a placental (n = 9/5, 7/5 samples/litters in control, stress conditions) and b fetal brain lysates (n = 10/5, 9/5 samples/litters in control, stress conditions). CCR2 gene expression in the c placenta (n = 13/5, 14/6 samples/litters in control, stress conditions) and d fetal brain (n = 11/5, 12/6 samples/litters in control, stress conditions) following stress in GF dams. eTLR4 gene expression in the GF placenta and fetal brain (placenta: n = 13/5, 14/6; fetal brain: n = 12/5, 14/6 samples/litters in control, stress conditions). Gene expression of pro-inflammatory cytokines fIL6 (placenta: 12/5, 13/6; fetal brain: n = 11/5, 14/6 samples/litters in control, stress conditions) and gTNF (placenta:n = 12/5, 14/6; fetal brain: n = 12/5, 13/6 samples/litters in control, stress conditions) in the GF placenta and fetal brain. Dashed lines separate placental and fetal brain gene expression data, which were analyzed separately. Bars represent mean ± SEM. T test: *p < 0.05.
Fig. 4
Fig. 4. Placental tryptophan and serotonin availability is dependent upon CCL2 and microbes.
a Tryptophan hydroxylase (TPH) metabolizes tryptophan to serotonin, which is then broken down into 5-HIAA by monoamine oxidase A (MAOA). b Concentration of tryptophan in WT (n = 12/7, 12/7 samples/litters in control, stress conditions), CCL2−/− (n = 13/7, 10/5 samples/litters in control, stress conditions), and GF (n = 10/5, 10/6 samples/litters in control, stress conditions) mice following exposure to restraint stress. c Concentration of 5-HT in WT (n = 11/6, 11/7 samples/litters in control, stress conditions), CCL2−/− (n = 13/7, 10/5 samples/litters in control, stress conditions), and GF (n = 10/5, 10/6 samples/litters in control, stress conditions) placentas. d Concentration of 5-HIAA in WT (n = 12/7, 12/7 samples/litters in control, stress conditions), CCL2−/− (n = 13/7, 11/5 samples/litters in control, stress conditions), and GF (n = 8/5, 9/6 samples/litters in control, stress conditions) placentas. Expression of eTPH1 (n = 16/9, 14/8, 11/7, 8/5, 13/5, 14/6 samples/litters in WT control, WT stress, CCL2−/− control, CCL2−/− stress, GF control, GF stress conditions) and fTPH2 (n = 14/9, 15/8, 10/4 12/5, 10/5, 9/6 samples/litters in WT control, WT stress, CCL2−/− control, CCL2−/− stress, GF control, GF stress conditions), two isoforms of TPH present in the placenta. gMAOA gene expression (n = 16/9, 16/8, 14/8, 13/5, 13/5, 14/6 samples/litters in WT control, WT stress, CCL2−/− control, CCL2−/− stress, GF control, GF stress conditions). Bars represent mean ± SEM. Two-way ANOVA: asterisks (*) represent main effect of genotype (**p < 0.01; ***p < 0.001; ****p < 0.0001); daggers (†) represent main effect of stress (†p < 0.05); carets (^) represent stress × genotype interaction with the significant Tukey post hoc test (^p < 0.05; ^^p < 0.01).
Fig. 5
Fig. 5. Prenatal stress leads to CCL2-dependent behavioral abnormalities in adult offspring.
WT offspring: a social approach index in the three-chamber social behavior test (n = 6, 5, 6, 6 mice in female control, female stress, male control, male stress conditions); b representative heat maps of time spent exploring the three chambers in the social behavior test; c latency to enter the dark chamber of the light–dark box (n = 11, 10 mice in control, stress conditions). CCL2−/− offspring: d social approach index (n = 9, 6, 9, 9 mice in female control, female stress, male control, male stress conditions); e representative heat maps of the social behavior test; f latency to enter the dark chamber of the light–dark box (n = 13, 9 mice in control, stress conditions). Bars represent mean ± SEM. T test: *p < 0.05. Two-way ANOVA: asterisks (*) represent main effect of sex (*p < 0.05); daggers (†) represent main effect of stress (†p < 0.05).

References

    1. Bale TL, et al. Early life programming and neurodevelopmental disorders. Biol. Psychiatry. 2010;68:314–319. - PMC - PubMed
    1. Van den Bergh BRH, et al. Prenatal developmental origins of behavior and mental health: the influence of maternal stress in pregnancy. Neurosci. Biobehav Rev. 2017;S0149-7634:30734–30735. - PubMed
    1. Beversdorf DQ, Stevens HE, Jones KL. Prenatal STress, Maternal Immune Dysregulation, and Their Association with Autism Spectrum Disorders. Curr. Psychiatry Rep. 2018;20:76. - PMC - PubMed
    1. Gur TL, et al. Prenatal stress disrupts social behavior, cortical neurobiology and commensal microbes in adult male offspring. Behav. Brain Res. 2019;359:886–894. - PMC - PubMed
    1. Gur TL, et al. Prenatal stress affects placental cytokines and neurotrophins, commensal microbes, and anxiety-like behavior in adult female offspring. Brain Behav. Immun. 2017;64:50–58. - PubMed

Publication types