. 2020 Jun 16;10(1):9743.
doi: 10.1038/s41598-020-66747-7.

Assessment of Luminal and Basal Phenotypes in Bladder Cancer

Affiliations

Assessment of Luminal and Basal Phenotypes in Bladder Cancer

Charles C Guo et al. Sci Rep. .

Abstract

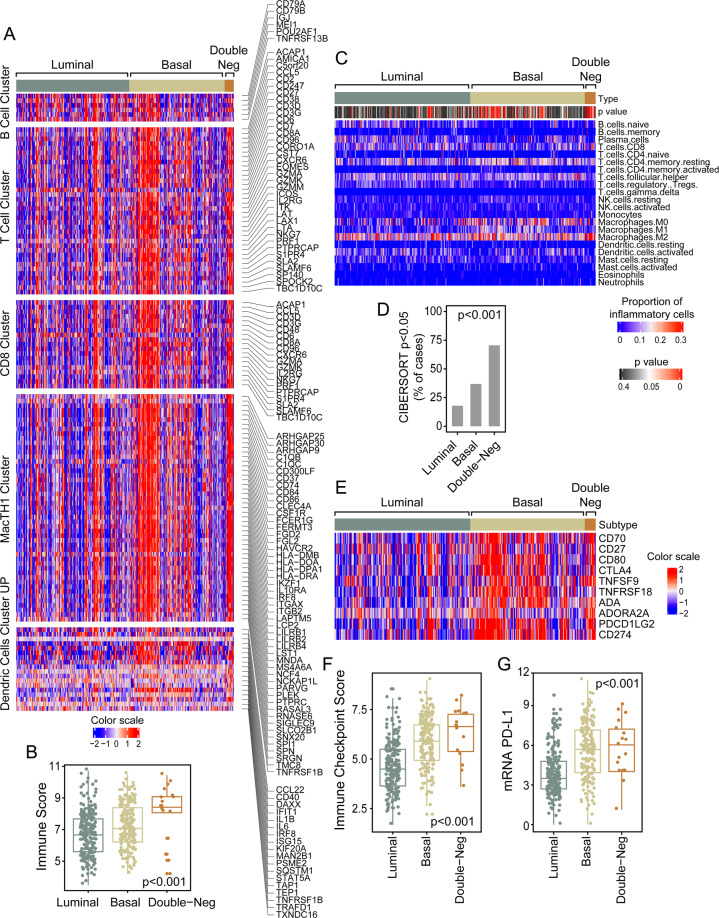
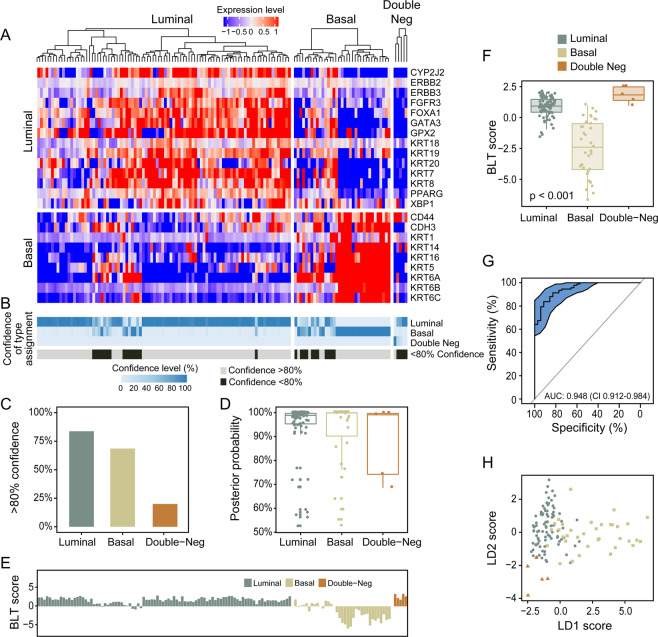
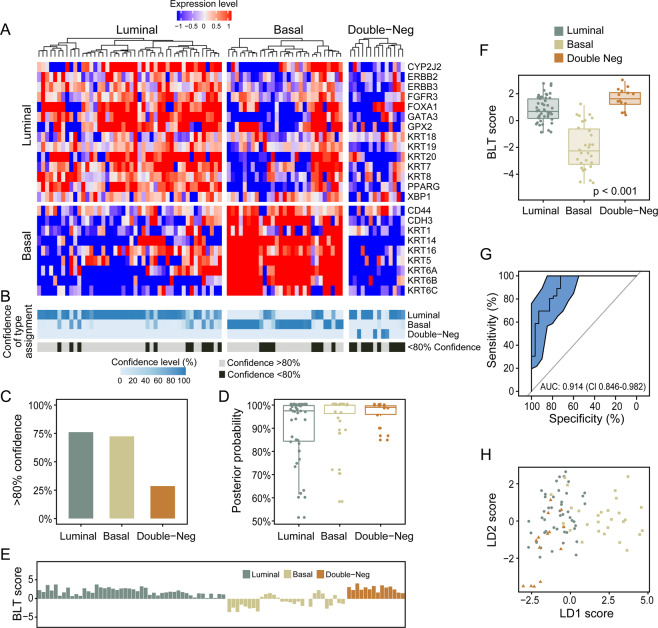
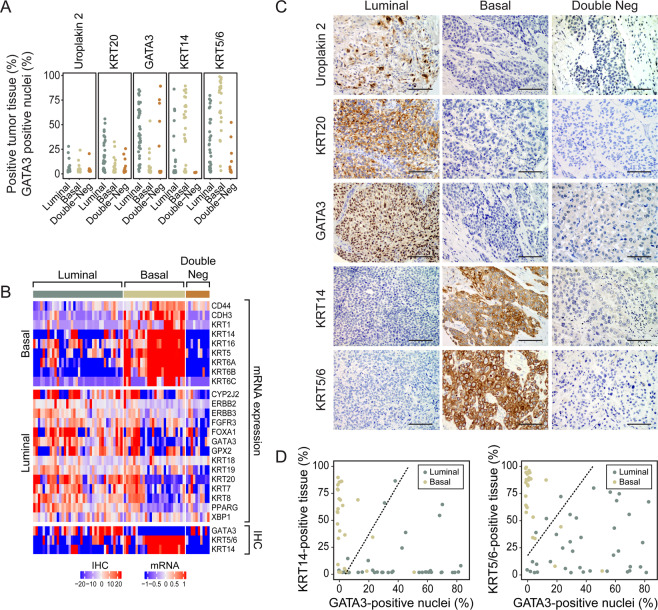
Genomic profiling studies have demonstrated that bladder cancer can be divided into two molecular subtypes referred to as luminal and basal with distinct clinical behaviors and sensitivities to frontline chemotherapy. We analyzed the mRNA expressions of signature luminal and basal genes in bladder cancer tumor samples from publicly available and MD Anderson Cancer Center cohorts. We developed a quantitative classifier referred to as basal to luminal transition (BLT) score which identified the molecular subtypes of bladder cancer with 80-94% sensitivity and 83-93% specificity. In order to facilitate molecular subtyping of bladder cancer in primary care centers, we analyzed the protein expressions of signature luminal (GATA3) and basal (KRT5/6) markers by immunohistochemistry, which identified molecular subtypes in over 80% of the cases. In conclusion, we provide a tool for assessment of molecular subtypes of bladder cancer in routine clinical practice.


Conflict of interest statement

The authors declare no competing interests.

Figures

Figure 1
Figure 1
Organizational flow-chart of analyses on different cohorts of bladder cancer samples. The TCGA cohort (n = 408) was used as a training set to develop the BLT scores. None of the cases of the MDACC fresh frozen cohort (n = 132) and MDACC FFPE cohort (n = 89) used as validation for the BLT score overlapped with the TCGA. A part of the MDACC FFPE cohort (n = 74) was used to construct the tissue microarray in which the expression of selected luminal and basal markers was validated by quantitative image analysis. The MDACC cohort of whole-mount sections (n = 74) corresponded to the MDACC fresh frozen cohort was used for semi-quantitative assessment of immunohistochemical classifier of molecular subtypes.
Figure 2
Figure 2
Whole-transcriptome mRNA expression profiling of the TCGA bladder cancer cohort (n = 408). (A) Hierarchical clustering with luminal and basal markers. (B) Prediction strengths of molecular subtypes. (C) Proportion of cases with >80% prediction strength of the molecular subtypes. (D) Box plot analysis of prediction strengths for individual cases by posterior probability. (E) Basal to luminal transition (BLT) scores in molecular subtypes of bladder cancer. (F) Box plot analysis of BLT scores in molecular subtypes of bladder cancer. (G) ROC curve of BLT scores segregating luminal and basal subtypes of bladder cancer. (H) Scatter plot of two-dimensional linear discriminant LD1 and LD2 scores in luminal, basal, and double-negative subtypes of bladder cancer. The panels in A and B were generated using the R package ComplexHeatmap (version 1.14.0). Panels C, D, E, F, and H were generated using the R package ggplot2 (version 3.2.1). Panel G was generated with pRoc (version 1.8).
Figure 3
Figure 3
Dysregulation of the EMT network in the TCGA bladder cancer cohort (n = 408). (A) Expression pattern of representative genes in the EMT regulatory network. (B) EMT scores in molecular subtypes of bladder cancer. (C) Box plot of EMT scores in molecular subtypes of bladder cancer. (D) Box plot analyses of expression levels of a signature transcription factor (ZEB2) and adhesion molecules (CDH1 and CLDN1) involved in EMT. Panel A was generated using the R package ComplexHeatmap (version 1.14.0). Panels B–D were generated using the R package ggplot2 (version 3.2.1).
Figure 4
Figure 4
Immune signature in the TCGA bladder cancer cohort (n = 408). (A) Expression pattern of immune cell infiltrate in molecular subtypes of bladder cancer. Top to bottom: B cell, T cell, CD8, MacTH1, and dentritic cell expression clusters. Boxed areas identify samples with enrichment of immune cell infiltrate. (B) Box plot of immune scores calculated using the expression profile shown in A in molecular subtypes of bladder cancer. (C) Heatmap of CIBERSORT scores for 22 immune cell types in molecular subtypes of bladder cancer. (D) Proportion of cases with significant CIBERSORT score in molecular subtypes of bladder cancer. (E) Expression of immune checkpoint genes in molecular subtypes of bladder cancer. (F) Box plot of immune checkpoint scores calculated using the gene expression profile in (E). (G) Box plot of mRNA PD-L1 expression levels in molecular subtypes of bladder cancer. Panels A, C, and E were generated using the R package ComplexHeatmap (version 1.14.0). Panels B, D, F, and G were generated using the R package ggplot2 (version 3.2.1).
Figure 5
Figure 5
Whole-trancriptome mRNA expression profiling of the MDACC fresh frozen bladder cancer cohort (n = 132). (A) Hierarchical clustering with luminal and basal markers. (B) Prediction strengths of molecular subtypes. (C) Proportion of cases with >80% prediction strength of the molecular subtypes. (D) Box plot analysis of prediction strength for individual cases by posterior probability. (E) BLT scores in molecular subtypes of bladder cancer. (F) Box plot analysis of BLT scores in molecular subtypes of bladder cancer. (G) ROC curve of BLT scores segregating luminal and basal subtypes of bladder cancer. (H) Scatter plot of two-dimensional linear discriminant LD1 and LD2 scores in luminal, basal, and double-negative subtypes of bladder cancer. The panels in a and b were generated using the R package ComplexHeatmap (version 1.14.0). Panels C, D, E, F, and H were generated using the R package ggplot2 (version 3.2.1). Panel G was generated with pRoc (version 1.8).
Figure 6
Figure 6
Whole-transcriptome mRNA expression profiling of the MDACC FFPE bladder cancer cohort (n = 89). (A) Hierarchical clustering with luminal and basal markers. (B) Prediction strengths of molecular subtypes. (C) Proportion of cases with >80% prediction strength of the molecular subtypes. (D) Box plot analysis of prediction strength for individual cases by posterior probability. (E) BLT scores in molecular subtypes of bladder cancer. (F) Box plot analysis of BLT scores in molecular subtypes of bladder cancer. (G) ROC curve of BLT scores segregating luminal and basal subtypes of bladder cancer. (H) Scatter plot of two-dimensional linear discriminant LD1 and LD2 scores in luminal, basal, and double-negative subtypes of bladder cancer. The panels in A and B were generated using the R package ComplexHeatmap (version 1.14.0). Panels C, D, E, F, and H were generated using the R package ggplot2 (version 3.2.1). Panel g was generated with pRoc (version 1.8).
Figure 7
Figure 7
Immunohistochemical analysis of luminal and basal markers in MDACC FFPE bladder cancer cohort (n = 74) on tissue microarrays. (A) Quantitative image-based assessment of immunohistochemical expression levels for selected luminal (Uroplakin 2, KRT20, and GATA3) and basal (KRT14 and KRT5/6) markers. (B) Hierarchical clustering of luminal and basal markers using mRNA expression levels and immunohistochemically (IHC) detected levels of selected luminal (GATA3) and basal (KRT5/6 and KRT14) markers. (C) Examples of immunohistochemical staining patterns for selected luminal and basal markers in molecular subtype of bladder cancer. Solid bars indicate 50 µm. (D) Logistic regression (LRA) analyses of two pairs of immunohistochenical markers: GATA3/KRT14 and GATA3/ KRT5/6. Panels a and d were generated using the R package ggplot2 (version 3.2.1). Panel B was generated using the R package ComplexHeatmap (version 1.14.0).
Figure 8
Figure 8
Immunohistochemical analysis of signature luminal and basal markers in different molecular subtypes of MDACC fresh frozen bladder cancer cohort (n = 74) in routine pathology sections. (A) Hierarchical clustering with luminal and basal markers of 74 cases from MDACC fresh frozen bladder cancer cohort in comparison to immunohistochemical expression patterns of GATA3 and KRT5/6. (B) Examples of immunohistochemical expression patterns of signature luminal (GATA3) and basal (KRT5/6) markers. Solid bars indicate 50 µm. Panel a was generated using the R package Complex Heatmap (version 1.14.0).

References

    1. Dinney CP, et al. Focus on bladder cancer. Cancer Cell. 2004;6:111–116. doi: 10.1016/j.ccr.2004.08.002. - DOI - PubMed
    1. Spiess PE, Czerniak B. Dual-track pathway of bladder carcinogenesis: practical implications. Arch Pathol Lab Med. 2006;130:844–852. doi: 10.1043/1543-2165(2006)130[844:Dpobcp]2.0.Co;2. - DOI - PubMed
    1. Czerniak B, Dinney C, McConkey D. Origins of Bladder Cancer. Annu Rev Pathol. 2016;11:149–174. doi: 10.1146/annurev-pathol-012513-104703. - DOI - PubMed
    1. Guo CC, Czerniak B. Bladder Cancer in the Genomic Era. Arch Pathol Lab Med. 2019;143:695–704. doi: 10.5858/arpa.2018-0329-RA. - DOI - PubMed
    1. Kamat AM, et al. Bladder cancer. Lancet. 2016;388:2796–2810. doi: 10.1016/S0140-6736(16)30512-8. - DOI - PubMed

Publication types

MeSH terms