. 2020 Jun 16;11(1):2829.
doi: 10.1038/s41467-020-16663-1.

The root of anomalously specular reflections from solid surfaces on Saturn's moon Titan

Affiliations

The root of anomalously specular reflections from solid surfaces on Saturn's moon Titan

Jason D Hofgartner et al. Nat Commun. .

Abstract

Saturn's moon Titan has a methane cycle with clouds, rain, rivers, lakes, and seas; it is the only world known to presently have a volatile cycle akin to Earth's tropospheric water cycle. Anomalously specular radar reflections (ASRR) from Titan's tropical region were observed with the Arecibo Observatory (AO) and Green Bank Telescope (GBT) and interpreted as evidence for liquid surfaces. The Cassini spacecraft discovered lakes/seas on Titan, however, it did not observe lakes/seas at the AO/GBT anomalously specular locations. A satisfactory explanation for the ASRR has been elusive for more than a decade. Here we show that the ASRR originate from one terrain unit, likely paleolakes/paleoseas. Titan observations provide ground-truth in the search for oceans on exoearths and an important lesson is that identifying liquid surfaces by specular reflections requires a stringent definition of specular; we propose a definition for this purpose.


Conflict of interest statement

The authors declare no competing interests.

Figures

Fig. 1
Fig. 1. Arecibo Observatory and Green Bank Telescope observations of Saturn’s moon Titan.
ae Example AO/GBT echo spectra of Titan in the opposite circular polarization channel, adapted from Black et al.. The observation date, subradar location on Titan, and maximum-NRCS are in the panel legends. The width of the echo from Titan is indicated by the green line on the x-axis; data beyond the green line are indicative of the noise. All AO/GBT spectra from Titan have a broad, diffuse component with an NRCS of approximately zero at the limits of the echo (endpoints of the green line on the x-axis) that increases toward the center. The NRCS of the central Doppler bin varies drastically between the spectra. Observations with anomalously high peaks (e.g., d and e) are the AO/GBT anomalously specular radar reflections. c Example demonstrating that the maximum-NRCS of some observations may be affected by noise. f Histograms of the maximum-NRCS of AO/GBT observations of Titan reported in Black et al.. The black histogram includes all 83 observations and the red histogram includes only observations where the maximum-NRCS is ≥4 times the standard deviation of the noise (σ), to distinguish between observations with a high maximum-NRCS that may be due to greater noise and those that are confidently anomalous. Two observations have a maximum-NRCS ≥3.5 and are clearly separate from the distribution and thus anomalously specular. Another group of observations, with 1.5 ≈< maximum-NRCS ≤2, is also separate from most observations; these observations are also anomalously specular, albeit less so than the two observations with maximum-NRCS ≥3.5.
Fig. 2
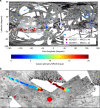
Fig. 2. Map of Titan.
a The monochrome swaths are Cassini RADAR images. The purple and red dots are AO/GBT subradar locations; red dots are locations where the maximum-NRCS was ≥4 standard deviations above the noise. Dot radii are linearly proportional to maximum-NRCS. Colored tracks are Cassini RADAR altimetry observations where color indicates NRCS. There is a high concentration of large, red dots at ≈70–135°W, 15–30°S and many Cassini altimetry observations in this region also have a high NRCS. b Boxed area enlarged. The colorbar applies to both a and b.
Fig. 3
Fig. 3. NRCS as a function of latitude and date for AO/GBT and Cassini altimetry observations.
Panels a, b show AO/GBT observations, like Fig. 19 of Black et al. but the y-axis variable is maximum-NRCS. Panels c, d show Cassini altimetry observations. Panels a, c show latitude and panels b, d show date. Black dots are observations and orange-edged, cyan-filled rectangles are weighted means of the bins. Error bars show one standard deviation of the noise. There is an approximately consistent peak of the cyan/orange bins at ≈23°S between AO/GBT and Cassini and the latitude trends are somewhat similar. There is no agreement in the trends with date. Thus, the anomalously specular AO/GBT observations depend on location, not date.
Fig. 4
Fig. 4. Hotei and Tui Regiones.
a Black areas are Titan’s 5-μm-bright regions as mapped in MacKenzie et al.. Hotei and Tui Regiones are the 5-μm-bright regions at ≈80°W, 25°S and ≈120°W, 25°S. AO/GBT observations are plotted as in Fig. 2. Hotei and Tui Regiones are the main source of the AO/GBT anomalously specular reflections. Two noteworthy exceptions to the strong correlation of anomalously specular AO/GBT observations to Hotei/Tui are labeled NE1 and NE2 and discussed in the Discussion section. b The 18-km subradar track (red line) of the highest maximum-NRCS (and most specular in Black et al.) AO/GBT observation, located in Hotei Regio (largest red dot in Hotei Regio in a). c The stereo topography of the same area. The AO/GBT reflection is from a bright area that is morphologically similar to paleolakes (b) and is topographically low (c). d The 18-km subradar track (red line) of the second highest maximum-NRCS (and second most specular in Black et al.) AO/GBT observation, located in Tui Regio (largest red dot in Tui Regio in a). The AO/GBT reflection is again from a bright area that is morphologically similar to the comparably specular location in Hotei Regio and paleolakes. Stereo topography does not cover this track.

References

    1. Campbell DB, Black GJ, Carter LM, Ostro SJ. Radar evidence for liquid surfaces on Titan. Science. 2003;302:431–434. doi: 10.1126/science.1088969. - DOI - PubMed
    1. Black GJ, Campbell DB, Carter LM. Ground-based radar observations of Titan: 2000–2008. Icarus. 2011;212:300–320. doi: 10.1016/j.icarus.2010.10.025. - DOI
    1. Spilker L. Cassini-Huygens’ exploration of the Saturn system: 13 years of discovery. Science. 2019;364:1046–1051. doi: 10.1126/science.aat3760. - DOI - PubMed
    1. Hayes AG. The lakes and seas of Titan. Annu. Rev. Earth Planet. Sci. 2016;44:57–83. doi: 10.1146/annurev-earth-060115-012247. - DOI
    1. Turtle EP, et al. Rapid and extensive surface changes near Titan’s equator: evidence of april showers. Science. 2011;331:1414–1417. doi: 10.1126/science.1201063. - DOI - PubMed