

Rhizosphere Soil Fungal Communities of Aluminum-Tolerant and -Sensitive Soybean Genotypes Respond Differently to Aluminum Stress in an Acid Soil
- PMID: 32547532
- PMCID: PMC7270577
- DOI: 10.3389/fmicb.2020.01177
Rhizosphere Soil Fungal Communities of Aluminum-Tolerant and -Sensitive Soybean Genotypes Respond Differently to Aluminum Stress in an Acid Soil
Abstract
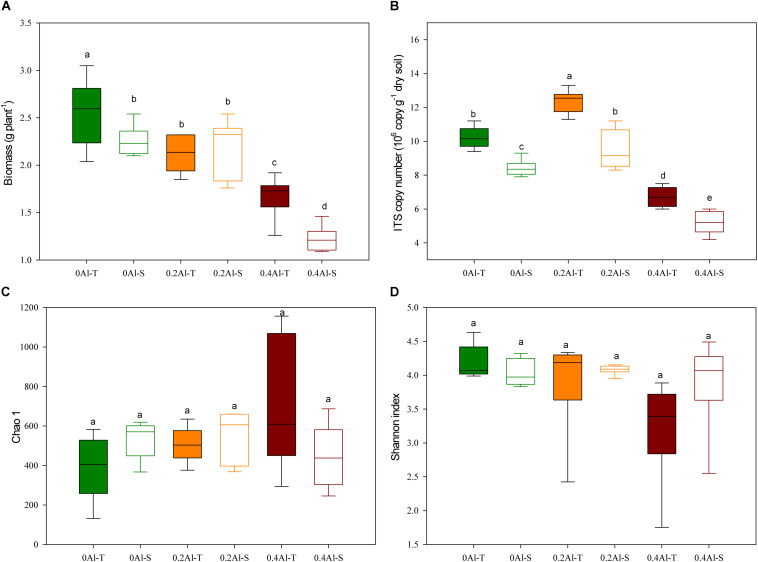
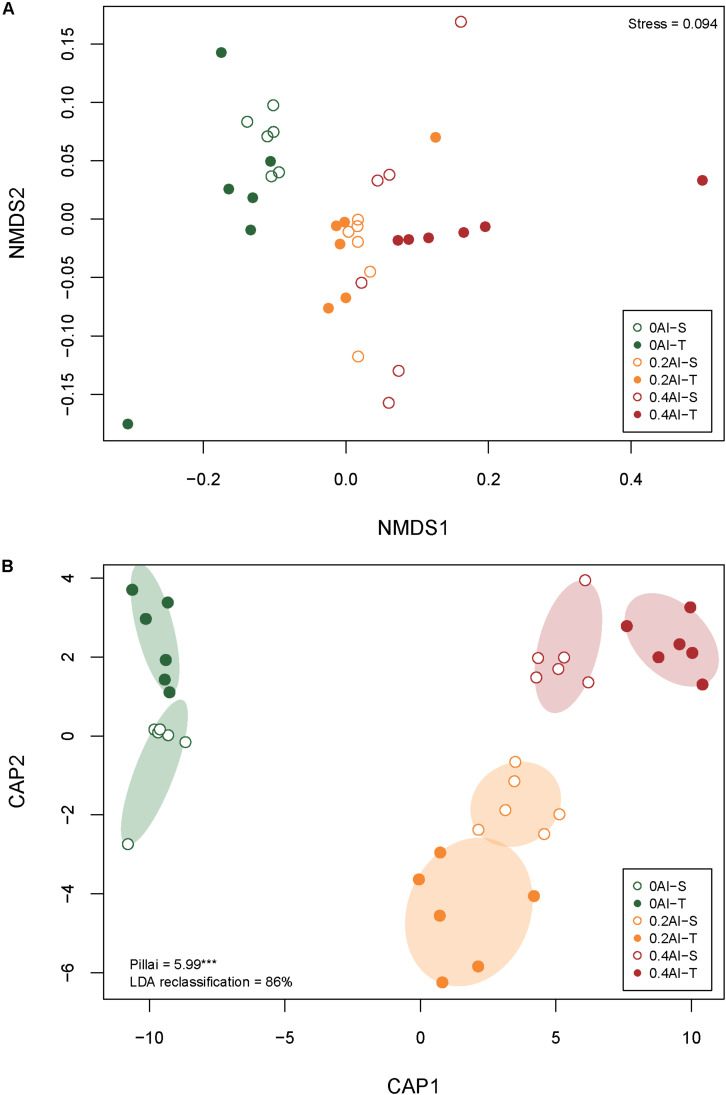
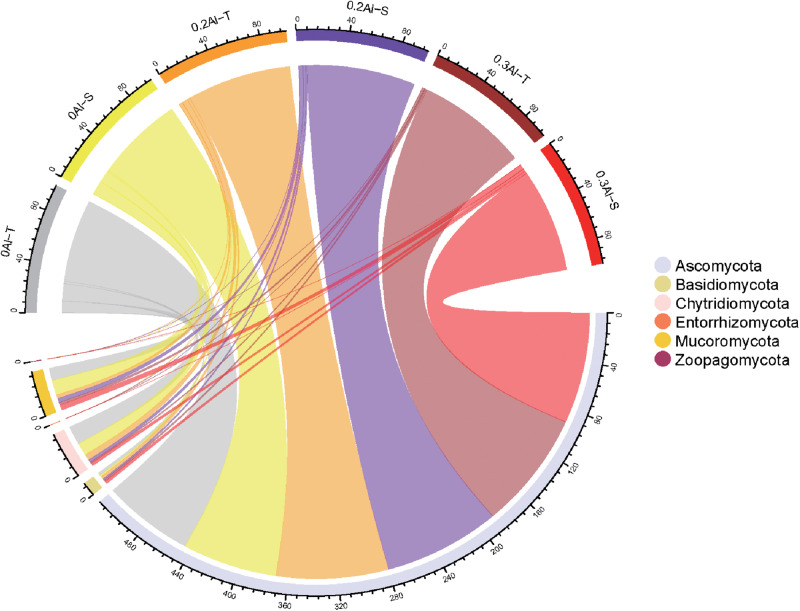
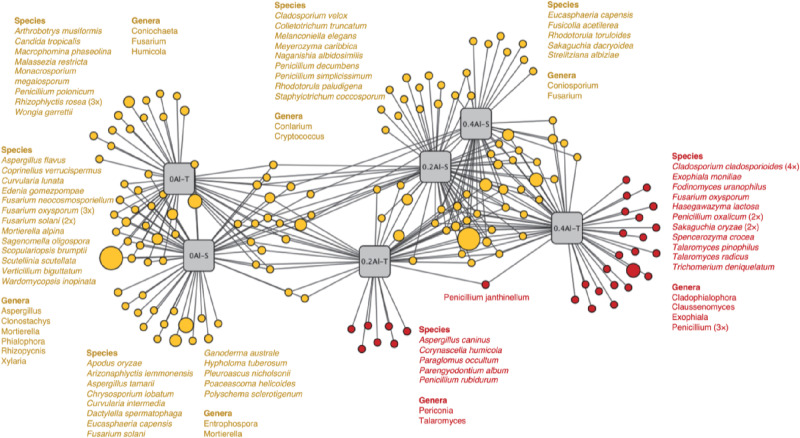
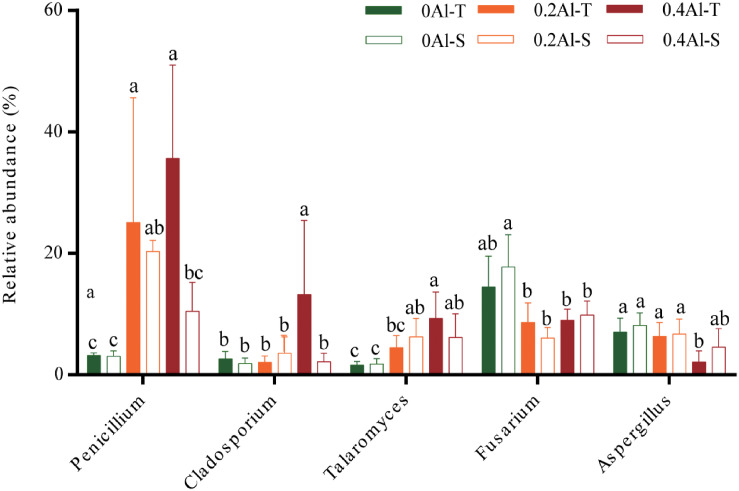
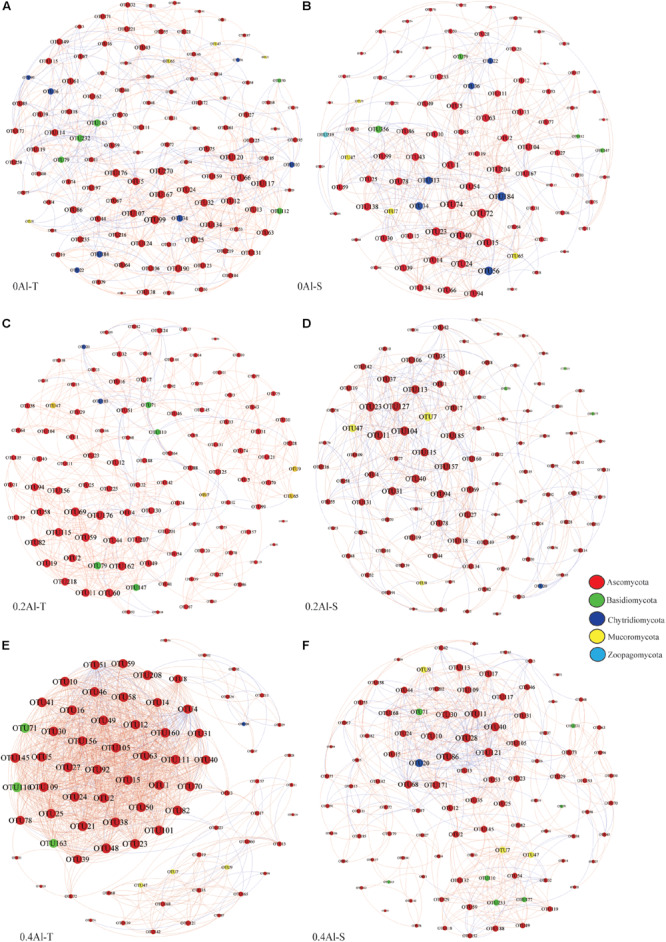
Different soybean genotypes can differ in their tolerance toward aluminum stress depending on their rhizosphere-inhabiting microorganisms. However, there is limited understanding of the response of fungal communities to different aluminum concentrations across different genotypes. Here, we used metabarcoding of fungal ribosomal markers to assess the effects of aluminum stress on the rhizosphere fungal community of aluminum-tolerant and aluminum-sensitive soybean genotypes. Shifts in fungal community structure were related to changes in plant biomass, fungal abundance and soil chemical properties. Aluminum stress increased the difference in fungal community structure between tolerant and sensitive genotypes. Penicillium, Cladosporium and Talaromyces increased with increasing aluminum concentration. These taxa associated with the aluminum-tolerant genotypes were enriched at the highest aluminum concentration. Moreover, complexity of the co-occurrence network associated with the tolerant genotypes increased at the highest aluminum concentration. Collectively, increasing aluminum concentrations magnified the differences in fungal community structure between the two studied tolerant and sensitive soybean genotypes. This study highlights the possibility to focus on rhizosphere fungal communities as potential breeding target to produce crops that are more tolerant toward heavy metal stress or toxicity in general.
Keywords: aluminum toxicity; metabarcoding; network; rhizosphere fungal community; soybean genotypes.
Copyright © 2020 Shi, Liu, Shi, Cai, Nian, Hartmann and Lian.
Figures
Similar articles
-
High Aluminum Drives Different Rhizobacterial Communities Between Aluminum-Tolerant and Aluminum-Sensitive Wild Soybean.Front Microbiol. 2020 Aug 19;11:1996. doi: 10.3389/fmicb.2020.01996. eCollection 2020. Front Microbiol. 2020. PMID: 32973720 Free PMC article.
-
Bacterial composition, function and the enrichment of plant growth promoting rhizobacteria (PGPR) in differential rhizosphere compartments of Al-tolerant soybean in acidic soil.Yi Chuan. 2021 May 20;43(5):487-500. doi: 10.16288/j.yczz.20-409. Yi Chuan. 2021. PMID: 33972218
-
Distinct Patterns of Rhizosphere Microbiota Associated With Rice Genotypes Differing in Aluminum Tolerance in an Acid Sulfate Soil.Front Microbiol. 2022 Jun 17;13:933722. doi: 10.3389/fmicb.2022.933722. eCollection 2022. Front Microbiol. 2022. PMID: 35783428 Free PMC article.
-
Differential Impacts on Bacterial Composition and Abundance in Rhizosphere Compartments between Al-Tolerant and Al-Sensitive Soybean Genotypes in Acidic Soil.J Microbiol Biotechnol. 2020 Aug 28;30(8):1169-1179. doi: 10.4014/jmb.2003.03018. J Microbiol Biotechnol. 2020. PMID: 32522970 Free PMC article.
-
Microbially Mediated Plant Salt Tolerance and Microbiome-based Solutions for Saline Agriculture.Biotechnol Adv. 2016 Nov 15;34(7):1245-1259. doi: 10.1016/j.biotechadv.2016.08.005. Epub 2016 Aug 30. Biotechnol Adv. 2016. PMID: 27587331 Review.
Cited by
-
Land use differentially affects fungal communities and network complexity in northeast China.Front Microbiol. 2022 Nov 18;13:1064363. doi: 10.3389/fmicb.2022.1064363. eCollection 2022. Front Microbiol. 2022. PMID: 36466694 Free PMC article.
-
High Aluminum Drives Different Rhizobacterial Communities Between Aluminum-Tolerant and Aluminum-Sensitive Wild Soybean.Front Microbiol. 2020 Aug 19;11:1996. doi: 10.3389/fmicb.2020.01996. eCollection 2020. Front Microbiol. 2020. PMID: 32973720 Free PMC article.
-
Fungi, P-Solubilization, and Plant Nutrition.Microorganisms. 2022 Aug 26;10(9):1716. doi: 10.3390/microorganisms10091716. Microorganisms. 2022. PMID: 36144318 Free PMC article. Review.
-
Diversity of Root-Associated Fungi of the Terrestrial Orchids Gavilea lutea and Chloraea collicensis in a Temperate Forest Soil of South-Central Chile.J Fungi (Basel). 2022 Jul 29;8(8):794. doi: 10.3390/jof8080794. J Fungi (Basel). 2022. PMID: 36012784 Free PMC article.
-
Potential relevance between soybean nitrogen uptake and rhizosphere prokaryotic communities under waterlogging stress.ISME Commun. 2023 Jul 11;3(1):71. doi: 10.1038/s43705-023-00282-0. ISME Commun. 2023. PMID: 37433864 Free PMC article.
References
-
- Abreu C. H., Jr., Muraoka T., Lavorante A. F. (2003). Exchangeable aluminum evaluation in acid soils. Sci. Agric. 60 543–548. - PubMed
-
- Anderson M. J. (2001). A new method for non-parametric multivariate analysis of variance. Aust. J. Ecol. 26 32–46.
-
- Anderson M. J., Willis T. J. (2003). Canonical analysis of principal coordinates: a useful method of constrained ordination for ecology. Ecology 84 511–525.
LinkOut - more resources
Full Text Sources