. 2020 May 28:11:601.
doi: 10.3389/fpls.2020.00601. eCollection 2020.

Soil Sickness in Aged Tea Plantation Is Associated With a Shift in Microbial Communities as a Result of Plant Polyphenol Accumulation in the Tea Gardens

Affiliations

Soil Sickness in Aged Tea Plantation Is Associated With a Shift in Microbial Communities as a Result of Plant Polyphenol Accumulation in the Tea Gardens

Yasir Arafat et al. Front Plant Sci. .

Abstract

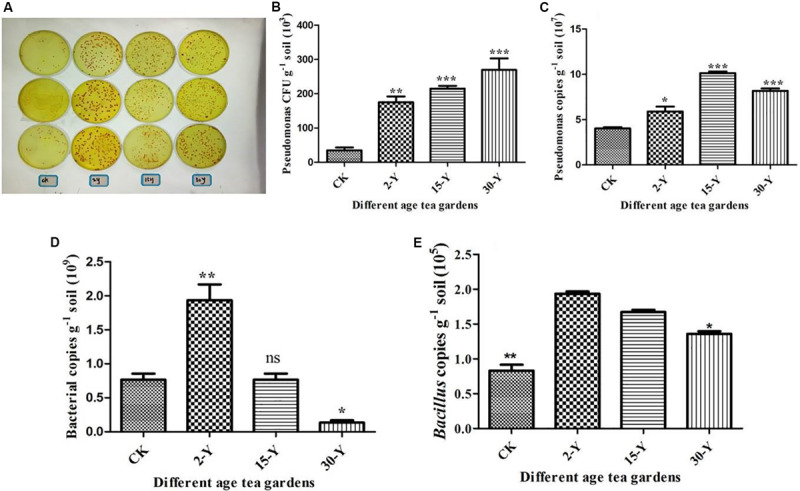
In conventional tea plantations, a large amount of pruned material returns to the soil surface, putting a high quantity of polyphenols into the soil. The accumulation of active allelochemicals in the tea rhizosphere and subsequent shift in beneficial microbes may be the cause of acidification, soil sickness, and regeneration problem, which may be attributed to hindrance of plant growth, development, and low yield in long-term monoculture tea plantation. However, the role of pruning leaf litter in soil sickness under consecutive tea monoculture is unclear. Here, we investigated soil samples taken from conventional tea gardens of different ages (2, 15, and 30 years) and under the effect of regular pruning. Different approaches including liquid chromatography-mass spectrometry (LC-MS) analysis of the leaf litter, metagenomic study of root-associated bacterial communities, and in vitro interaction of polyphenols with selected bacteria were applied to understand the effect of leaf litter-derived polyphenols on the composition and structure of the tea rhizosphere microbial community. Our results indicated that each pruning practice returns a large amount of leaf litter to each tea garden. LC-MS results showed that leaf litter leads to the accumulation of various allelochemicals in the tea rhizosphere, including epigallocatechin gallate, epigallocatechin, epicatechin gallate, catechin, and epicatechin with increasing age of the tea plantation. Meanwhile, in the tea garden grown consecutively for 30 years (30-Y), the phenol oxidase and peroxidase activities increased significantly. Pyrosequencing identified Burkholderia and Pseudomonas as the dominant genera, while plant growth-promoting bacteria, especially Bacillus, Prevotella, and Sphingomonas, were significantly reduced in the long-term tea plantation. The qPCR results of 30-Y soil confirmed that the copy numbers of bacterial genes per gram of the rhizosphere soil were significantly reduced, while that of Pseudomonas increased significantly. In vitro study showed that the growth of catechin-degrading bacteria (e.g., Pseudomonas) increased and plant-promoting bacteria (e.g., Bacillus) decreased significantly with increasing concentration of these allelochemicals. Furthermore, in vitro interaction showed a 0.36-fold decrease in the pH of the broth after 72 h with the catechin degradation. In summary, the increase of Pseudomonas and Burkholderia in the 30-Y garden was found to be associated with the accumulation of catechin substrates. In response to the long-term monoculture of tea, the variable soil pH along with the litter distribution negatively affect the population of plant growth-promoting bacteria (e.g., Sphingomonas, Bacillus, and Prevotella). Current research suggests that the removal of pruned branches from tea gardens can prevent soil sickness and may lead to sustainable tea production.

Keywords: catechins; indirect allelopathy; monoculture problems; plant polyphenol; soil sickness.


Figures

FIGURE 1
FIGURE 1
Replanting problems in continuous monoculture tea garden soil. 2-Y, 15-Y, and 30-Y indicate tea garden soil in which tea was planted continuously for different years (2, 15, and 30 years).
FIGURE 2
FIGURE 2
Quality parameters of tea leaves from tea plantations of different ages. (A) Theophylline, (B) theanine, (C) total polyphenols, and (D) total free amino acids. Stars in the column show significant differences (LSD test, P < 0.05, n = 3). 2-Y, 15-Y, and 30-Y indicate tea gardens planted continuously for different years (2, 15, and 30).
FIGURE 3
FIGURE 3
Physiological characteristics of tea leaves. (A) Length of new tea sprouts (P < 0.05, n = 5), (B) photosynthetic rate (Pn) of the third tea leaf in young sprout (P < 0.05, n = 3), (C) content of tea leaf chlorophyll with young sprouts from bottom to top (P < 0.05, n = 8), (D) water contents in five leaves. Stars in the column show significant differences (LSD test, P < 0.05, n = 5) under different fields. 2-Y, 15-Y, and 30-Y indicate tea gardens planted continuously for different years (2, 15, and 30).
FIGURE 4
FIGURE 4
HPLC–ESI–MS spectra of catechins in leaf litters collected. (1) Represents protocatechuic acid (PCA) with a retention time of 3.08–3.12 min; (2) represents epigallocatechin (EGC) with a retention time of 4.07–4.11 min; (3) is catechin (±C) with a retention time of 4.52–4.55 min; (4) is epicatechin (EC) with a retention time of 5.42–5.44 min; (5) represents epigallocatechin-3-gallate (EGCG) with a retention time of 5.62–5.72 min; (6) represents epicatechin-3-gallate (ECG) with a retention time of 7.11–7.13 min; and (7) represents taxifolin (TF) with a retention time of 7.32–7.35 min. Control, 2-Y, 15-Y, and 30-Y indicate tea garden leaf litters planted continuously for different years (0, 2, 15, and 30).
FIGURE 5
FIGURE 5
(A) Heat map showing the distribution of the 35 most abundant genera. Bulk soil (CK), rhizosphere (RS2 and RS30), rhizoplane (RP2 and RP30), and endosphere (ES2 and ES30) of tea gardens continuously cropped for 2 and 30 years, respectively (LSD test, P < 0.05, n = 3). (B) Error bar plots displaying significantly difference of most abundant genera among in Bulk (CK) and 30-Y rhizosphere (RS30) tea plantation (t-test, P < 0.05, n = 3). (C) Error bar plots displaying significant difference of most abundant genera in the 2-Y rhizosphere (RS2) and 30-Y rhizosphere (RS30) tea plantation (t-test, P < 0.05, n = 3). (D) Error bar plots displaying significant difference of most abundant genera in 2-Y rhizoplane (RP2) and 30-Y rhizoplane (RP30) tea plantation (t-test, P < 0.05, n = 3). The points explain differences among (“CK and RS30”), (“RS2 and RS30”), and (“RP2 and RP30”) (red, green, and blue bars, respectively); the values on the right-hand side display the P-values derived from the t-test error bar plots.
FIGURE 6
FIGURE 6
Abundance of total bacteria, Pseudomonas and Bacillus genera by qPCR analysis. (A) Pseudomonas populations. (B) CFU of Pseudomonas per gram of soil. (C) The contents of Pseudomonas genera in tea rhizosphere soils after different years of monoculture by qPCR analysis using the primer sets Psf/Psr (Tan and Ji, 2010). (D) The total bacterial contents by qPCR analysis using the primer set Eub338/Eub518. (E) The contents of Bacillus genera in tea rhizosphere soils after different years of monoculture by qPCR analysis (Wu H. et al., 2016). CK, 2Y, 15Y, and 30Y refer to bulk soil without planting any crop, newly planted 2-year garden, and replanted 15- and 30-year garden, respectively. Stars in the column show significant differences (LSD test, P < 0.05, n = 3).
FIGURE 7
FIGURE 7
In vitro interactions of different types of allelochemicals with model growth-promoting bacteria Bacillus. (A) Epicatechin (EC), (B) protocatechuic acid (PCA), (C) taxifolin (TF), (D) epigallocatechin-3-gallate (EGCG), (E) catechin (±C), and (F) mix of all catechins. Stars in the column show significant differences (LSD test, P < 0.05, n = 4).
FIGURE 8
FIGURE 8
In vitro interactions of different types of allelochemicals with model catechins degrading bacteria Pseudomonas. (A) Epigallocatechin-3-gallate (EGCG), (B) epigallocatechin (EGC), (C) epicatechingallate (ECG), (D) catechin (±C), (E) protocatechuic acid (PCA), and (F) mix of all catechins. Stars in the column show significant differences (LSD test, P < 0.05, n = 4).
FIGURE 9
FIGURE 9
Impact of catechin degradation on pH. (A) Catechin degradation, (B) effect on pH. EC + P represents Epicatechin (EC) + Pseudomonas (P) and PCA represents protocatechuic acid.

Similar articles

Cited by

References

    1. Acosta-Martínez V., Burow G., Zobeck T., Allen V. (2010). Soil microbial communities and function in alternative systems to continuous cotton. Soil Sci. Soc. Am. J. 74 1181–1192.
    1. Arafat Y., Tayyab M., Khan M. U., Chen T., Amjad H., Awais S., et al. (2019). Long-term monoculture negatively regulates Fungal community composition and abundance of Tea orchards. Agronomy 9:466.
    1. Arafat Y., Wei X., Jiang Y., Chen T., Saqib H., Lin S., et al. (2017). Spatial distribution patterns of root-associated bacterial communities mediated by root exudates in different aged ratooning tea monoculture systems. Int. J. Mol. Sci. 18:1727. 10.3390/ijms18081727 - DOI - PMC - PubMed
    1. Baldwin I. T., Olson R. K., Reiners W. A. (1983). Protein binding phenolics and the inhibition of nitrification in subalpine balsam fir soils. Soil Biol. Biochem. 15 419–423.
    1. Baxendale C., Orwin K. H., Poly F., Pommier T., Bardgett R. D. (2014). Are plant–soil feedback responses explained by plant traits? New Phytol. 204 408–423. 10.1111/nph.12915 - DOI - PubMed

LinkOut - more resources