

Construction of a Competitive Endogenous RNA Network for Pancreatic Adenocarcinoma Based on Weighted Gene Co-expression Network Analysis and a Prognosis Model
- PMID: 32548103
- PMCID: PMC7270201
- DOI: 10.3389/fbioe.2020.00515
Construction of a Competitive Endogenous RNA Network for Pancreatic Adenocarcinoma Based on Weighted Gene Co-expression Network Analysis and a Prognosis Model
Abstract
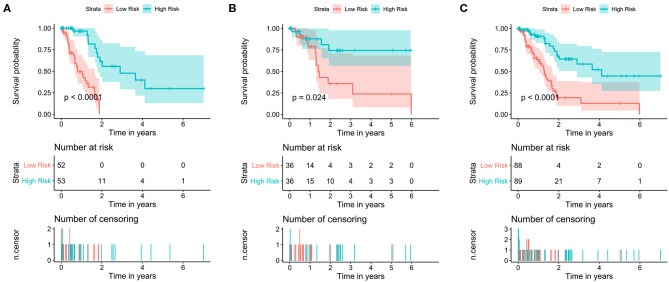
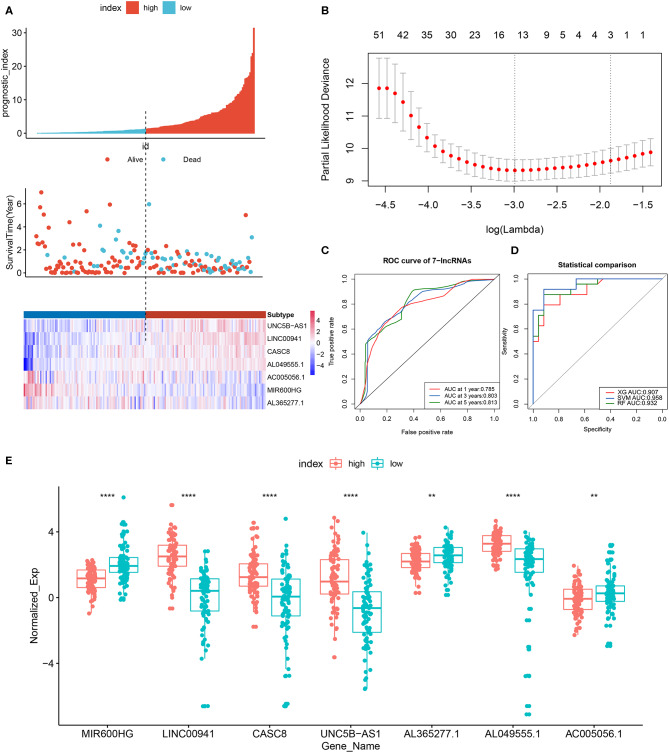
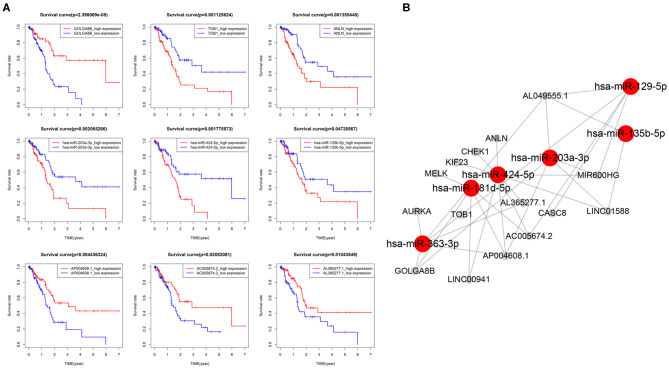
Pancreatic adenocarcinoma (PAAD) is a pancreatic disease with considerable mortality worldwide. Because of a lack of obvious symptoms at the early stage, most PAAD patients are diagnosed at the terminal stage and prognosis is usually poor. In this study, we firstly obtained RNA sequencing data of 181 patients with PAAD from The Cancer Genome Atlas (TCGA) database to identify early diagnostic biomarkers for PAAD. Survival-related mRNAs were identified using a weighted gene co-expression network analysis (WGCNA), and then a linear prognostic model of seven long non-coding RNAs (lncRNAs) was established using univariate and multivariate Cox proportional hazards regression analyses, which is verified using a time-dependent receiver operating characteristic (ROC) curve analysis. Finally, according to the survival analysis, we constructed a survival-related competing endogenous RNA (ceRNA) network. Our results showed that: (1) The upregulated genes related to cell cycle-related pathway (including homologous recombination, DNA replication and mismatch repair) in PAAD can increase the proliferation ability of cancer cells; (2) The 7-lncRNA signature can predict the overall survival (OS) of PAAD patients; and (3) The key mRNAs and lncRNAs are involved in mutual regulation in the ceRNA network.
Keywords: competing endogenous RNA network; pancreatic adenocarcinoma; prognostic signature; the cancer genome atlas; weighted gene co-expression network analysis.
Copyright © 2020 Wang, Xiang and Li.
Figures
Similar articles
-
Three-lncRNA signature is a potential prognostic biomarker for pancreatic adenocarcinoma.Oncotarget. 2018 Feb 8;9(36):24248-24259. doi: 10.18632/oncotarget.24443. eCollection 2018 May 11. Oncotarget. 2018. PMID: 29849937 Free PMC article.
-
Identification of a competing endogenous RNA network associated with prognosis of pancreatic adenocarcinoma.Cancer Cell Int. 2020 Jun 11;20:231. doi: 10.1186/s12935-020-01243-6. eCollection 2020. Cancer Cell Int. 2020. PMID: 32536819 Free PMC article. Review.
-
High expression of LAMA3/AC245041.2 gene pair associated with KRAS mutation and poor survival in pancreatic adenocarcinoma: a comprehensive TCGA analysis.Mol Med. 2021 Jun 16;27(1):62. doi: 10.1186/s10020-021-00322-2. Mol Med. 2021. PMID: 34134622 Free PMC article.
-
An eight-lncRNA signature predicts survival of breast cancer patients: a comprehensive study based on weighted gene co-expression network analysis and competing endogenous RNA network.Breast Cancer Res Treat. 2019 May;175(1):59-75. doi: 10.1007/s10549-019-05147-6. Epub 2019 Feb 4. Breast Cancer Res Treat. 2019. PMID: 30715658
-
GPCRs in pancreatic adenocarcinoma: Contributors to tumour biology and novel therapeutic targets.Br J Pharmacol. 2020 Jun;177(11):2434-2455. doi: 10.1111/bph.15028. Epub 2020 Apr 12. Br J Pharmacol. 2020. PMID: 32060895 Free PMC article. Review.
Cited by
-
N6-Methyladenosine-Modified ATP8B1-AS1 Exerts Oncogenic Roles in Hepatocellular Carcinoma via Epigenetically Activating MYC.J Hepatocell Carcinoma. 2023 Sep 6;10:1479-1495. doi: 10.2147/JHC.S415318. eCollection 2023. J Hepatocell Carcinoma. 2023. PMID: 37701563 Free PMC article.
-
Identification of LncRNA Prognostic Signature Associated With Genomic Instability in Pancreatic Adenocarcinoma.Front Oncol. 2022 Mar 29;12:799475. doi: 10.3389/fonc.2022.799475. eCollection 2022. Front Oncol. 2022. PMID: 35433487 Free PMC article.
-
Construction of a Ferroptosis-Related Long Non-coding RNA Prognostic Signature and Competing Endogenous RNA Network in Lung Adenocarcinoma.Front Cell Dev Biol. 2021 Nov 8;9:751490. doi: 10.3389/fcell.2021.751490. eCollection 2021. Front Cell Dev Biol. 2021. PMID: 34820377 Free PMC article.
-
Identification of Potential Biomarkers of Prognosis-Related Long Non-Coding RNA (lncRNA) in Pediatric Rhabdoid Tumor of the Kidney Based on ceRNA Networks.Med Sci Monit. 2020 Dec 17;26:e927725. doi: 10.12659/MSM.927725. Med Sci Monit. 2020. PMID: 33328429 Free PMC article.
References
-
- Alcaraz-Sanabria A., Nieto-Jimenez C., Corrales-Sanchez V., Serrano-Oviedo L., Andres-Pretel F., Montero J. C., et al. . (2017). Synthetic lethality interaction between aurora kinases and CHEK1 inhibitors in Ovarian cancer. Mol. Cancer Ther. 16, 2552–2562. 10.1158/1535-7163.MCT-17-0223 - DOI - PubMed
-
- Caldas C., Kern S. E. (1995). K-ras mutation and pancreatic adenocarcinoma. Int. J. Pancreatol. 18, 1–6 - PubMed
LinkOut - more resources
Full Text Sources
Other Literature Sources