

Editorial
doi: 10.21037/qims-20-541.
Ultrashort echo time (UTE) magnetic resonance imaging of myelin: technical developments and challenges
Affiliations
- PMID: 32550129
- PMCID: PMC7276362
- DOI: 10.21037/qims-20-541
Item in Clipboard
Editorial
Ultrashort echo time (UTE) magnetic resonance imaging of myelin: technical developments and challenges
Quant Imaging Med Surg.
2020 Jun.
No abstract available
Conflict of interest statement
Conflicts of Interest: All authors have completed the ICMJE uniform disclosure form (available at http://dx.doi.org/10.21037/qims-20-541). JD serves as an unpaid editorial board member of Quantitative Imaging in Medicine and Surgery. The other authors have no conflicts of interest to declare.
Figures

Contrast mechanism of myelin imaging using IR-UTE sequences. (A) Illustration of the contrast mechanisms in imaging ultrashort T2 components (such as myelin) in white matter (WMS) using a IR-UTE sequence with an inversion time (TI) set for nulling of signals from the long T2 components in white matter (WML). The long T2 components in gray matter (GML) have negative longitudinal magnetization at the time of the initial free induction decay (FID) data acquisition because GML has a longer T1 than WML. Myelin has an extremely short T2 (T2 <1 ms), which is far shorter than the duration of the adiabatic inversion pulse (duration =8.64 ms), and so its longitudinal magnetization is saturated by the long adiabatic IR pulse. It subsequently recovers relatively quickly because its T1 is shorter than those of WML and GML. As a result at the null point, the white matter signal only comes from WMS. However, gray matter is more complicated: there is a cancellation between positive longitudinal magnetization from ultrashort T2 components (e.g., myelin) in gray matter (GMS) and negative longitudinal magnetization from GML producing a net reduction in transverse magnetization at the FID after the excitation pulse. At the 2nd echo (e.g., TE ~2 ms), the myelin signal in gray matter decays to zero or near zero, while the signal from GML decays much less due to its longer T2*, so the net signal of the transverse magnetization is greater at the 2nd echo than at the initial one. As a result, GM has a higher signal at the 2nd echo than at the 1st echo or FID (B). Subtraction of the 2nd echo from the 1st one (both magnitude reconstructed) leads to a positive signal for myelin in white matter, but a negative signal for ultrashort T2 components (including myelin) in gray matter, which creates very high myelin contrast.

UTE imaging of bovine myelin lipid powder with TEs of 8 µs (A), 0.2 (B), 0.4 (C), 0.6 (D), 0.8 (E) and 1.2 ms (F). The powder shows excellent single-component signal decay with an ultrashort T2* of 152±4 µs (G). Similar behavior with a T2* of 242±13 µs was demonstrated for the bovine myelin lipid-D2O paste (H). Adapted from (23), with permission.

Correlation between UTE signals and myelin concentrations. (A) 3D-UTE-Cones imaging of myelin phantoms with myelin concentrations ranging from 0–24%. (B) Linear regression analysis shows a high correlation between myelin concentration and 3D-UTECones signals (R2 =0.99) (B), demonstrating that the 3D-UTE-Cones sequence can directly detect and quantify myelin protons. Adapted from (31), with permission.

Quantitative T2* and T1 measurement of the myelin vesicle phantom.(A) 3D UTE imaging of intact myelin vesicles with TEs of 0.03 (A), 0.1 (B), 0.2 (C), 0.4 (D), and 0.8 ms (E), and TRs of 10 (F), 20 (G), 30 (H), 50 (I) and 200 ms (J). The corresponding T2* and T1 fitting show a T2* of 225±7 μs (K) and a T1 of 367±4 ms (L). From (34), with permission.

Clinical PD-FSE (A), T2-FSE (B) and MP-RAGE (C) imaging as well as IR-UTE (D) imaging of a brain specimen from a 28 year old female donor with confirmed MS. MS lesions are hyperintense (thin arrows, A, B) on the PD-FSE and T2-FSE images, and hypointense (thin arrows, C) on the MP-RAGE image, and show signal loss on the IR-UTE image (thin arrows, D). Complete myelin loss is obvious in regions indicated by the thin arrows. Partial loss of signal is seen in the IR-UTE image (thick arrow, D) where the PD-FSE, T2-FSE and MP-RAGE images appear normal (thick arrows, A-C). Adapted from (23), with permission.

Representative ex vivo MS brain images (45-year-old male donor) with a high disease burden using clinical T1-weighted MP-RAGE, T2-weighted FSE, and 3D IR-UTE-Cones (A). Arrows point to MS lesions on all three images. The 3D IR-UTE-Cones sequence shows signal loss in MS lesions. Representative histology of sample MS lesions using Luxol Fast Blue as a myelin stain, counterstained with neutral red is shown in (B). Regions of NAWM (top), lesion edge (middle), and central lesion (bottom) demonstrate specific loss of myelin staining in the MS lesions. The three red triangular arrowheads in (A) show the locations of the histological samples. Adapted from (31), with permission.

3D de-IR-UTE images from rat thoracic spinal cord (SC) averaged over five central slices. Magnitude images obtained for (A) TE =20 µs, (B) TE =1,200 µs, and (C) complex difference (A − B) (maximum-intensity range decreased by a factor of two to highlight myelin signal). (D) Intensity profiles across the three images (delineated as red, green, and yellow lines in A, B, and C, respectively) to show relative WM, GM, and background intensity. The most intense signal, present in the short- and long-echo profiles, originates from residual surface water. WM and GM are indicated in A, and arrows highlight residual surface water in B. The dark boundary observed at the GM/WM and WM/surface water interfaces in both echo images stems from partial voluming of adjacent regions with different T1s resulting in destructive interference. From (20), with permission.

IR-UTE-Cones imaging of a 35-year-old volunteer with TEs of 0.032 (A), 0.2 (B), 0.4 ms (C), 0.8 ms (D), subtraction (E) (A minus D), and exponential fitting for a yellow oval ROI in (A), which shows a short T2* of 0.27±0.02 ms (G). This in vivo myelin T2* is very close to the T2* of myelin-D2O paste as well as the T2* of intact myelin vesicles, consistent with selective imaging of myelin using the 3D IR-UTE-Cones sequence at 3T. Adapted from (31), with permission.

Clinical MP-RAGE (A), T2-FLAIR (B) and 3D IR-UTE-Cones (C) images of a 62yo female MS patient, and MP-RAGE (D), T2-FLAIR (E), and 3D IR-UTE-Cones (F) images of a 62 yo male MS patient. MS lesions are highlighted with orange ovals. Myelin loss is depicted on the subtracted 3D IR-UTE-Cones images (C and F) with high contrast. Adapted from (31), with permission.

UTE Brain images with and without long-T2 suppression. (A) Unsuppressed image. (B) 16-ms rectangular suppression pulse. (C) 40-ms TBW =2.4 single-band suppression pulse. With the suppression pulses, short-T2 components in the white matter, probably from myelin are visible (as is the falx cerebri, long, thin arrows). The rectangular pulse suppression in (B) is variable across the slice (shorter, wider arrows), while the single-band pulse produces more consistent suppression in (C). From (34), with permission.

In vivo imaging of the ultrashort T2 components in the human brain. Selected views from a 3D isotropic data set are shown. Images at the shortest TE of 15 µs show little WM-GW contrast (Protocol 4). Increasing TE leads to reduced signal in WM (Protocol 5). Subtraction of the 2nd from the 1st data set largely removes the long-T2 signal, showing predominantly ultrashort T2 components with clear WM-GW contrast (subtraction column). From (35), with permission.

3D IR-UTE-Cones imaging of a 29-year-old volunteer using magnitude (A) and complex (B) subtraction, and the field map (C). The complex subtraction provides improved myelin detection, especially for fine structures and in regions with strong off-resonance effects (arrows). Adapted from (36), with permission.
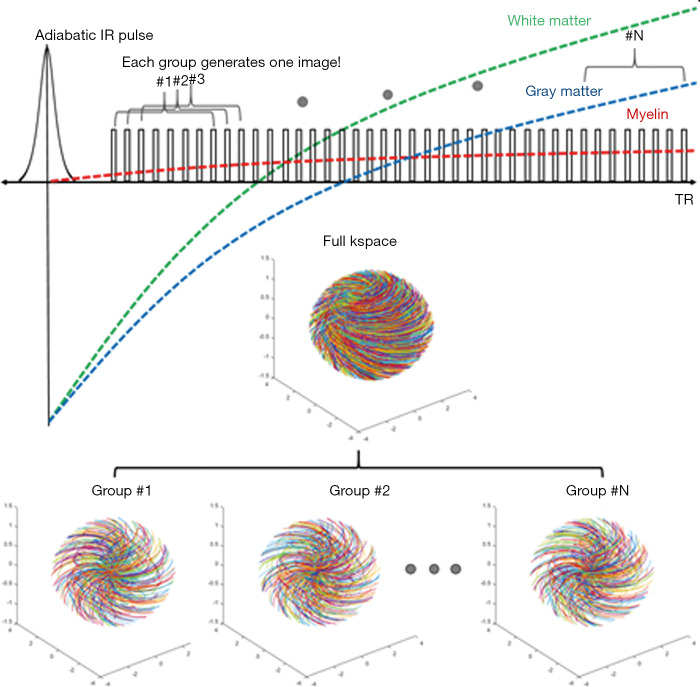
DESIRE contrast mechanism: a series of dual echo UTE spokes are acquired after each IR, a sliding window reconstruction is employed to generate one image per spoke, with up to 71 images, each of which has a different TI. The longitudinal magnetizations of WML can be nulled with an appropriate TI for each voxel, thus allowing robust selective imaging of myelin in WM of the whole brain in different subjects in spite of differences in T1 of WML.

DESIRE-UTE imaging and echo-subtraction at the TIs close to the long T2 nulling point. (A) Five out of 71 DESIRE reconstructed sequential sets of 3D IR-UTE-Cones images of the brain in a 44yo volunteer with a TR of 1 s, TEs of 0.03 ms (A) and 2.2 ms (B), the corresponding subtraction images (C), and the signal intensity vs. sliding window reconstructed images for an ROI in WM (A). Selective myelin imaging is achieved when the 2nd echo shows a null value for WML (arrow in D). From (34), with permission.

A 45-year-old MS patient imaged with MP-RAGE (A), T2-FLAIR (B) and 3D IR DESIRE UTE (C) sequences. MS lesions labeled with ellipses on the MP-RAGE and T2-FLAIR images are shown as signal voids on DESIRE images, corresponding to myelin loss. From (38), with permission.

UTE, AIR, and MAIR brain images acquired from a healthy volunteer. AIR and MAIR images both contain ultrashort T2 signals in the skull and elements of the RF coil. The low intensity signals within white matter regions of the brain are present in the AIR image but absent in MAIR image, and, therefore, do not appear to originate from myelin. From (43), with permission.
References
-
- van der Knaap MS, Valk J. Magnetic Resonance of Myelination and Myelin Disorders. Berlin: Springer, 2005;1-19.
Publication types
Grants and funding
LinkOut - more resources
Full Text Sources