. 2020 May 23;10(15):6854-6874.
doi: 10.7150/thno.44165. eCollection 2020.

Therapeutic potential of a TrkB agonistic antibody for Alzheimer's disease

Affiliations

Therapeutic potential of a TrkB agonistic antibody for Alzheimer's disease

Shudan Wang et al. Theranostics. .

Abstract

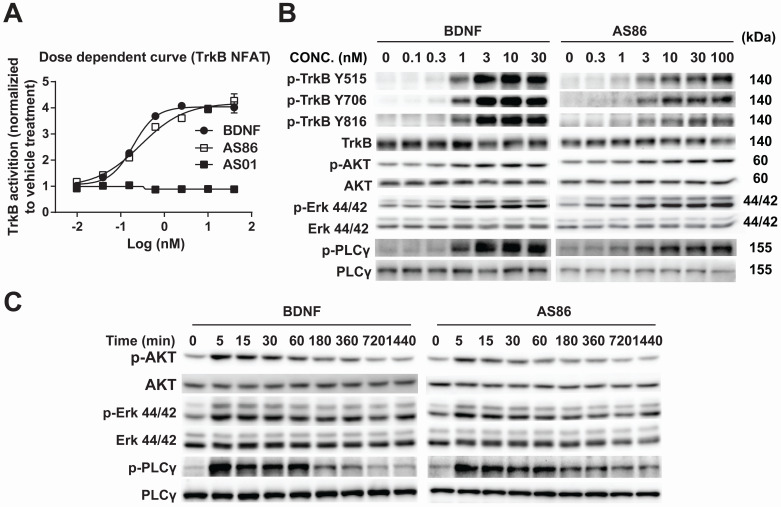
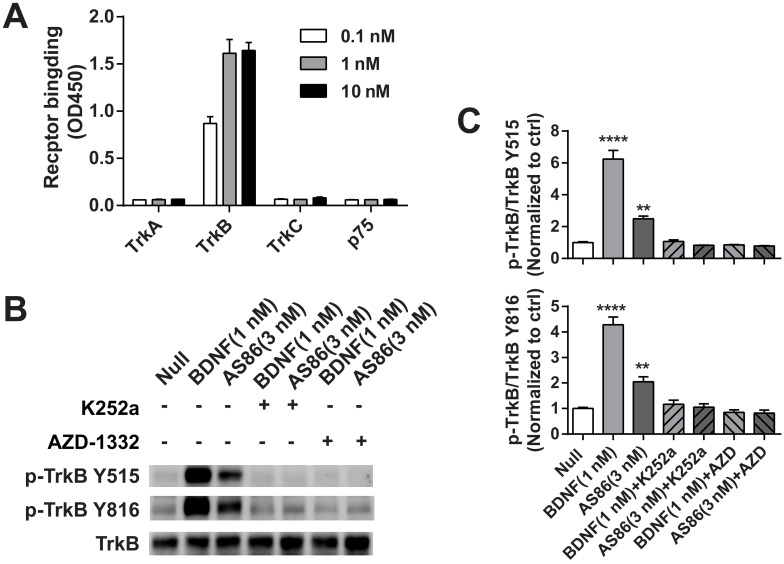
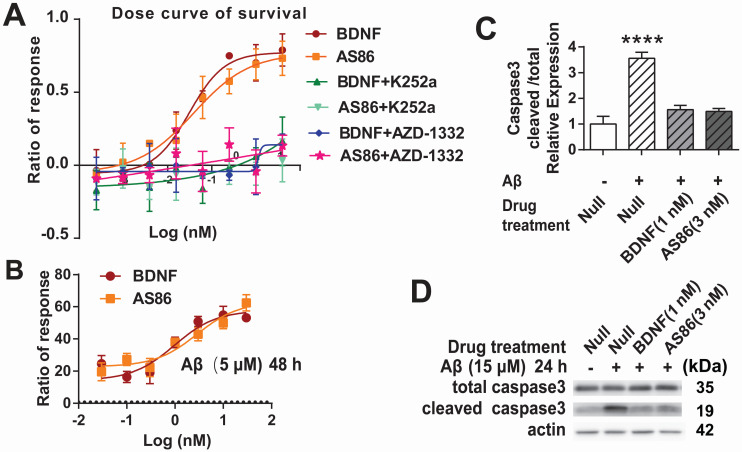
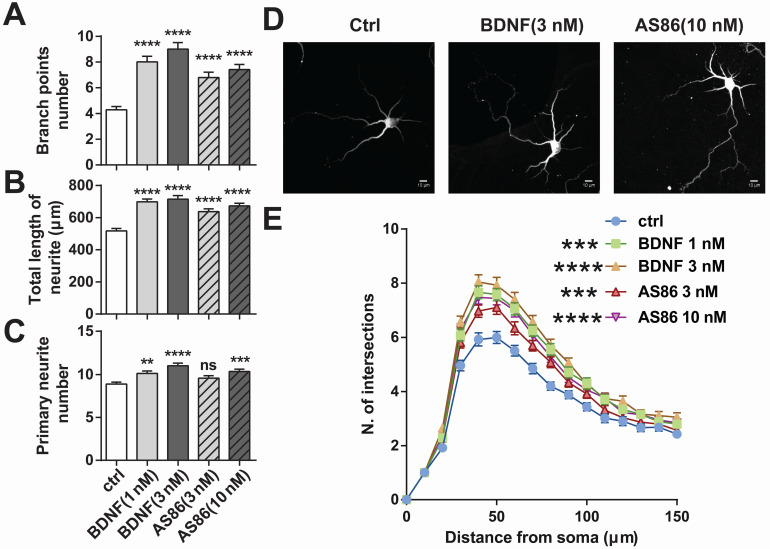
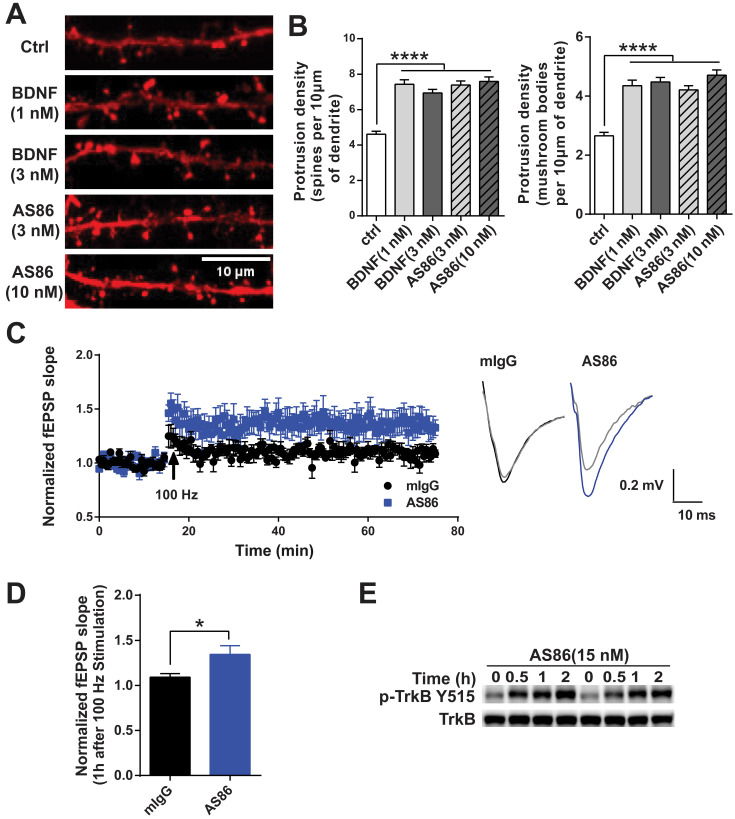
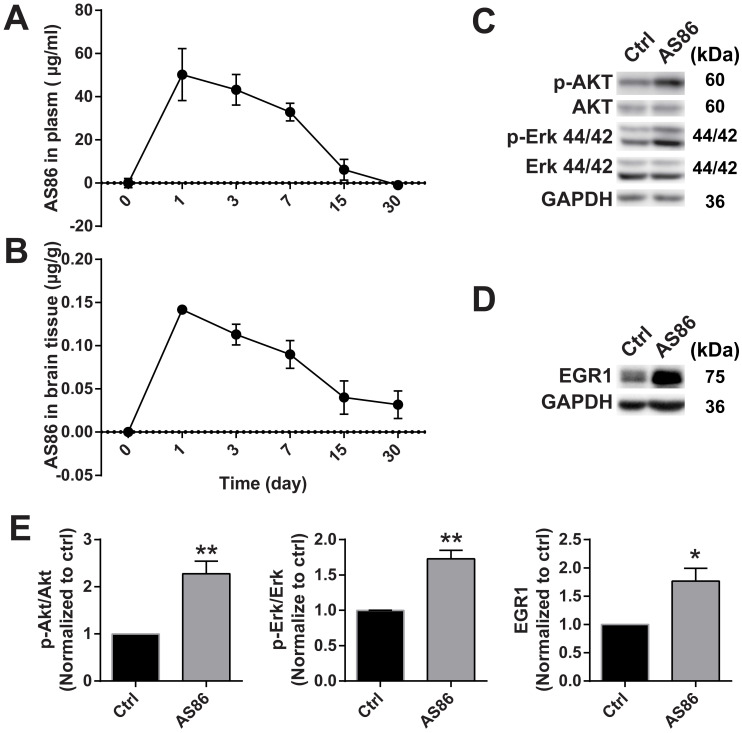
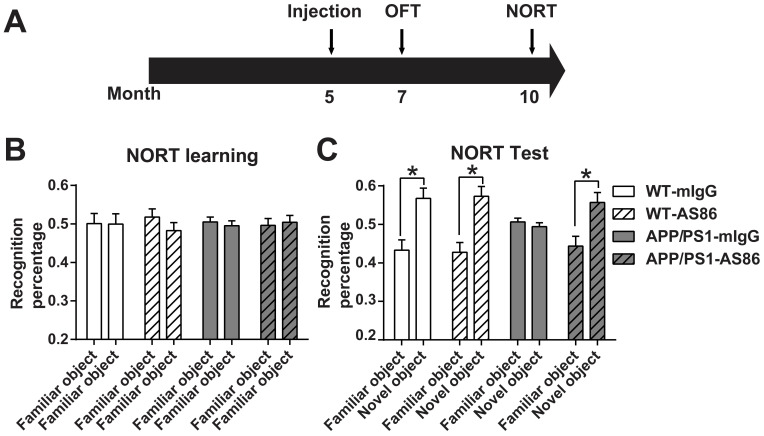
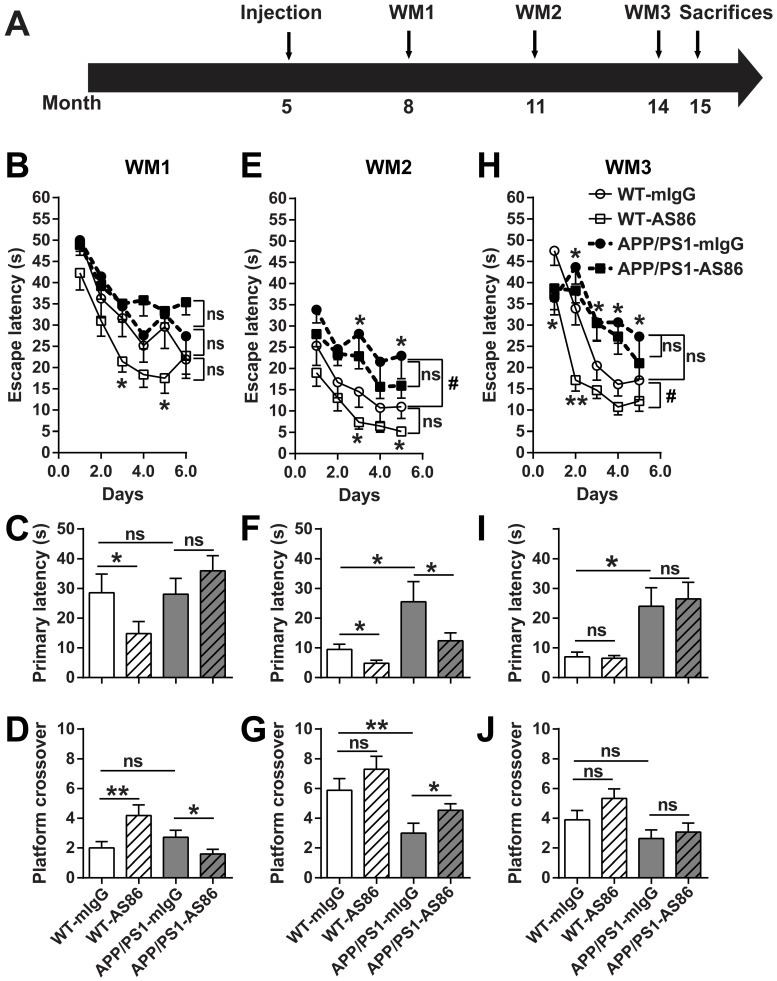
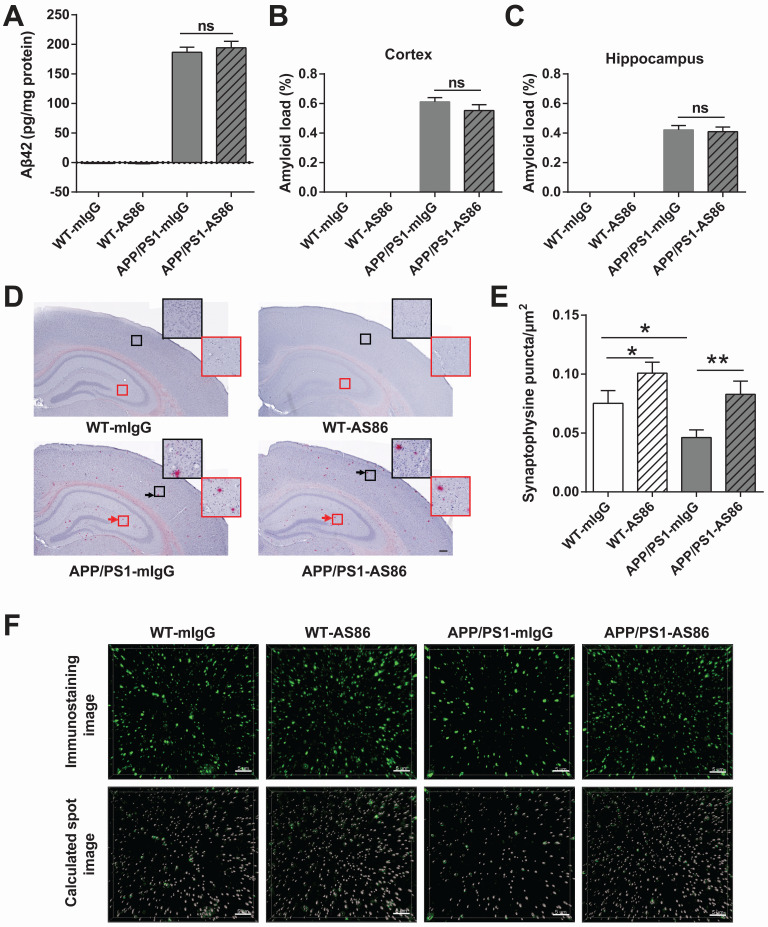
Repeated failures of "Aβ-lowering" therapies call for new targets and therapeutic approaches for Alzheimer's disease (AD). We propose to treat AD by halting neuronal death and repairing synapses using a BDNF-based therapy. To overcome the poor druggability of BDNF, we have developed an agonistic antibody AS86 to mimic the function of BDNF, and evaluate its therapeutic potential for AD. Method: Biochemical, electrophysiological and behavioral techniques were used to investigate the effects of AS86 in vitro and in vivo. Results: AS86 specifically activated the BDNF receptor TrkB and its downstream signaling, without affecting its other receptor p75NTR. It promoted neurite outgrowth, enhanced spine growth and prevented Aβ-induced cell death in cultured neurons, and facilitated Long-Term Potentiation (LTP) in hippocampal slices. A single-dose tail-vein injection of AS86 activated TrkB signaling in the brain, with a half-life of 6 days in the blood and brain. Bi-weekly peripheral administration of AS86 rescued the deficits in object-recognition memory in the APP/PS1 mouse model. AS86 also reversed spatial memory deficits in the 11-month, but not 14-month old AD mouse model. Conclusion: These results demonstrate the potential of AS86 in AD therapy, suggesting that neuronal and/or synaptic repair as an alternative therapeutic strategy for AD.

Keywords: Antibody drug; Cognition; Neurodegeneration; Synaptic plasticity; Therapy.


Conflict of interest statement

Competing Interests: BL, WG and HY are co-inventors of the filed patents related to the TrkB agonistic antibodies. The remaining authors declare no conflict of interest.

Figures

Figure 1
Figure 1
Potency and signaling of TrkB agonistic antibody AS86. (A) Dose response of TrkB activation by AS86. hTrkB-CHO cells were treated with different doses of TrkB antibodies or BDNF for 4 h, and TrkB activation was analyzed using NFAT assay. (B) Dose response of TrkB activation and its downstream signaling in cultured hippocampal neurons. Primary hippocampal neurons (DIV10) were treated with different concentrations of AS86 or BDNF for 30 min, and then the cell lysates were analyzed using Western blotting (N = 3 independent culture experiments, n = 3 repeats for each experiment). Three different tyrosine-phosphorylated sites and downstream signaling pathways were examined. Representative Western blots are presented. (C) Time course of AS86 downstream signaling in cultured hippocampal neurons. Primary hippocampal neurons (DIV10) were stimulated with AS86 or BDNF for 0, 5 min, 15 min, 30 min, 60 min, 180 min, 360 min, 720 min and 1440 min, and then the cell lysates were examined for the activation of Akt, Erk and PLCγ with Western blots (N = 3 independent culture experiments, n = 3 repeats for each experiment). Representative Western blots are presented.
Figure 2
Figure 2
The specificity of TrkB agonistic antibody AS86. (A) AS86 at different concentrations (0.1 nM, 1 nM and 10 nM) was added to the plates coated with different proteins (0.1 μg TrkA, TrkB, TrkC, or p75 respectively), and ELISA was used to examine the binding capacity of AS86. (B, C) Cultured hippocampal neurons (DIV10) were pretreated with the Trk inhibitors k252a (300 nM) or AZD-1332 (100 nM) for 60 min before incubation with mIgG (3 nM), BDNF (1 nM), or AS86 (3 nM) for 15 min (N = 2, n = 3). The Western blots of TrkB Y515 and Y816 sites activation (B) and the quantitative plots (C) are presented. Unless specifically indicated otherwise, statistical analyses in this and all other figures were carried out using one-way ANOVA followed by post hoc test. Symbols for P values (for both ANOVA and Student's t-test): *: p < 0.05; **: p < 0.01; ***: p < 0.001; ****: P < 0.0001. The quantification data in this and all other figures were presented as mean ± SEM.
Figure 3
Figure 3
Cell survival function of AS86. (A) Attenuation of serum-deprivation induced cell death by AS86. Different doses of BDNF or AS86 were applied to serum-deprived cultures of hTrkB-PC12 cells in the absence or presence of Trk inhibitors (300 nM K252a or 50 nM AZD-1332) for 16 hours, and the levels of apoptosis were determined by the ratio of the number of caspase 3 positive cells to total number of cells, using a caspase 3-substrate kit. Survival rates were measured by the decreased apoptotic levels normalized to that of vehicle treatment (n = 3). (B) Attenuation of Aβ induced cell death by AS86. Hippocampal neurons were pretreated with AS86 or BDNF for 30 minutes, followed by treatment with Aβ (25-35) (5 µM). Cell viability was analyzed with ATP level quantification assay 48 hours later (N = 2 independent experiments, n = 6 samples). (C, D) Inhibition of Aβ induced apoptotic signals by AS86. Hippocampal neurons were pretreated with AS86 or BDNF for 30 minutes, followed by treatment with Aβ (25-35) (15 µM) for 24 hours. Total and cleaved caspase3 levels were measured using Western blotting (N = 3 independent experiments, n = 3 replicates). Representative Western blots (D) and quantitative plots (C) are presented.
Figure 4
Figure 4
Differential effects of AS86 and BDNF on neurite growth in hippocampal neurons. Cultured hippocampal neurons (DIV1) were treated with BDNF or AS86 for 3 days, and then fixed and stained with MAP2 antibody. Quantifications of branching points (A), total length of neurites (B) and primary neurite numbers (C), neuronal images with MAP2 staining (D) and sholl analysis (E) are presented (N = 3 independent experiments, n = 120-140 neurons). Scale bar represents 10 µm.
Figure 5
Figure 5
Facilitation of synaptic functions by AS86. (A-B) Effects of AS86 on dendritic spine growth. Cultured hippocampal neurons (DIV7) were transfected with mCherry, followed by treatment with AS86 or BDNF at DIV 15 for 24 h before fixation (N = 3 independent experiments, n = 60 dendrites). Images of dendritic spine (A) and the quantifications of dendritic protrusion densities (B) are presented. Ctrl in this and all other figures: Control, no treatment. (C) Enhancement of HFS-induced LTP in hippocampal slices treated with AS86. AS86 or mIgG was added into perfusate at least 30 min before LTP induction and maintained in perfusate during entire course of recording (65 min). Field EPSPs (fEPSPs) were recorded and the slopes of fEPSPs were plotted over time. The right panels show the representative fEPSPs before HFS (gray) or after stimulation (blue or black). (D) Quantification of slope of fEPSPs 1 hour after LTP induction (n = 7 slices) (Student's t-test). (E) Activation of TrkB by AS86 in hippocampal slices. P12 hippocampal slices were treated with AS86 (15 nM) for 0.5, 1 and 2 hours, and the lysates were analyzed by Western blotting using anti-pTrkB antibody Y515.
Figure 6
Figure 6
Target engagement of AS86 in mouse brains. (A-B) The pharmacokinetic curves of AS86 in plasma and brain tissues of mice. Mice were injected with AS86 (1.5 mg/kg) by tail vein injection, and the AS86 concentration at different time points were analyzed with ELISA, and plotted in time-curve graphs for plasma (A) and brain tissue (B) respectively (n = 3-4 mice). (C-E) Activation of TrkB downstream signals and gene expression by AS86. The hippocampal tissues were lysed after AS86 (1.5 mg/kg) was administrated through tail vein injection, and p-Akt, p-Erk, and EGR1 expression were analyzed at 1 day after injection (n = 3 mice). Representative Western blots (C, D) and quantitative plots (E) are presented (Student's t-test).
Figure 7
Figure 7
Effects of AS86 on novel object recognition test (NORT) in APP/PS1 mice. (A) Schematic diagram showing the timeline of drug treatments and behavior tests were performed. (B-C) Performance of NORT behavior after AS86 treatment. Mice were subjected to NORT after AS86 (1 mg/kg) treatment for 5 months. WT-mIgG (n = 7), WT-AS86 (n = 10), APP/PS1-mIgG (n = 10) and APP/PS1-AS86 (n = 15) mice were subjected to learning paradigm (B), followed by the test trail (C) 3 hours later. Note that administration of AS86 significantly improved the ability to recognize novel objects by APP/PS1 mice. Paired student's t-test.
Figure 8
Figure 8
Effects of long-term treatment of AS86 on spatial learning and memory in APP/PS1 mice. (A) Schematic diagram showing the time point when AS86 was first dosed as well as those when Morris water maze (WM) tests were performed. Mice were subjected to tail-vein injection with AS86 or mIgG every two weeks for 10 months (5 to 15 months old). Three tests of WM were performed during this period. (B-J) Morris water maze (WM) tests were performed to evaluate the effects of AS86 (1 mg/kg) treatments for different durations. (B-D) First evaluation: AS86 (1 mg/kg) treatment for 3 months (WM1). WT-mIgG (n = 10), WT-AS86 (n = 11), APP/PS1-mIgG (n = 14) and APP/PS1-AS86 (n = 18) mice were subjected to learning paradigm of water maze for 5 days, followed by a probe trial at day 6. (E-G) Second evaluation: AS86 treatment for 6 months (WM2). WT-mIgG (n = 9), WT-AS86 (n = 11), APP/PS1-mIgG (n = 12) and APP/PS1- AS86 (n = 18) mice were examined in this round (4 days of training trails, and followed by a probe trial at day 5). (H-J) Third evaluation: AS86 treatment for 9 months (WM3). WT-mIgG (n = 9), WT-AS86 (n = 9), APP/PS1-mIgG (n = 10) and APP/PS1- AS86 (n = 15) mice were subjected to WM (4 days of training trails, and followed by a probe trial at day 5). Statistics for the escape latency of learning trails (B, E, H): Two-way ANOVA with repeated measurement was used for the learning curves. Significant differences in WM2 (WT-mIgG and APP/PS1-mIgG) and WM3 (WT-mIgG and WT-AS86) were indicated by bracket plus “#” (p < 0.05). ns: not significant. Student's t-test was for individual day comparison. For data points significantly different from the corresponding point in WT-mIgG. *: p < 0.05; **: p < 0.01. Statistics for the primary latency (C, F, I) and platform crossover times (D, G, J) of probe trails: the results of two-way ANOVA (mIgG. vs. AS86, and WT. vs. APP/PS1) were shown in Table 1, 2. For the comparison between specific groups, the independent-samples t-test or non-parametric (Mann-Whitney) test was selected depending on whether the data followed normal distribution. *: p < 0.05; **: p < 0.01. ns: not significant.
Figure 9
Figure 9
Effects of AS86 on pathology and pathophysiology of AD mice. (A-D) Effect of AS86 treatment on Aβ pathology in APP/PS1 mice. (A) Detection of Aβ42 for each sub-group. Human Aβ42 in forebrain (15 months) was measured with Aβ42 Elisa (n = 6 for each group), followed by quantification. (B, C, D) Amyloid plaque load in hippocampus and cortex. Amyloid plaques were detected by Congo red staining in hippocampus and cortex (12 slices from 6 mice for each group). The quantification of amyloid plaque load percentage in cortex (B) and hippocampus (C) and the Congo red staining images (D) are presented. Scale bar represents 200 µm. The black and red arrows indicated the amyloid plaques in cortex and hippocampus respectively. The images in black and red squares were amplified at the upper right. (E, F) Rescue of synaptophysin loss in APP/PS1 mice by AS86. Synaptophysin puncta in hippocampal CA1 (15 slices from 6 mice of 15 months old for each group) were detected with immunohistochemistry. The density of synaptophysin puncta in each group was analyzed blindly by Imaris software with the same standard. The immunostaining images (upper) and calculated spot images (lower) with Imaris software (F), and the histogram of quantification for puncta numbers are presented (E). Scale bar represents 5 µm. Student's t-test.

Similar articles

Cited by

References

    1. Polanco JC, Li C, Bodea L-G, Martinez-Marmol R, Meunier FA, Götz J. Amyloid-β and tau complexity — towards improved biomarkers and targeted therapies. Nat Rev Neurol. 2017;14:22. - PubMed
    1. Chen X-Q, Mobley W. Alzheimer Disease Pathogenesis: Insights From Molecular and Cellular Biology Studies of Oligomeric Aβ and Tau Species. Front Neurosci. 2019. 13. - PMC - PubMed
    1. Masters CL, Bateman R, Blennow K, Rowe CC, Sperling RA, Cummings JL. Alzheimer's disease. Nat Rev Dis Pri. 2015;1:15056. - PubMed
    1. Beecham GW, Hamilton K, Naj AC, Martin ER, Huentelman M, Myers AJ. et al. Genome-wide association meta-analysis of neuropathologic features of Alzheimer's disease and related dementias. PLoS Genet. 2014;10(9):e1004606–e1004606. - PMC - PubMed
    1. Hall AM, Roberson ED. Mouse models of Alzheimer's disease. Brain Res Bull. 2012;88(1):3–12. - PMC - PubMed

Publication types