. 2020 May 27;10(15):7015-7033.
doi: 10.7150/thno.45359. eCollection 2020.

Cortistatin protects against intervertebral disc degeneration through targeting mitochondrial ROS-dependent NLRP3 inflammasome activation

Affiliations

Cortistatin protects against intervertebral disc degeneration through targeting mitochondrial ROS-dependent NLRP3 inflammasome activation

Yunpeng Zhao et al. Theranostics. .

Abstract

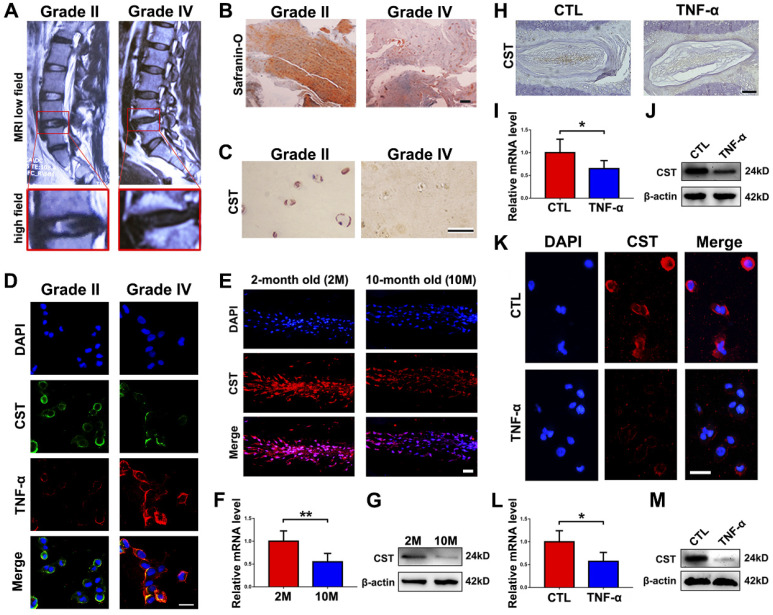
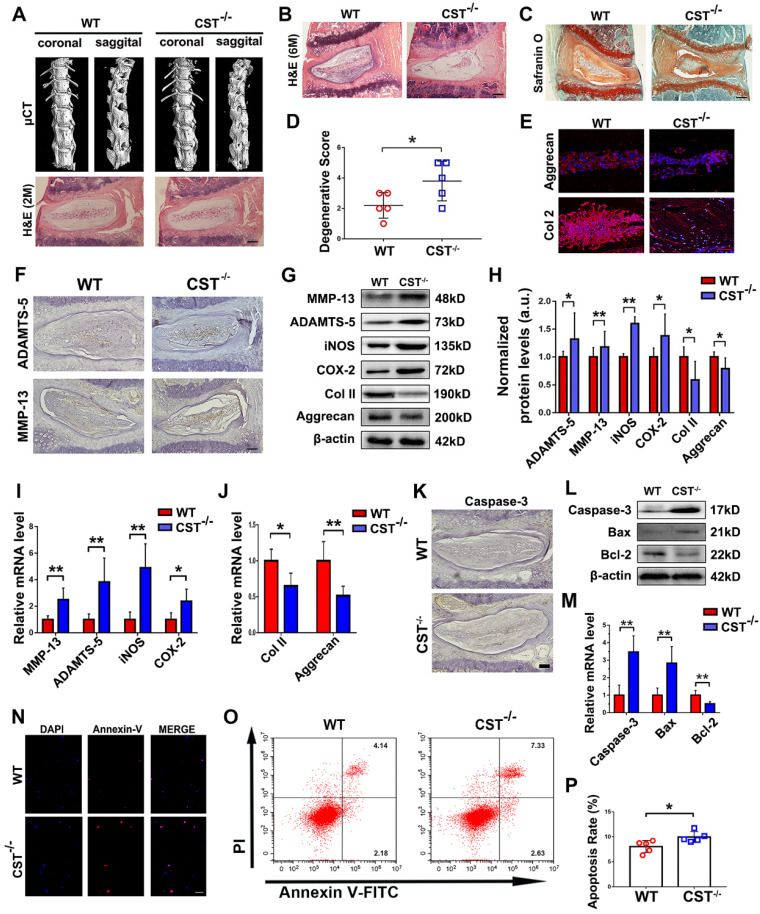
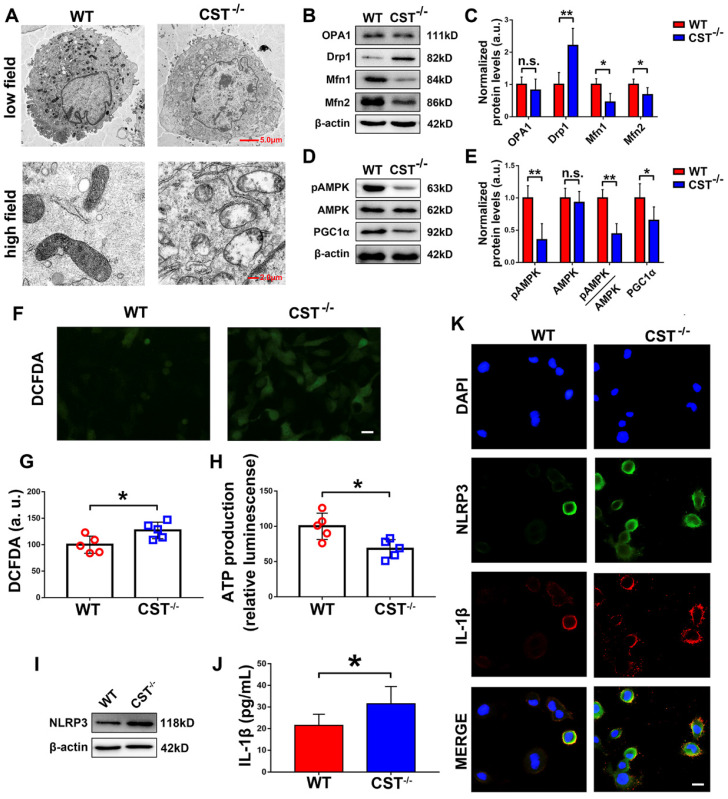
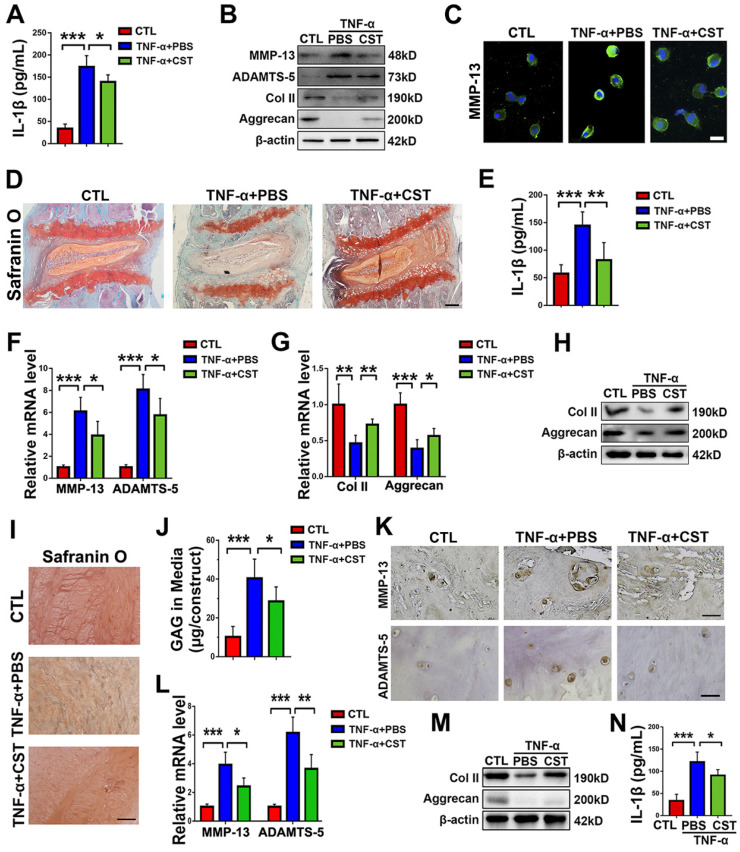
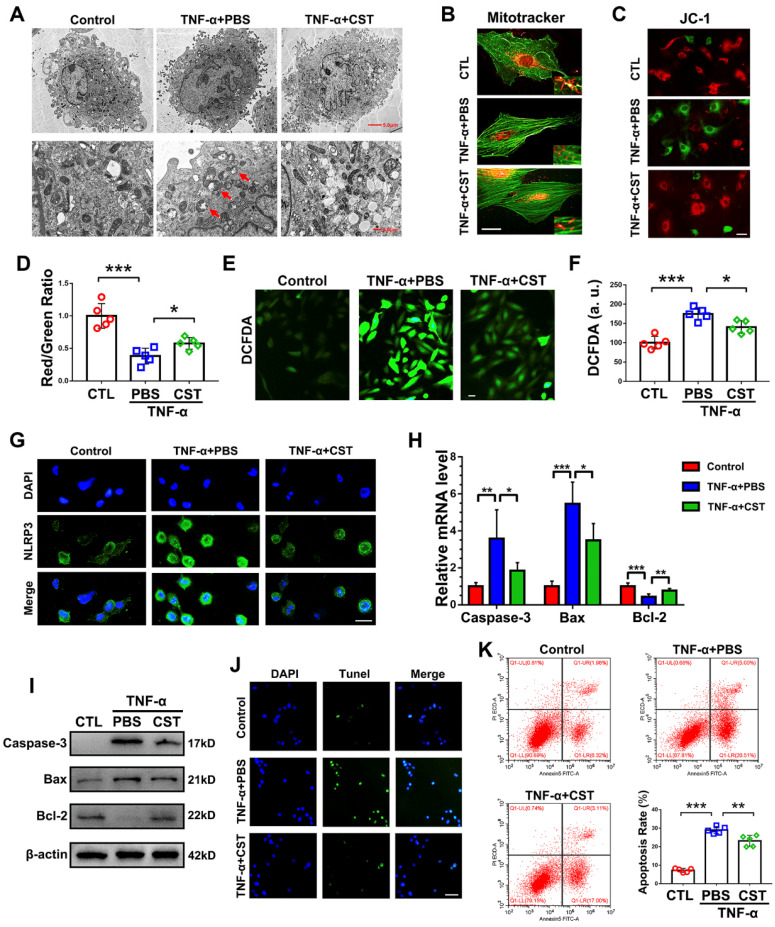
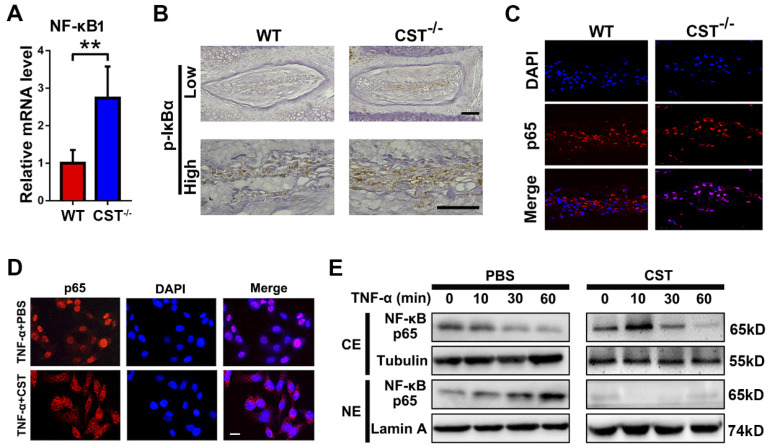
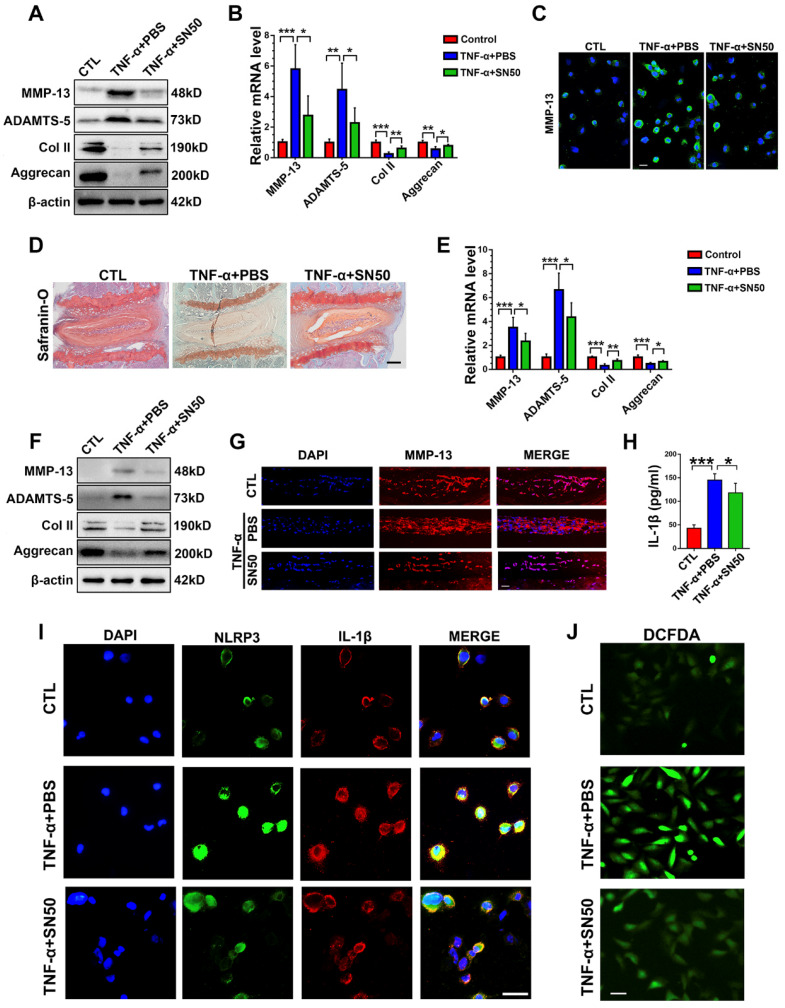
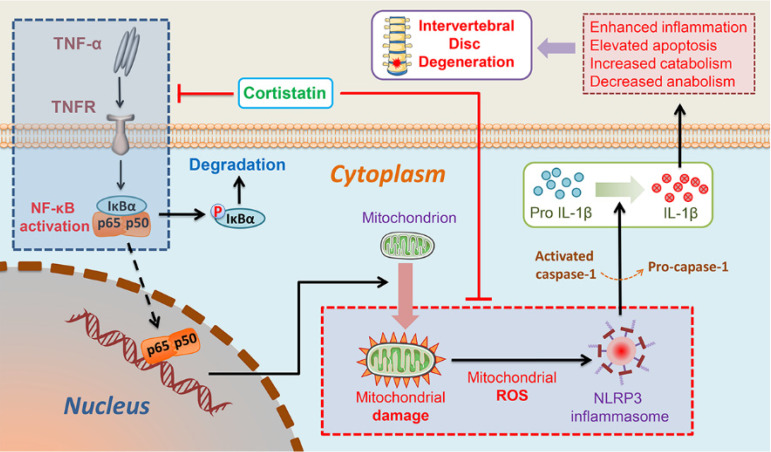
Background: Intervertebral disc (IVD) degeneration is a common degenerative disease that can lead to collapse or herniation of the nucleus pulposus (NP) and result in radiculopathy in patients. Methods: NP tissue and cells were isolated from patients and mice, and the expression profile of cortistatin (CST) was analysed. In addition, ageing of the NP was compared between 6-month-old WT and CST-knockout (CST-/-) mice. Furthermore, NP tissues and cells were cultured to validate the role of CST in TNF-α-induced IVD degeneration. Moreover, in vitro and in vivo experiments were performed to identify the potential role of CST in mitochondrial dysfunction, mitochondrial ROS generation and activation of the NLRP3 inflammasome during IVD degeneration. In addition, NF-κB signalling pathway activity was tested in NP tissues and cells from CST-/- mice. Results: The expression of CST in NP cells was diminished in the ageing- and TNF-α-induced IVD degeneration process. In addition, compared with WT mice, aged CST-/- mice displayed accelerated metabolic imbalance and enhanced apoptosis, and these mice showed a disorganized NP tissue structure. Moreover, TNF-α-mediated catabolism and apoptosis were alleviated by exogenous CST treatment. Furthermore, CST inhibited mitochondrial dysfunction in NP cells through IVD degeneration and suppressed activation of the NLRP3 inflammasome. In vitro and ex vivo experiments indicated that increased NF-κB pathway activity might have been associated with the IVD degeneration observed in CST-/- mice. Conclusion: This study suggests the role of CST in mitochondrial ROS and activation of the NLRP3 inflammasome in IVD degeneration, which might shed light on therapeutic targets for IVD degeneration.

Keywords: Intervertebral disc degeneration; NF-κB signalling pathway; NLRP3; cortistatin; mitochondrial ROS.


Conflict of interest statement

Competing Interests: The authors have declared that no competing interest exists.

Figures

Figure 1
Figure 1
CST expression was diminished in degenerative NP cells. (A) Representative MRI images of the lumbar spine from patients with Pfirrmann grade II (n=10) or grade IV (n=7) IDD. The lower panels show pictures of L4/5 segments at a high magnification. (B) NP tissues were separately isolated from patients with Pfirrmann grade II or grade IV IDD and subjected to Safranin O staining. Scale bar, 150 µm. (C) The CST expression level was diminished in degenerative human NP tissues (grade IV), as detected by immunohistochemistry. Scale bar, 50 µm. (D) Human NP cells were isolated from patients with Pfirrmann grade II IDD, and CST expression levels were reduced while TNF-α levels were enhanced, as assayed by cell immunostaining. Nuclei were stained with DAPI. Scale bar, 50 µm. (E) Expression of CST in the NP tissues of 2-month-old and 10-month-old WT mice was assessed through immunofluorescence (n=5). Scale bar, 100 µm. (F) RNA levels of CST were downregulated in 10-month-old mouse IVD tissues (n=5), as measured by real-time PCR. Total mRNA was collected from 2- and 10-month-old mouse IVD tissues, and real-time PCR was performed. Normalized values were calibrated against the 2-month-old mouse group and given a value of 1. (G) Expression of CST in 2- and 10-month-old mouse IVD tissues, as assayed through Western blot analysis (n=5). (H) Expression of CST in NP tissues was diminished upon stimulation with TNF-α, as detected by immunohistochemistry (n=5). NP tissues were isolated from 2-month-old WT mice and stimulated with or without 10 ng/ml TNF-α for 24 h. Scale bar, 150 µm. (I) IVD tissues from WT mice were induced by TNF-α, and RNA levels of CST were measured through real-time PCR. Normalized values were calibrated against the control (CTL) group and given a value of 1. (J) TNF-α induction reduced CST expression in murine IVD, as measured through Western blot analysis (n=5). (K) Expression of CST in primary human NP cells following stimulation with TNF-α was detected through cell immunostaining (n=5). Nuclei were stained with DAPI. Scale bar, 100 µm. (L) TNF-α reduced CST in primary human NP cells, as measured by real-time PCR (n=5). Normalized values were calibrated against the control (CTL) group and given a value of 1. (M) Expression of CST in TNF-α-induced human NP cells, as assessed by Western blot analysis (n=5). *p<0.05 and **p<0.01 vs. the control group. Data are presented as the mean ± SD.
Figure 2
Figure 2
CST deficiency contributed to accelerated IVD degeneration in mice. (A) Representative µCT images of the spine and H&E staining of the IVDs from 2-month-old WT and CST-/- mice revealed no overt degeneration in CST-/- mice (n=7). Scale bar, 150 µm. (B) H&E staining of 6-month-old WT and CST-/- mice (n=5). Scale bar, 150 µm. (C-D) Safranin O staining of 6-month-old CST-/- mouse IVD tissues and appended degenerative scores indicated accelerated IVD degeneration compared with that in the WT littermates (n=5). Scale bar, 150 µm. (E) Immunofluorescence to detect Aggrecan and Col 2 in IVD tissues from 6-month-old WT and CST-/- mice (n=5). Scale bar, 150 µm. (F) Immunohistochemistry to detect ADAMTS-5 and MMP-13 in IVD tissues from 6-month-old WT and CST-/- mice (n=5). Scale bar, 150 µm. (G-H) Western blot analysis of catabolic markers (MMP-13 and ADAMTS-5), inflammatory molecules (iNOS and COX-2) and anabolic markers (Col 2 and Aggrecan) from 6-month-old WT and CST-/- mice (n=5) and analysis of the normalized protein levels in each group. (I-J) Real-time PCR to detect catabolic markers (MMP-13 and ADAMTS-5), inflammatory molecules (iNOS and COX-2) and anabolic markers (Col 2 and Aggrecan) from 6-month-old WT and CST-/- mice (n=5). Total mRNA was collected from each indicated group, and real-time PCR was performed. Normalized values were calibrated against the wild-type (WT) group and given a value of 1. (K) Expression of caspase-3 in IVD tissues was elevated in 6-month-old CST-/- mice compared with WT littermates, as detected by immunohistochemistry (n=5). Scale bar, 150 µm. (L) Expression of caspase-3, bax and bcl-2 was detected by Western blot analysis (n=5). Total protein was collected from the IVD tissues of 6-month-old WT and CST-/- mice, and Western blot analysis was performed. (M) Expression of caspase-3, bax and bcl-2 was examined by real-time PCR (n=5). Normalized values were calibrated against the wild-type (WT) group and given a value of 1. (N) Immunofluorescence to detect Annexin-V in NP cells isolated from 6-month-old WT and CST-/- mice (n=5). Nuclei were stained with DAPI. Scale bar, 100 µm. (O) Quantification of NP cell apoptosis in the WT and CST-/- mice, as detected by flow cytometry (n=5). (P) Apoptosis rates in the two groups. *p<0.05 and **p<0.01 vs. the WT group. Data are presented as the mean ± SD.
Figure 3
Figure 3
CST knockout exaggerated mitochondrial ROS-dependent activation of the NLRP3 inflammasome. (A) Representative TEM images of the mitochondria in NP cells from WT and CST-/- mice (n=5). A low-field image of a whole cell and magnified high-field images of swollen mitochondria are shown. Scale bars, 5 µm (upper panel), 2 µm (lower panel). (B-C) Western blot analysis of the mitochondrial morphology-related proteins Drp1, OPA1 and Mfn1/2 and analysis of the normalized protein levels (n=5). Total protein was collected from NP cells isolated from WT and CST-/- mice. (D-E) Western blot analysis of pAMPK, AMPK and PGC1α, key regulators of mitochondrial biogenesis and dynamics, and analysis of the normalized protein levels (n=5). Total protein was collected from NP cells isolated from WT and CST-/- mice. (F-G) Representative images and quantification of ROS levels in the WT and CST-/- groups (n=5). Scale bar, 20 µm. (H) ATP production in the WT and CST-/- groups (n=5). (I) Western blot analysis of NLRP3 in the WT and CST-/- groups (n=5). (J) The expression of IL-1β in culture media supernatants from the WT and CST-/- groups, as detected by ELISA (n=5). (K) Representative images of NLRP3 and IL-1β expression in the WT and CST-/- groups, as assayed by immunofluorescence (n=5). Nuclei were stained with DAPI. Scale bar, 20 µm. *p<0.05 and **p<0.01 vs. the WT control group. n.s., not significant. Data are presented as the mean ± SD.
Figure 4
Figure 4
Exogenous CST restored the homeostasis of cultured NP cells and NP tissues stimulated with TNF-α. (A) The expression of IL-1β in human NP cell culture media following stimulation with TNF-α with or without additional treatment with exogenous CST, as detected by ELISA (n=5). (B) Western blot analysis of MMP-13, ADAMTS-5, Col 2 and Aggrecan in human NP cells (n=5). (C) Immunofluorescence of MMP-13 in human NP cells (n=5). Nuclei were stained with DAPI. Scale bar, 20 µm. (D) Safranin O staining of ex vivo-cultured murine IVD tissues (n=5). Murine IVD tissues were cultured under TNF-α stimulation in the presence or absence of CST. Scale bar, 150 µm. (E) Expression of IL-1β in the culture media of murine IVD tissues (n=5). (F-G) The mRNA expression of MMP-13, ADAMTS-5, Col 2 and Aggrecan, as measured by real-time PCR. Total mRNA was collected from the murine IVD tissues of each indicated group, and real-time PCR was performed (n=5). Normalized values were calibrated against the control group and given a value of 1. (H) Western blot analysis of Col 2 and Aggrecan in murine IVD tissues (n=5). (I) Representative images showing Safranin O staining of ex vivo-cultured human IVD tissues (n=5). Human IVD tissues were cultured under TNF-α stimulation in the presence or absence of CST. Scale bar, 100 µm. (J) The release of GAG in the culture media of each group of ex vivo-cultured human IVD tissues (n=5). (K) Immunohistochemistry to detect MMP-13 and ADAMTS-5 in ex vivo-cultured human IVD tissues (n=5). Scale bar, 100 µm. (L) Relative mRNA expression of MMP-13 and ADAMTS-5 in ex vivo-cultured human IVD tissues, as measured by real-time PCR (n=5). (M) Western blot analysis of Col 2 and Aggrecan in ex vivo-cultured human IVD tissues (n=5). (N) The expression of IL-1β in the culture media of groups of ex vivo-cultured human IVD tissues, as detected by ELISA (n=5). *p<0.05, **p<0.01 and ***p<0.001 vs. the indicated control group. Data are presented as the mean ± SD.
Figure 5
Figure 5
CST treatment suppressed mitochondrial ROS-dependent activation of the NLRP3 inflammasome in NP cells. (A) Representative TEM images of mitochondria in human NP cells from each indicated group (n=5). Human NP cells were cultured under TNF-α stimulation in the presence or absence of CST. A low-field image of a whole cell and magnified high-field images are shown. Swollen mitochondria in TNF-α-stimulated NP cells are indicated by red arrows. Scale bar, 5 µm (upper panel), 2 µm (lower panel). (B) Representative fluorescence images of mitochondria in NP cells (n=5). Cells were counterstained with phalloidin (green). Scale bar, 10 µm. (C) JC-1 assay of NP cells in each indicated group (n=5). Scale bar, 20 µm. (D) The red: green fluorescence ratio used for quantification via JC-1 assay (n=5). (E-F) Representative images and quantification of ROS levels in human NP cells in each indicated group (n=5). Scale bar, 20 µm. (G) Representative immunofluorescence images showing NLRP3 in human NP cells (n=5). Scale bar, 20 µm. (H) Relative mRNA expression of caspase-3, bax and bcl-2 in the human NP cells of each indicated group, as measured by real-time PCR (n=5). (I) Western blot analysis of caspase-3, bax and bcl-2 in the human NP cells of each indicated group (n=5). (J) TUNEL staining of the human NP cells of each indicated group (n=5). Nuclei were stained with DAPI. Scale bar, 100 µm. (K) Quantification of NP cell apoptosis by flow cytometry (n=5). *p<0.05, **p<0.01 and ***p<0.001 vs. the indicated control group. Data are presented as the mean ± SD.
Figure 6
Figure 6
CST protected against IVD degeneration through regulating the NF-κB signalling pathway. (A) Relative mRNA expression of NF-κB1 in IVD tissues from 6-month-old WT and CST-/- mice, as measured by real-time PCR. Normalized values were calibrated against the wild-type (WT) group and given a value of 1 (n=5). (B) Immunohistochemistry to detect pIκBα in IVD tissues from 6-month-old WT and CST-/- mice (n=5). Scale bar, 150 µm. (C) Nuclear translocation of p65 in NP tissue was enhanced in CST-/- mice, as detected by immunofluorescence (n=5). Scale bar, 100 µm. (D) Representative immunofluorescence images for p65 in the cultured human NP cells of each indicated group (n=5). Nuclei were stained with DAPI. Scale bar, 100 µm. (E) Exogenous CST antagonized the nuclear translocation of NF-κB p65 in human NP cells, as assayed by Western blot analysis. Tubulin and Lamin A are shown as loading controls (n=5). **p<0.01 vs. the indicated control group. Data are presented as the mean ± SD.
Figure 7
Figure 7
CST mimics the role of SN50 in inhibition of the NF-κB signalling pathway. (A) Western blot analysis of MMP-13, ADAMTS-5, Col 2 and Aggrecan in CST-/- NP cells (n=5). Primary CST-/- NP cells were cultured under TNF-α, stimulation with or without additional treatment with SN50, followed by Western blot analysis. (B) Relative mRNA expression of MMP-13, ADAMTS-5, Col 2 and Aggrecan in murine NP cells from CST-/- mice, as measured by real-time PCR (n=5). (C) Immunofluorescence of MMP-13 in murine NP cells from CST-/- mice (n=5). Scale bar, 20 µm. (D) Safranin O staining of ex vivo-cultured CST-/- murine IVD tissues in each indicated group (n=5). Scale bar, 150 µm. (E) Relative mRNA expression of MMP-13, ADAMTS-5, Col 2 and Aggrecan in ex vivo-cultured CST-/- murine IVD tissues, as measured by real-time PCR (n=5). (F) Western blot analysis of MMP-13, ADAMTS-5, Col 2 and Aggrecan in ex vivo-cultured CST-/- murine IVD tissues of each indicated group (n=5). (G) Immunofluorescence of MMP-13 in the ex vivo-cultured CST-/- murine IVD tissues of each indicated group. (n=5). Scale bar, 100 µm. (H) Expression of IL-1β in the culture media of groups of murine CST-/- NP cells, as detected by ELISA (n=5). (I) Representative images of NLRP3 and IL-1β immunofluorescence in the murine CST-/- NP cells of each indicated group (n=5). Scale bar, 20 µm. (J) Representative images of ROS levels in the murine CST-/- NP cells of each indicated group (n=5). Scale bar, 20 µm. *p<0.05, **p<0.01 and ***p<0.001 vs. the indicated control group. Data are presented as the mean ± SD.
Figure 8
Figure 8
Schematic depicting a proposed model for the function of CST in intervertebral disc degeneration.

References

    1. Global regional, national incidence prevalence, years lived with disability for 310 diseases injuries, 1990-2015. a systematic analysis for the Global Burden of Disease Study 2015. Lancet. 2016;388:1545–602. - PMC - PubMed
    1. Cheng X, Zhang L, Zhang K, Zhang G, Hu Y, Sun X. et al. Circular RNA VMA21 protects against intervertebral disc degeneration through targeting miR-200c and X linked inhibitor-of-apoptosis protein. Ann Rheum Dis. 2018;77:770–9. - PMC - PubMed
    1. Alvarez-Garcia O, Matsuzaki T, Olmer M, Miyata K, Mokuda S, Sakai D. et al. FOXO are required for intervertebral disk homeostasis during aging and their deficiency promotes disk degeneration. Aging Cell. 2018;17:e12800. - PMC - PubMed
    1. Desmoulin GT, Pradhan V, Milner TE. Mechanical Aspects of Intervertebral Disc Injury and Implications on Biomechanics. Spine. 2019;20:E457–e64. - PubMed
    1. Wang J, Huang C, Lin Z, Pan X, Chen J, Zheng G. et al. Polydatin suppresses nucleus pulposus cell senescence, promotes matrix homeostasis and attenuates intervertebral disc degeneration in rats. J Cell Mol Med. 2018;22:5720–31. - PMC - PubMed

Publication types

MeSH terms