. 2020 May 30:11:e00132.
doi: 10.1016/j.mec.2020.e00132. eCollection 2020 Dec.

Modeling of nitrogen fixation and polymer production in the heterotrophic diazotroph Azotobacter vinelandii DJ

Affiliations

Modeling of nitrogen fixation and polymer production in the heterotrophic diazotroph Azotobacter vinelandii DJ

Diego Tec Campos et al. Metab Eng Commun. .

Abstract

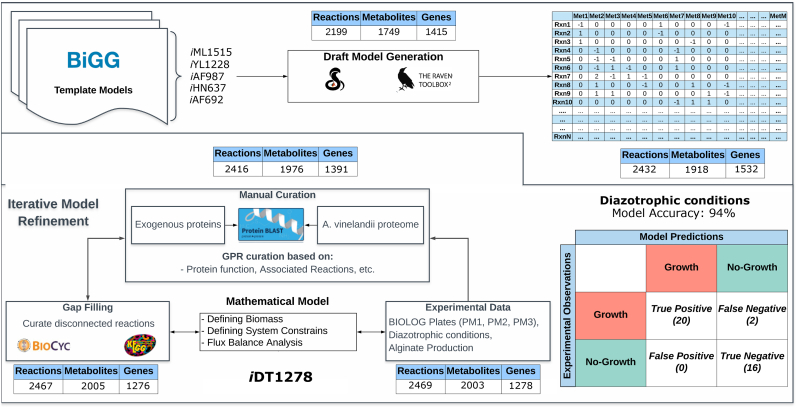
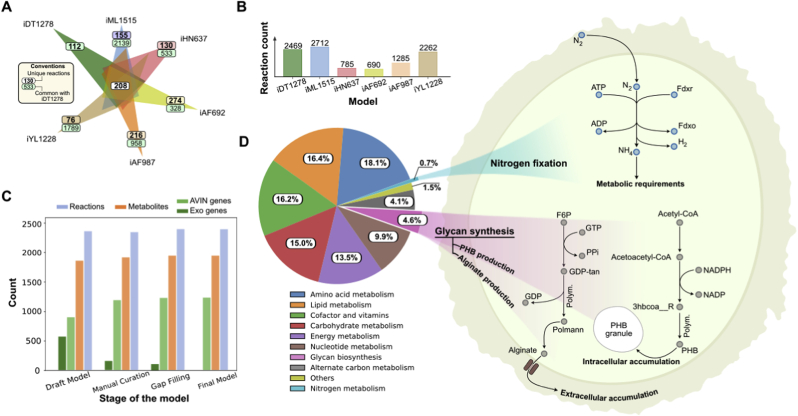
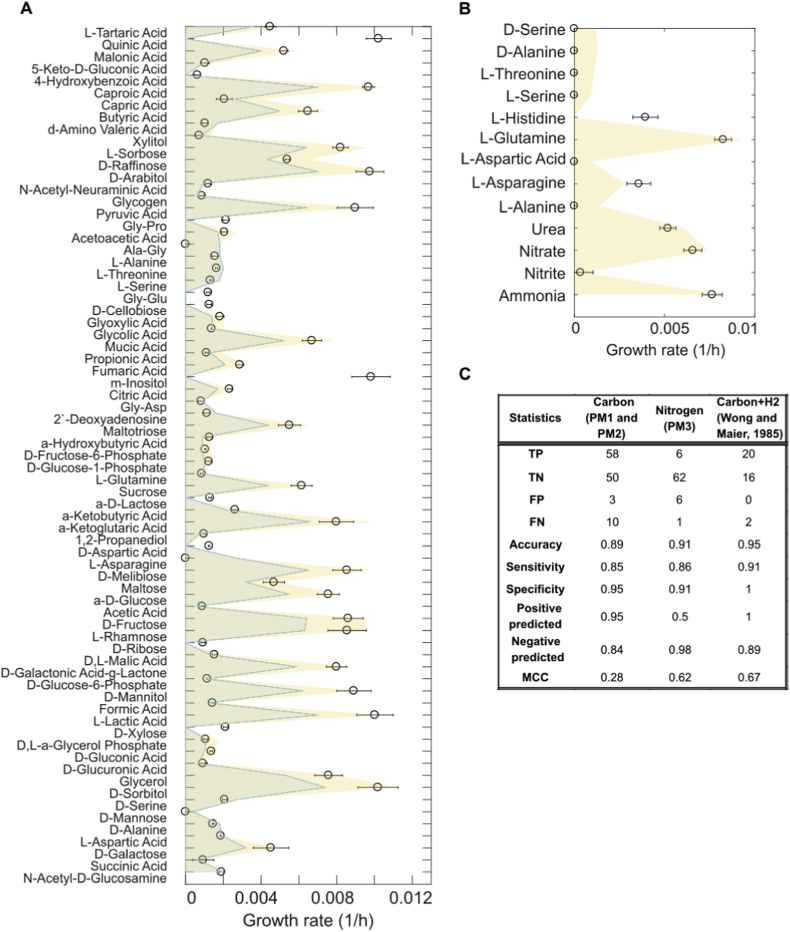
Nitrogen fixation is an important metabolic process carried out by microorganisms, which converts molecular nitrogen into inorganic nitrogenous compounds such as ammonia (NH3). These nitrogenous compounds are crucial for biogeochemical cycles and for the synthesis of essential biomolecules, i.e. nucleic acids, amino acids and proteins. Azotobacter vinelandii is a bacterial non-photosynthetic model organism to study aerobic nitrogen fixation (diazotrophy) and hydrogen production. Moreover, the diazotroph can produce biopolymers like alginate and polyhydroxybutyrate (PHB) that have important industrial applications. However, many metabolic processes such as partitioning of carbon and nitrogen metabolism in A. vinelandii remain unknown to date. Genome-scale metabolic models (M-models) represent reliable tools to unravel and optimize metabolic functions at genome-scale. M-models are mathematical representations that contain information about genes, reactions, metabolites and their associations. M-models can simulate optimal reaction fluxes under a wide variety of conditions using experimentally determined constraints. Here we report on the development of a M-model of the wild type bacterium A. vinelandii DJ (iDT1278) which consists of 2,003 metabolites, 2,469 reactions, and 1,278 genes. We validated the model using high-throughput phenotypic and physiological data, testing 180 carbon sources and 95 nitrogen sources. iDT1278 was able to achieve an accuracy of 89% and 91% for growth with carbon sources and nitrogen source, respectively. This comprehensive M-model will help to comprehend metabolic processes associated with nitrogen fixation, ammonium assimilation, and production of organic nitrogen in an environmentally important microorganism.


Conflict of interest statement

The authors declare that they have no known competing financial interests or personal relationships that could have appeared to influence the work reported in this paper.

Figures

Fig. 1
Fig. 1
Workflow used to reconstruct a metabolic model of A. vinelandii DJ. A draft model was created from five template models present in BiGG (Escherichia coli str. K-12 substr. MG1655, Klebsiella pneumoniae subsp. pneumoniae MGH 78578, Geobacter metallireducens GS-15, Clostridium ljungdahlii DSM 13528 and Methanosarcina barkeri str. Fusaro). The RAVEN toolbox Agren et al., 2013 for MATLAB was used to create the draft model from stoichiometric data. The initial draft model contained 2,432 reactions, 1,918 metabolites, and 1,532 genes. The iterative process of model refinement included manual curation, gap-filling and curation using experimental data. The resultant final model contained A. vinelandii specific metabolic processes such as nitrogen fixation, and production of alginate and PHB. The final model, containing 2,469 reactions, 2,003 metabolites, and 1,278 genes, predicted with 94% accuracy.
Fig. 2
Fig. 2
Characteristics of iDT1278. A) Comparison among the template models (Escherichia coli str. K-12 substr. MG1655, Klebsiella pneumoniae subsp. pneumoniae MGH 78578, Geobacter metallireducens GS-15, Clostridium ljungdahlii DSM 13528 and Methanosarcina barkeri str. Fusaro) and iDT1278 reactions. The six models share 208 core metabolic reactions. A. vinelandii DJ model contains 112 unique reactions related to aromatic compounds metabolism, alginate and PHB production, etc. B) Number of reactions in the template models and A. vinelandii DJ. C) Change in the number of reactions, metabolites and genes at the different stages of the reconstruction process/manual curation of A. vinelandii DJ. D) Reactions distribution through the subsystems in the genome-scale model; subsystems were grouped into 11 groups summarizing the complete metabolism of A. vinelandii DJ. Nitrogen fixation, PHB, and alginate production are highlighted in the condensed pathway diagrams. Alginate accumulation occurs in the extracellular space meanwhile PHB storage happens in the cytoplasm compartment. Nitrogen fixation in A. vinelandii can be performed by different specialized nitrogenases.
Fig. 3
Fig. 3
Model validation using high-throughput phenotypic data for different carbon and nitrogen sources. A) Predicted growth values of A. vinelandii DJ in nitrogen fixation (N2 ​+ ​Carbon source) or ammonium assimilation (NH4 ​+ ​Carbon source) conditions using 121 carbon sources (PM1 and PM2 from Biolog Plates). However, only 71 carbon sources are shown in Fig. 3. B) Estimated growth for 75 nitrogen sources, nevertheless just 12 nitrogen compounds are presented in the graph (PM3 from Biolog Plates). Pyruvate was used to constrain the model as the unique carbon source during the nitrogen validation. C) statistical parameters and Matthews correlation coefficient of the predictions for the carbon (first column) and nitrogen sources (second column) using the Biolog Plates information; true positive (TP), true negative (TN), false positive (FP) and false negative (FN). Statistical analysis of the estimations for 38 carbon sources under nitrogen fixation and H2 consumption conditions (third column). The data used during the simulations were obtained from Wong and Maier (1985).
Fig. 4
Fig. 4
Carbon and nitrogen partitioning distribution from Biolog plates experimental data. A) Average carbon flux correlation coefficients through all subsystems in diazotrophic and non-diazotrophic conditions; B) average nitrogen flux correlation coefficients through all subsystems in diazotrophic and non-diazotrophic conditions.
Fig. 5
Fig. 5
Metabolic flux map distribution of A. vinelandii under diazotrophic and non-diazotrophic conditions. The map displays major metabolic pathways involved in the PHB production. Values of metabolic flux are normalized to a glucose uptake rate of 100. Predicted metabolic fluxes were compared against fluxomic data determined by Wu et al., in 2019. The reactions were labeled according to their percent error (green, blue and red) and nitrogen source (green and yellow). Abbreviations: G6P, glucose-6-phosphate; F6P, fructose-6-phosphate; FDP, fructose-1,6-bisphosphate; G3P, 3-phosphoglycerate; DHAP, dihydroxyacetone phosphate; 13DPG, 3-phosphoglyceroil phosphate; 2 ​PG, 2-phosphoglycerate; PEP, phosphoenolpyruvate; PYR, pyruvate; Cit, citrate; Acon, aconitate; iCit, isocitrate; AKG, a-ketoglutarate; sucCoA, succinyl coenzyme A; Suc, succinate; Fum, fumarate; Mal, malate; OAA, oxaloacetate; GLX, glyoxylate; PHB, polyhydroxybutyrate; 6PGL, 6-phospho-glucono-1,5-lactone; 6PGC, 6-phospho-gluconate; 2DDG6P, 2-Dehydro-3-deoxygluconate 6-phosphate; Ru5P, ribulose-5-phosphate; R5P, ribose-5-phosphate; S7P, sedoheptulose-7-phosphate; X5P, xylulose-5-phosphate; E4P, erythrose-4-phosphate. (For interpretation of the references to colour in this figure legend, the reader is referred to the Web version of this article.)

Similar articles

Cited by

References

    1. Agren R., Liu L., Shoaie S., Vongsangnak W., Nookaew I., Nielsen J. The RAVEN toolbox and its use for generating a genome-scale metabolic model for Penicillium chrysogenum. PLoS Comput. Biol. 2013;9 doi: 10.1371/journal.pcbi.1002980. - DOI - PMC - PubMed
    1. Ambrosio R., Ortiz-Marquez J.C.F., Curatti L. Metabolic engineering of a diazotrophic bacterium improves ammonium release and biofertilization of plants and microalgae. Metab. Eng. 2017;40:59–68. doi: 10.1016/j.ymben.2017.01.002. - DOI - PubMed
    1. Azevedo M.A., Bourbon A.I., Vicente A.A., Cerqueira M.A. Alginate/chitosan nanoparticles for encapsulation and controlled release of vitamin B2. Int. J. Biol. Macromol. 2014;71:141–146. doi: 10.1016/j.ijbiomac.2014.05.036. - DOI - PubMed
    1. Castillo T., Heinzle E., Peifer S., Schneider K., Peña M.C.F. Oxygen supply strongly influences metabolic fluxes, the production of poly(3-hydroxybutyrate) and alginate, and the degree of acetylation of alginate in Azotobacter vinelandii. Process Biochem. 2013;48:995–1003. doi: 10.1016/j.procbio.2013.04.014. - DOI
    1. Chang R.L., Ghamsari L., Manichaikul A., Hom E.F.Y., Balaji S., Fu W., Shen Y., Hao T., Palsson B.Ø., Salehi-Ashtiani K., Papin J.A. Metabolic network reconstruction of Chlamydomonas offers insight into light-driven algal metabolism. Mol. Syst. Biol. 2011;7:518. doi: 10.1038/msb.2011.52. - DOI - PMC - PubMed