Comparative Study
. 2020 Nov 1;202(9):1225-1236.
doi: 10.1164/rccm.201910-1958OC.

Genome-Wide Association Study: Functional Variant rs2076295 Regulates Desmoplakin Expression in Airway Epithelial Cells

Affiliations
Comparative Study

Genome-Wide Association Study: Functional Variant rs2076295 Regulates Desmoplakin Expression in Airway Epithelial Cells

Yuan Hao et al. Am J Respir Crit Care Med. .

Abstract

Rationale: Genetic association studies have identified rs2076295 in association with idiopathic pulmonary fibrosis (IPF). We hypothesized that rs2076295 is the functional variant regulating DSP (desmoplakin) expression in human bronchial epithelial cells, and DSP regulates extracellular matrix-related gene expression and cell migration, which is relevant to IPF development.Objectives: To determine whether rs2076295 regulates DSP expression and the function of DSP in airway epithelial cells.Methods: Using CRISPR (clustered regularly interspaced short palindromic repeat)/Cas9 editing (including regional deletion, indel, CRISPR interference, and single-base editing), we modified rs2076295 and measured DSP expression in edited 16HBE14o- and primary airway epithelial cells. Cellular integrity, migration, and genome-wide gene expression changes were examined in 16HBE14o- single colonies with DSP knockout. The expression of DSP and its relevant matrix genes was measured by quantitative PCR and also analyzed in single-cell RNA-sequencing data from control and IPF lungs.Measurements and Main Results:DSP is expressed predominantly in bronchial and alveolar epithelial cells, with reduced expression in alveolar epithelial cells in IPF lungs. The deletion of the DNA region-spanning rs2076295 led to reduced expression of DSP, and the edited rs2076295GG 16HBE14o- line has lower expression of DSP than the rs2076295TT lines. Knockout of DSP in 16HBE14o- cells decreased transepithelial resistance but increased cell migration, with increased expression of extracellular matrix-related genes, including MMP7 and MMP9. Silencing of MMP7 and MMP9 abolished increased migration in DSP-knockout cells.Conclusions: rs2076295 regulates DSP expression in human airway epithelial cells. The loss of DSP enhances extracellular matrix-related gene expression and promotes cell migration, which may contribute to the pathogenesis of IPF.

Keywords: CRISPR/Cas9 genome-editing; DSP; bronchial epithelial cells; cell migration; rs2076295.


Figures
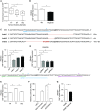
Figure 1.
Figure 1.
Genetic variant rs2076295 regulates DSP (desmoplakin) expression. (A) Expression of DSP in human bronchial epithelial cells collected from brushing with various genotypes of rs2076295. n = 7–11 subjects/genotype group, as indicated by numbers inside each column. (B) Expression of DSP in edited 16HBE14o- cells targeting rs2076295 for regional deletion by CRSIPR/Cas9. Means ± SEM are from six biological replicates. (C) Upper: Sequencing results in empty vector-transfected wild-type (WT) and three clonal cell lines with CRISPR (clustered regularly interspaced short palindromic repeat) (CRISPR)/Cas9–edited indel mutations targeting rs2076295. The inserted DNA bases are displayed in red, with the number of deleted (−) or inserted (+) bases for each clone shown on the right. Lower: Measurements on the expression of DSP in three indel single clones of 16HBE14o- cells and one WT control are shown. Means ± SEM are from at least four biological replicates. (D) Upper: Expression of DSP in 16HBE14o- cells edited by CRISPR interference (CRISPRi) targeting rs2076295. Means ± SEM are two biological replicates. Location of three single guide RNAs designed for CRISPRi targeting rs2076295 are indicated below. (E) Expression of DSP in 16HBE14o- lines (GT) edited by CRISPR/Cas9 method into homozygous (TT or GG) at rs2076295. Means ± SEM are from four to nine biological replicates of each isogenic line. (F) Relative luciferase activity with either G or T allele of rs2076295 as measured in reporter assay with endogenous DSP promoter cloned in pGL3 basic vector and transfected into 16HBE14o- cells. Means ± SEM are from two biological replicates representative of four biological repeats. (G) Expression of DSP in primary normal human bronchial epithelial cells with or without rs2076295 regional deletion by CRISPR/Cas9. Means ± SEM are from three biological replicates. WT control cells are cells transfected with empty vector. *P < 0.05, unpaired t test (for A–E and G) and Mann-Whitney test (for F). NHBE = normal human bronchial epithelial; sgRNA = single guide RNA.
Figure 2.
Figure 2.
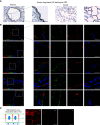
Localization of DSP (desmoplakin) in human lungs. (A) Representative images and enlarged images (in the black squares) of immunohistochemistry staining for DSP in the bronchi and alveoli in human lung tissue. Scale bars, 10 μm. (B) Representative images and enlarged images (in the white squares) of immunofluorescence staining of DSP (green) and various cell-type markers (red), including T1α, ABCA3, acetylated tubulin, CC10, and keratin 5, with DAPI (blue) in human lung tissue. Scale bars, 20 μm. The white dashed line indicates the basal membrane. (C) Images of immunofluorescence staining of DSP in differentiated human airway epithelial cells at the air–liquid interface after 7 days of differentiation. The three dashed lines (a–c) indicate the levels where images were taken (the top, middle, and bottom areas of the luminal epithelial cells at cross-section). Scale bars, 50 μm. ABCA3 = ATP-binding cassette subfamily A member 3; ACTTUB = acetylated tubulin; ALI = air–liquid interface; IHC = immunohistochemistry; Krt5 = keratin 5; T1α = lung type I cell membrane–associated glycoprotein.
Figure 3.
Figure 3.
Generation of DSP (desmoplakin)-knockout (KO) lines in 16HBE14o- human bronchial epithelial cell line. (A) Expression of DSP in three single colonies of 16HBE14o- cells with DSP-KO (KO1, KO2, and KO3) using CRISPR (clustered regularly interspaced short palindromic repeat)/Cas9 targeting the coding region of DSP. Means ± SEM are from four biological replicates. (B) The levels of DSP as measured in wild-type (WT) and DSP-KO 16HBE14o- cells by Western blotting. Vinculin was applied as a loading control. (C) The representative immunofluorescence staining of DSP (green) and keratin 5 (red) in DSP-KO cells and control cells. Nuclei are counterstained with DAPI (blue). Scale bars, 10 μm. (D) The transepithelial electrical resistance (TEER) measurement in WT and three DSP-KO 16HBE14o- cells cultured on transwells for 18 continuous days. Means ± SEM are shown from triplicate wells within each line. One representative result is shown from two biological replicates. A linear mixed effects model with Dunnett’s post hoc test used to compare difference among four groups demonstrated significant difference among groups over time. Significantly reduced TEER was found in at least two KO lines compared with WT cells, starting from day 7 to Day 18. (E) TEER measurements on Day 18 in D were shown in WT and DSP-KO cells. *P < 0.05, unpaired t test. WT control cells are cells transfected with empty vector. Krt5 = keratin 5.
Figure 4.
Figure 4.
Influences of DSP (desmoplakin)-knockout (KO) on epithelial–mesenchymal transition, and bronchial epithelial cell migration. (A) Expression of epithelial markers (CDH1, COL4A1, and SDC1) and mesenchymal markers (SNAI1, VIM, and S100A4) in control and DSP-KO 16HBE14o- cells measured by quantitative PCR. Means ± SEM are from four biological replicates. GAPDH was applied as a reference gene. *False discovery rate–adjusted P value < 0.05, unpaired t tests with false discovery rate correction for multiple testing. (B) The Western blotting result of mesenchymal and epithelial markers in control and DSP-KO 16HBE14o- cells. α-Tubulin was applied as a loading control. (C) The representative images and enlarged images of immunofluorescence staining of E-cadherin (green) and vimentin (red) with DAPI (blue) staining in wild-type (WT) and DSP-KO 16HBE14o- cells. Scale bars, 50 μm. (D) The representative images of cell migration assays in WT, DSP-KO, and rs2076295 indel mutant 16HBE14o- cells at 0 and 24 hours after migration initiation. The leading edges of the migrated cells were outlined by black lines. (E) Quantification on cell migration rate by fluorescence measurement with Calcein-AM dye. Means ± SEM are from three biological replicates. (F) The representative images of cell migration assays in WT and two ex vivo induced DSP-KO mouse tracheal basal cells at 0 and 48 hours after migration initiation. The leading edges of the migrated cells are outlined by black lines. *P < 0.05, unpaired t test. (G) Quantification on cell migration rate by fluorescence measurement with Calcein-AM dye. Means ± SEM are from triplicate wells in the tracheal basal cells isolated from WT (DSPfl/fl) and two ex vivo induced DSP-KO mice (DSPfl/fl+Cre). *P < 0.05, unpaired t test. (H) Expression of DSP in mouse tracheal basal cells used in G. Means ± SEM are from duplicate wells. WT control cells in A–E are cells transfected with empty vector. E-cad = E-cadherin; Indel = insertions or deletions of three or multiples of three base pairs; VIM = vimentin.
Figure 5.
Figure 5.
DSP (desmoplakin) regulates extracellular matrix (ECM)-related gene expression and cell migration in bronchial epithelial cells. (A) The heatmap of RNA-sequencing results showing differentially expressed ECM-related genes in DSP-knockout (KO) 16HBE14o- cells compared with wild-type (WT) control cells. (B) Relative expression of DSP-regulated ECM-related genes identified from RNA-sequencing results in WT and three clones of DSP-KO 16HBE14o- cells (KO1, KO2, and KO3). Means ± SEM are from two biological replicates for each individual clone. (C) Relative expression of DSP-regulated ECM-related genes in rs2076295 indel mutation cells (Indel) versus WT control. Means ± SEM are from two biological replicates. (D) Relative expression of DSP- and ECM-related genes in WT and DSP-KO primary human bronchial epithelial cells cultured at the air–liquid interface for 7 days. Means ± SEM are from duplicate wells. (E) Relative expression of ECM-related genes in EpCAM+ lung epithelial cells from a DSP flox/flox mouse treated with Adeno-Cre followed by subsequent culture at three-dimensional organoid models. Means ± SEM are from two independent replicates. *False discovery rate–adjusted P value < 0.05, unpaired t tests with false discovery rate correction for multiple testing for B–E. (F) The representative images of WT and DSP-KO 16HBE14o- cells with or without knockdown of MMP7 and MMP9 in migration assay at 24 hours after migration initiation. The leading edges of the migrated cells were outlined in black. (G) The cell migration rate in WT and DSP-KO 16HBE14o- cells after knockdown of individual ECM-related genes by siRNAs. Means ± SEM are from three biological replicates. * or §P < 0.05, two-way ANOVA with Dunnett’s post hoc test comparing cells transfected with siRNA targeting various genes to cells transfected with negative control within DSP-KO or WT groups, respectively. #P < 0.05, unpaired t test comparing between WT and DSP-KO cells. WT control cells are cells transfected with empty vector. ALI = air–liquid interface; EpCAM = epithelial cell adhesion molecule; NHBE = normal human bronchial epithelial cells.
Figure 6.
Figure 6.
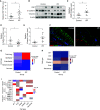
Detection of DSP (desmoplakin) and its regulated genes in human idiopathic pulmonary fibrosis (IPF) lungs. (A) Expression of DSP in human IPF (n = 16) and control lungs (n = 16). *P < 0.05, unpaired t test. (B) Protein levels of DSP, E-cadherin, and vimentin measured in healthy control and IPF lungs by Western blotting. β-actin was applied as a loading control. (C–E) The quantification of protein levels for DSP, E-cadherin, and vimentin in the lung of healthy control (n = 15) and IPF (n = 14) lungs. Means ± SEM are shown. *P < 0.05, unpaired t test (for C) or Mann-Whitney test (for D and E). (F) The representative images of immunofluorescence staining of E-cadherin (green), vimentin (red), and DAPI (blue) in human control and IPF lung tissue. Scale bars, 20 μm. (G) Heatmap showing average expression of DSP in control and IPF lungs using data from single-cell RNA-sequencing in human IPF lungs. (H) Heatmap showing the average expression of DSP within various lung epithelial subtypes. (I) Heatmap showing average log2 fold difference in gene expression between IPF and control lungs by cell type categories. Genes with an adjusted P value lower than 0.10 were plotted. AT1 = type I alveolar epithelial cells; AT2 = alveolar type II epithelial cells; avg_diff = average log2 fold difference; E-Cad = E-cadherin; ECM = extracellular matrix; VIM = vimentin.

Comment in

Similar articles

Cited by

References

    1. Richeldi L, Collard HR, Jones MG. Idiopathic pulmonary fibrosis. Lancet. 2017;389:1941–1952. - PubMed
    1. Martinez FJ, Collard HR, Pardo A, Raghu G, Richeldi L, Selman M, et al. Idiopathic pulmonary fibrosis. Nat Rev Dis Primers. 2017;3:17074. - PubMed
    1. Ley B, Collard HR, King TE., Jr Clinical course and prediction of survival in idiopathic pulmonary fibrosis. Am J Respir Crit Care Med. 2011;183:431–440. - PubMed
    1. Xaubet A, Ancochea J, Molina-Molina M. Idiopathic pulmonary fibrosis [in English, Spanish] Med Clin (Barc) 2017;148:170–175. - PubMed
    1. Allen RJ, Guillen-Guio B, Oldham JM, Ma SF, Dressen A, Paynton ML, et al. Genome-wide association study of susceptibility to idiopathic pulmonary fibrosis. Am J Respir Crit Care Med. 2020;201:564–574. - PMC - PubMed

Publication types