. 2020 Nov 1;37(21):2244-2260.
doi: 10.1089/neu.2020.7066. Epub 2020 Aug 10.

Red-Light (670 nm) Therapy Reduces Mechanical Sensitivity and Neuronal Cell Death, and Alters Glial Responses after Spinal Cord Injury in Rats

Affiliations

Red-Light (670 nm) Therapy Reduces Mechanical Sensitivity and Neuronal Cell Death, and Alters Glial Responses after Spinal Cord Injury in Rats

Di Hu et al. J Neurotrauma. .

Abstract

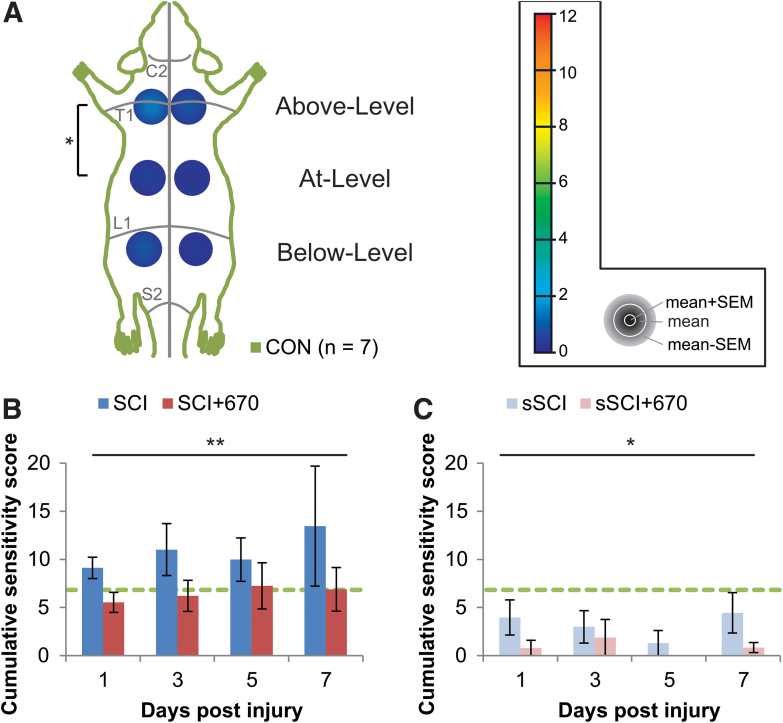
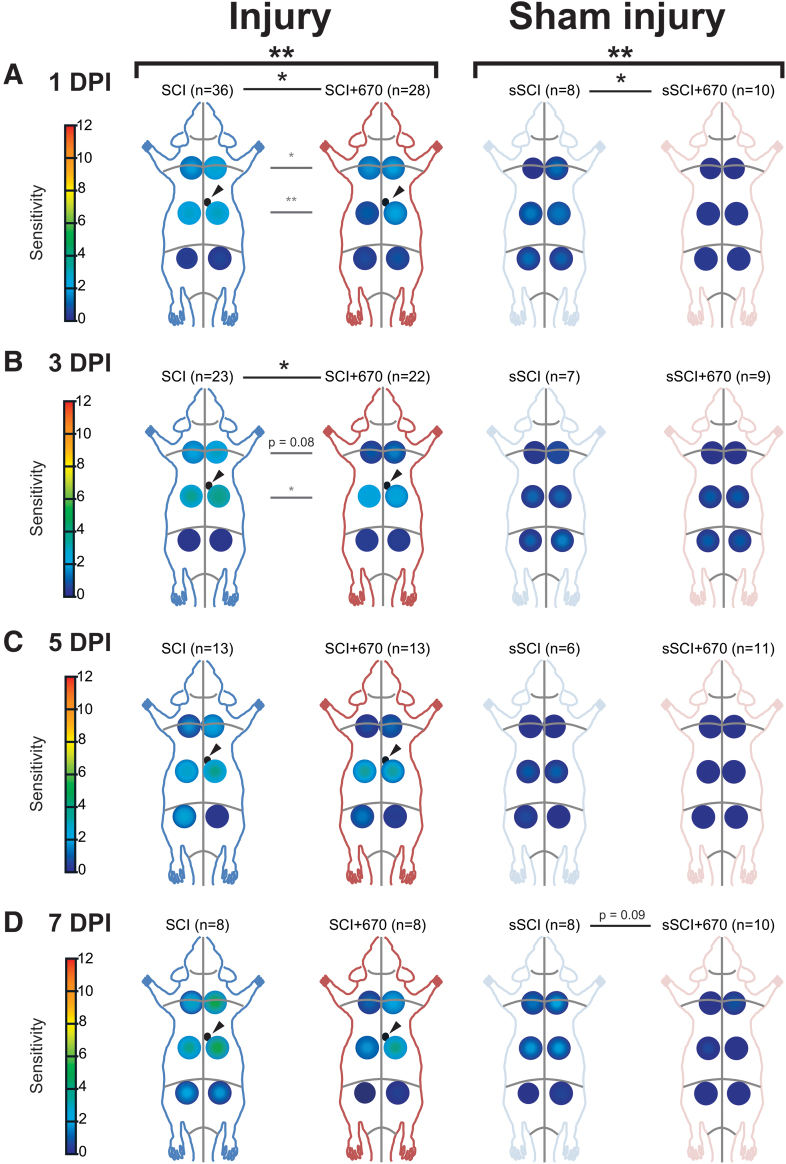
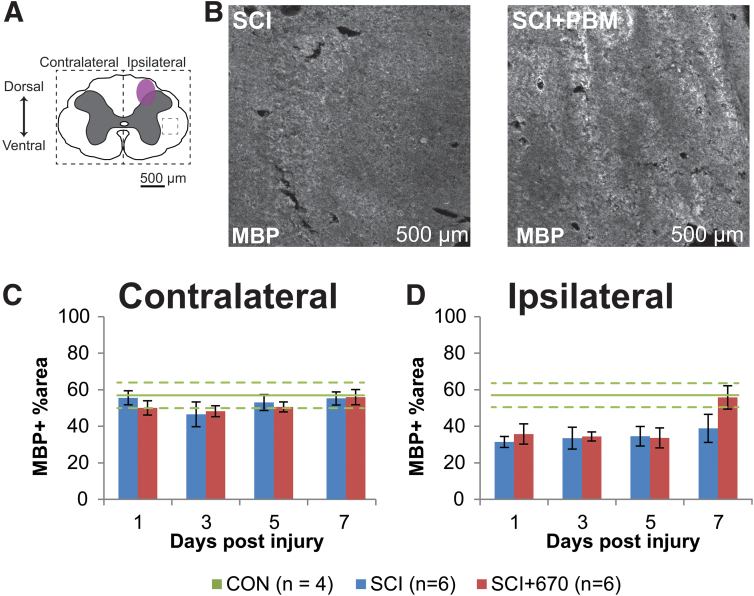
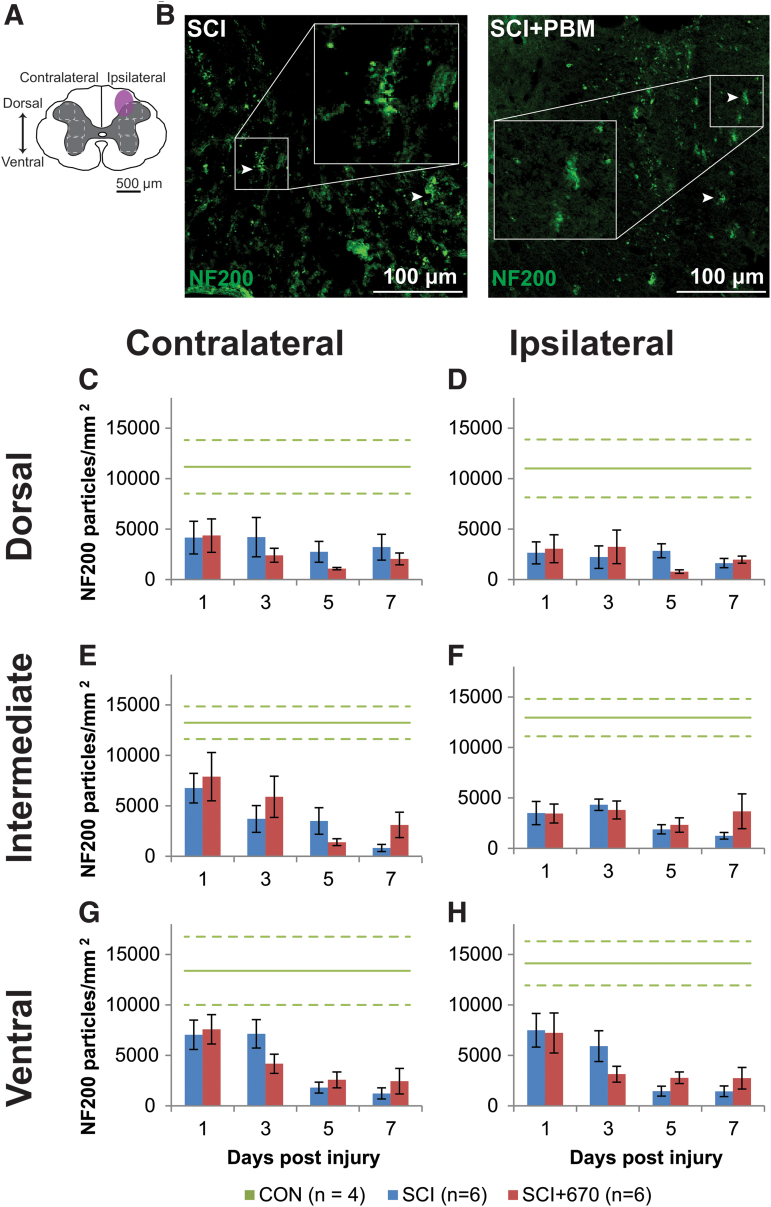
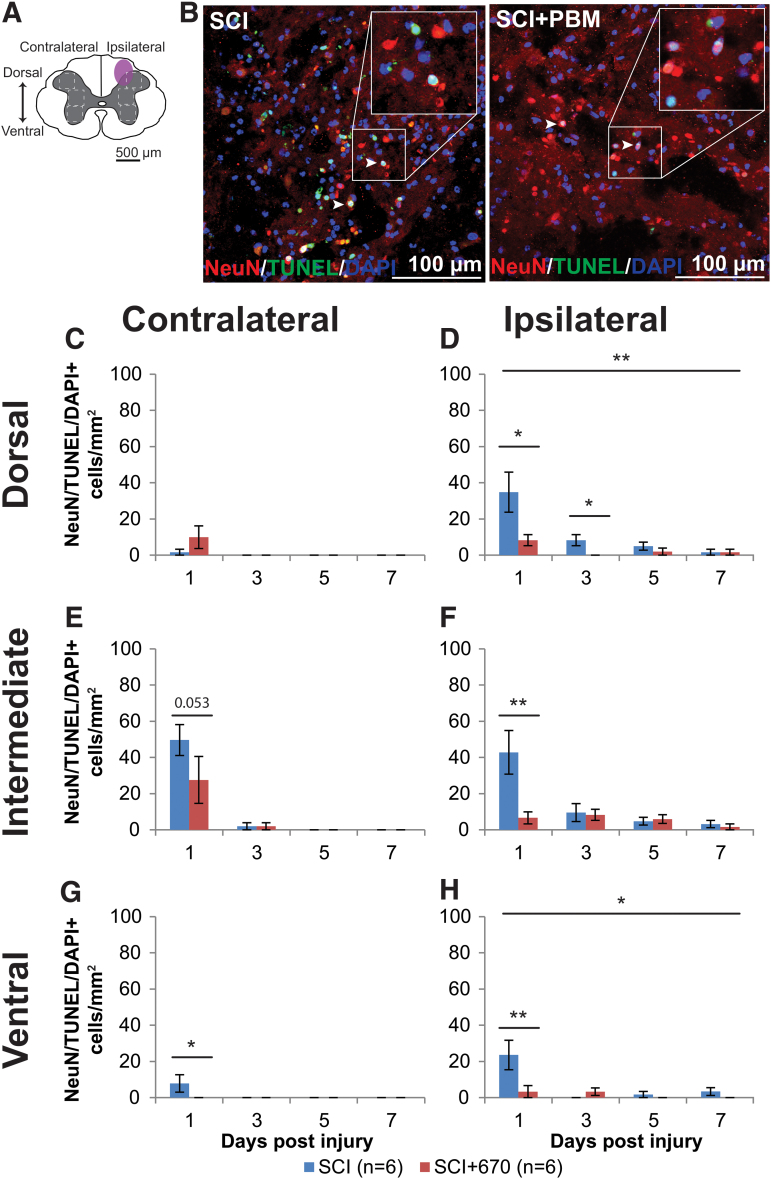
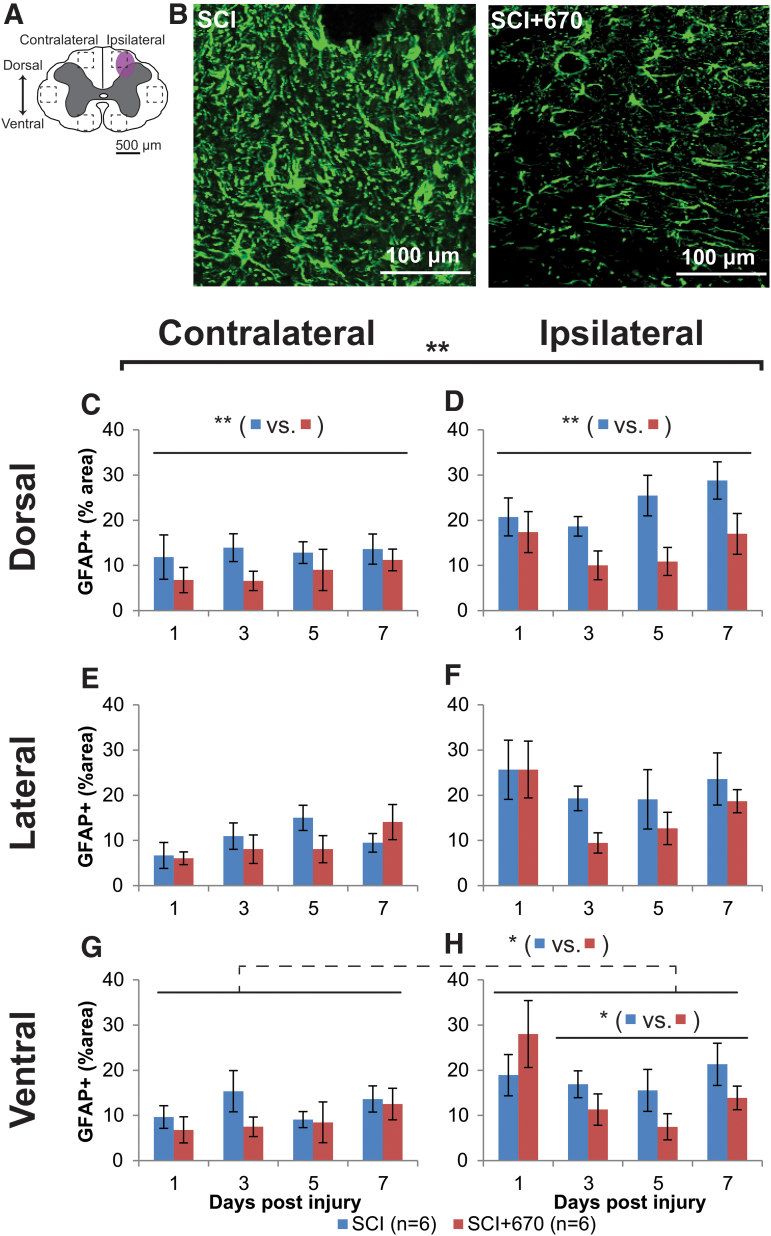
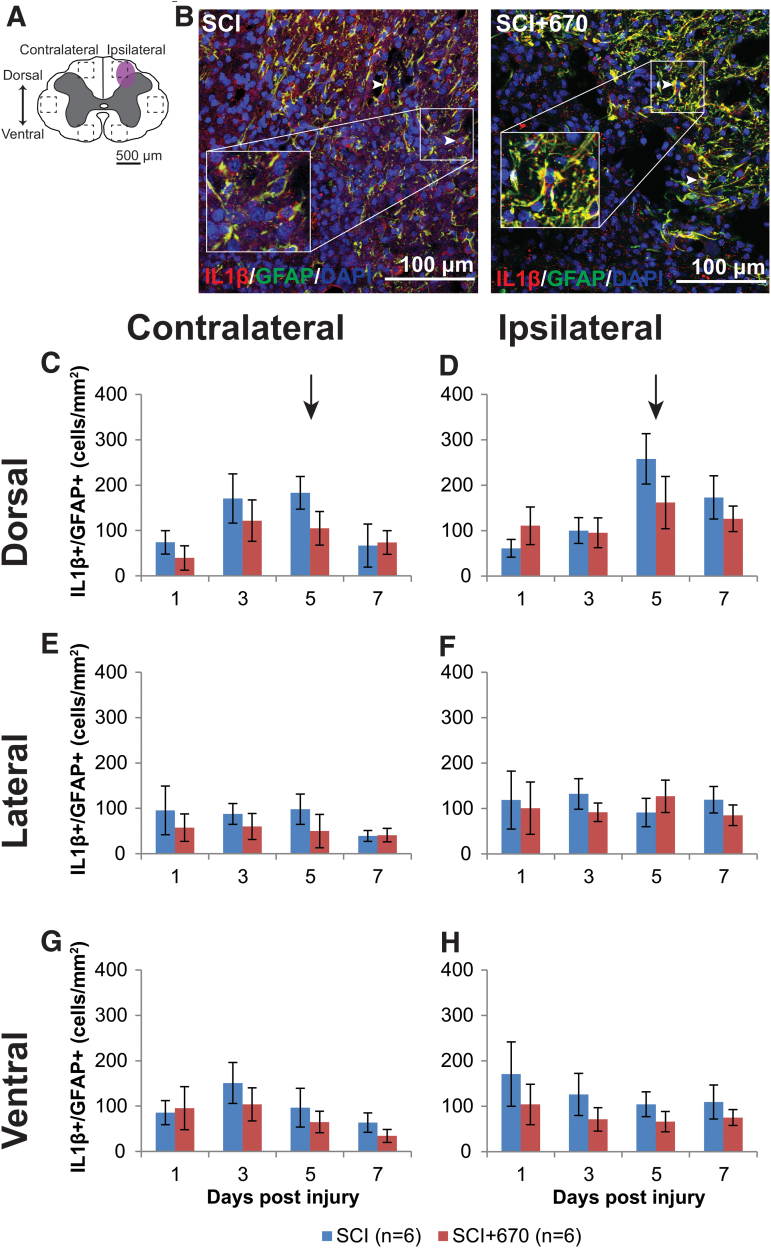
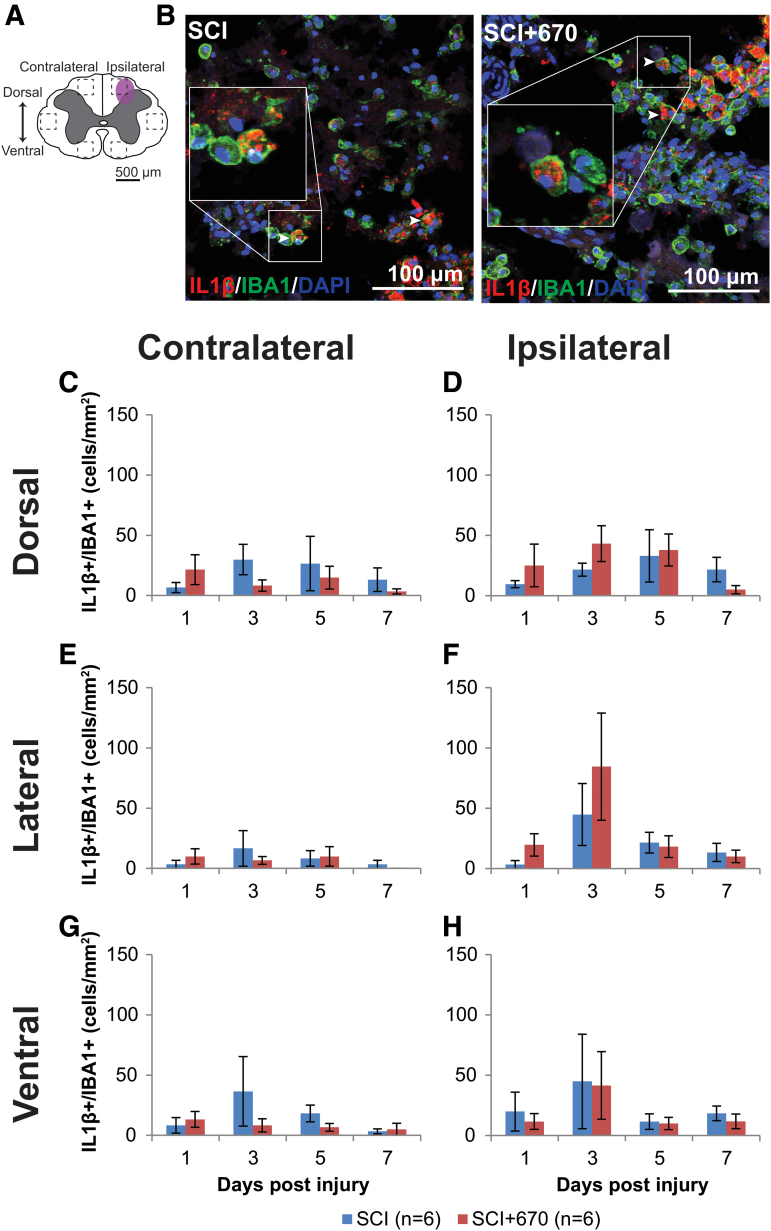
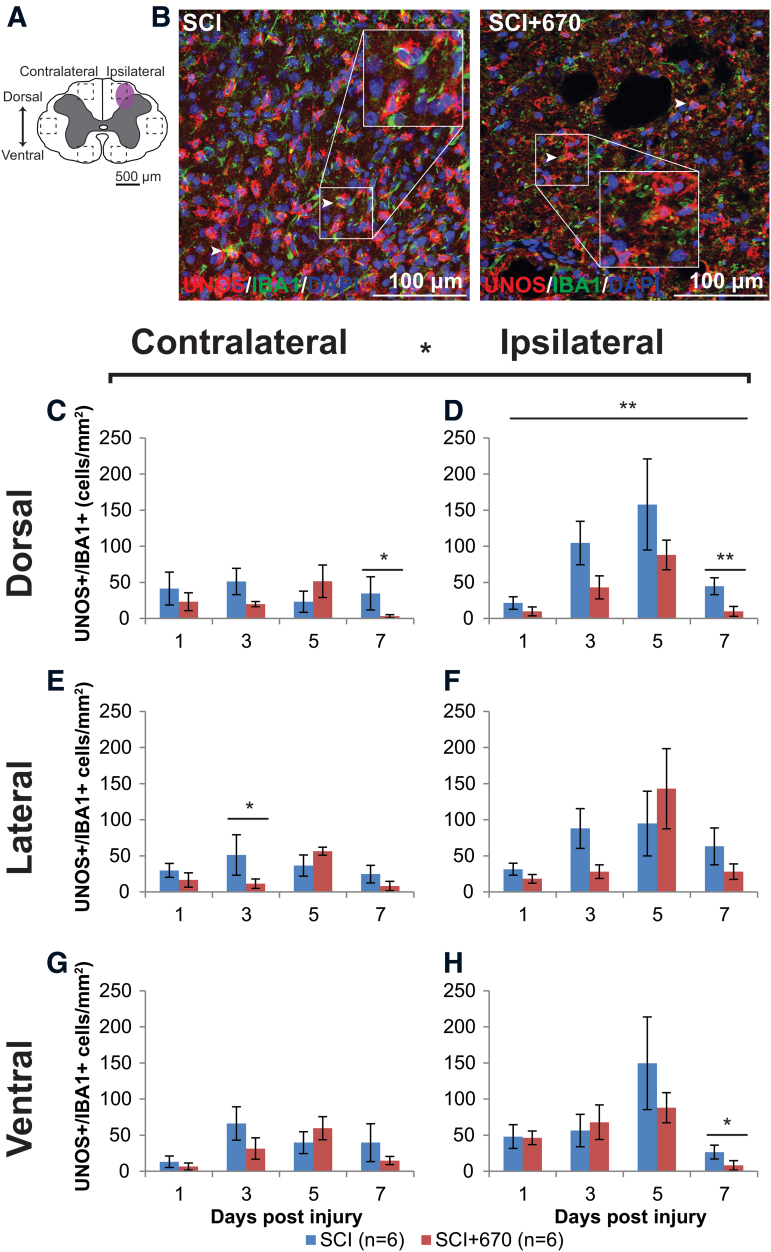
Individuals with spinal cord injury (SCI) often develop debilitating neuropathic pain, which may be driven by neuronal damage and neuroinflammation. We have previously demonstrated that treatment using 670 nm (red) light irradiation alters microglia/macrophage responses and alleviates mechanical hypersensitivity at 7 days post-injury (dpi). Here, we investigated the effect of red light on the development of mechanical hypersensitivity, neuronal markers, and glial response in the subacute stage (days 1-7) following SCI. Wistar rats were subjected to a mild hemi-contusion SCI at vertebra T10 or to sham surgery followed by daily red-light treatment (30 min/day; 670 nm LED; 35 mW/cm2) or sham treatment. Mechanical sensitivity of the rat dorsum was assessed from 1 dpi and repeated every second day. Spinal cords were collected at 1, 3, 5, and 7 dpi for analysis of myelination, neurofilament protein NF200 expression, neuronal cell death, reactive astrocytes (glial fibrillary acidic protein [GFAP]+ cells), interleukin 1 β (IL-1β) expression, and inducible nitric oxide synthase (iNOS) production in IBA1+ microglia/macrophages. Red-light treatment significantly reduced the cumulative mechanical sensitivity and the hypersensitivity incidence following SCI. This effect was accompanied by significantly reduced neuronal cell death, reduced astrocyte activation, and reduced iNOS expression in IBA1+ cells at the level of the injury. However, myelin and NF200 immunoreactivity and IL-1β expression in GFAP+ and IBA1+ cells were not altered by red-light treatment. Thus, red-light therapy may represent a useful non-pharmacological approach for treating pain during the subacute period after SCI by decreasing neuronal loss and modulating the inflammatory glial response.

Keywords: neuroinflammation; neuronal death; neuropathic pain; photobiomodulation; spinal cord injury.


Conflict of interest statement

No competing financial interests exist.

Figures

<b>FIG. 1.</b>
FIG. 1.
Cumulative sensitivity is increased up to 7 dpi following mild T10 hemi-contusion SCI but reduced after red-light treatment. (A) RSSs of the CON group (n = 7) showing the mean + SEM, mean, and mean – SEM in concentric order as indicated by the color scale and accompanying gray legend (insert). RSSs, obtained from six regions (left and right sides; “Above-Level,” “At-Level,” and “Below-Level” relative to T10 injury), are overlaying a schematic representation of the rat dorsum, with C2, T1, L1, and S1 dermatomes and midline indicated (gray lines). Statistical comparison between levels is indicated by the black bracket. (B) CSSs in all spinal-cord injured animals with (SCI+670) or without (SCI) red-light treatment. (C) CSSs in all sham-injured animals with sSCI+670 or without (sSCI) red-light treatment. Green-dashed line indicates hypersensitivity threshold (6.92) derived from CON group (see Methods section). Statistical comparison between levels in CON group (vertical bracket, CLMM) and between SCI and SCI+670 groups across the time-points (black line, CLMM) are indicated. Data are expressed as mean ± SEM; *p < 0.05, **p < 0.01. See Figure 2 for n values for all groups at each time-point. CLMM, cumulative link mixed model; CSS, cumulative sensitivity score (sum of RSSs); CON, non-injured control; dpi, days post-injury; RSS, regional sensitivity score; SEM, standard error of the mean. Color image is available online.
FIG. 2.
FIG. 2.
At-Level and Above-Level regional sensitivity are reduced by red-light treatment. RSSs in SCI (blue), SCI+670 (red), sSCI (light blue), and sSCI+670 (pink) animals at (A) 1 dpi, (B) 3 dpi, (C) 5 dpi, and (D) 7 dpi are shown for all animals investigated. Arrowheads indicate location of T10 hemi-contusion injury (small black circles) in SCI groups. Statistical comparisons between two groups across all time-points (black bracket, CLMM), across all levels at individual time-points (black lines, CLMM), and between two groups at different levels (gray lines, CLMM) are indicated. Data are expressed as mean ± SEM as per Figure 1A inset; n values indicated for each group; *p < 0.05, **p < 0.01, p-value indicated for 0.1 < p < 0.05. CLMM, cumulative link mixed model; dpi, days post-injury; RSS, regional sensitivity score; SCI, spinal-cord injured untreated; SCI+670, spinal-cord injured + red-light treatment; sSCI, sham-injured untreated; sSCI+670, sham-injured + red-light treatment; SEM, standard error of the mean. Color image is available online.
FIG. 3.
FIG. 3.
Ipsilateral demyelination was observed from 1–5 dpi post hemi-contusion SCI. (A) Schematic representation of the spinal cord illustrates the approximate location of the injury epicenter (purple shaded area) and region of interest (dotted) for MBP labeling quantification. (B) Example images are shown of positive MBP labeling (white) from sham- and light-treated groups ipsilateral to the injury at the dorsal level at 7 dpi (region of example images indicated by small dashed box in A). (C,D) Quantification of MBP-positive labeling, expressed as the percentage area of positive label above background within the region of interest (dotted boundaries in A), contralateral (C), and ipsilateral (D) to the injury of sham- and light-treated groups. Data for control animals are shown (solid green, mean; dotted green, SEM. All other data expressed as mean ± SEM; n values indicated (legend) are for each time-point. dpi, days post-injury; MBP, myelin basic protein; SCI, spinal cord injury; SEM, standard error of the mean. Color image is available online.
None
FIG.4. NF200 density is reduced following spinal cord injury but not altered by red-light treatment. (A) The schematic representation of the spinal cord illustrates the dorsal, intermediate, and ventral regions of interest for analysis (enclosed by dashed lines, 0.1 mm2). Approximate location of injury is indicated (purple shaded area). (B) Example images of NF200 (green) positive labeling from spinal-cord injured sham- and light-treated groups ipsilateral to the injury at dorsal level at 7 dpi. (C,D) Quantification of NF200+ labeling expressed as positive particle density within the region of interest, in the dorsal region of the spinal cord, contralateral (C) and ipsilateral (D) to the injury of sham- and light-treated groups. (E,F) NF200+ particle density in the intermediate regions of interest contralateral (E) and ipsilateral (F) to the injury. (G,H) NF200+ particle density in the ventral regions of interest contralateral (G) and ipsilateral (H) to the injury. Data for control animals are shown (solid green, mean; dotted green, SEM). All other data expressed as mean ± SEM; n values indicated for each time-point (legend). See text for statistical comparisons. dpi, days post-injury; SCI, spinal-cord injured animals without red-light treatment; SCI+670, spinal-cord injured animals with red-light treatment; SEM, standard error of the mean. Color image is available online.
FIG. 5.
FIG. 5.
Neuronal cell death occurs early following spinal cord injury, which is reduced by 670 nm treatment. (A) The schematic representation of the spinal cord illustrates the dorsal, intermediate, and ventral regions of interest for analysis (enclosed by dashed lines, 0.1 mm2). Approximate location of injury epicenter is indicated by the purple shaded area. (B) Example images of NeuN (red), TUNEL (green), and DAPI (blue) triple-positive cells from SCI untreated and light-treated groups ipsilateral to the injury at dorsal region at 1 dpi. (C,D) Quantification of NeuN+TUNEL+DAPI+ cells, expressed as triple-positive cell density within the region of interest, in the dorsal region of the spinal cord, contralateral (C) and ipsilateral (D) to the injury of untreated and light-treated groups. (E,F) NeuN+TUNEL+DAPI+ cell density in the intermediate regions of interest contralateral (E) and ipsilateral (F) to the injury. (G,H) NeuN+TUNEL+DAPI+ cell density in the ventral regions of interest contralateral (G) and ipsilateral (H) to the injury. Data are expressed as mean ± SEM; n values indicated (legend) are for each time-point. Statistical comparisons between SCI and SCI+670 (LMER) are shown; *p < 0.05, **p < 0.01. dpi, days post-injury; LMER, linear mixed-effects models; SCI, spinal-cord injured animals without red-light treatment; SCI+670, spinal-cord injured animals with red-light treatment; SEM, standard error of the mean. Color image is available online.
FIG. 6.
FIG. 6.
Spinal-cord injury induced astrocyte activation is reduced following red-light treatment. (A) The schematic representation of the spinal cord illustrates the dorsal, lateral, and ventral regions of interest for analysis (enclosed by dashed lines, area of each box: 0.1 mm2). Approximate location of injury is indicated by the purple shaded area. (B) Example images are shown of positive GFAP labeling (green) from untreated and light-treated groups ipsilateral to the injury at the dorsal region at 3 dpi. (C,D) Quantification of GFAP+ labeling, expressed as the percentage area of positive label above threshold within the dorsal regions of interest contralateral (C) and ipsilateral (D) to the injury of untreated and light-treated groups. (E,F) GFAP+ label in the lateral regions of interest contralateral (E) and ipsilateral (F) to the injury. (G,H) GFAP+ label in the ventral regions of interest contralateral (G) and ipsilateral (H) to the injury. For each time-point n values are indicated (legend). Statistical comparisons between SCI and SCI+670 groups across all time-points and regions (black bracket) and across the time-points at different region (black line) are indicated. Dotted line indicates significance across both sides. Data are expressed as mean ± SEM; *p < 0.05, **p < 0.01 (LMER). GFAP, glial fibrillary acidic protein; LMER, linear mixed-effects models; SCI, spinal-cord injured animals without red-light treatment; SCI+670, spinal-cord injured animals with red-light treatment; SEM, standard error of the mean. Color image is available online.
FIG. 7.
FIG. 7.
The density of IL-1β producing astrocytes is not affected by red-light treatment following mild T10 hemi-contusion. (A) The schematic representation of the spinal cord illustrates the dorsal, lateral, and ventral regions of interest for analysis (enclosed by dashed lines, area of each box: 0.1 mm2). Approximate location of injury is indicated by the purple shaded area. (B) Example images of IL-1β (red), GFAP (green), and DAPI (blue) triple-positive cells from spinal-cord injured untreated and light-treated groups ipsilateral to the injury at dorsal region at 7 dpi. (C,D) Quantification of IL-1β+GFAP+DAPI+ cells, expressed as triple-positive cell density within the region of interest, in the dorsal region of the spinal cord, contralateral (C) and ipsilateral (D) to the spinal cord injury of untreated and light-treated groups. (E,F) IL-1β+GFAP+DAPI+ cell density in the lateral regions of interest contralateral (E) and ipsilateral (F) to the injury. (G,H) IL-1β+GFAP+DAPI+ cell density in the ventral regions of interest contralateral (G) and ipsilateral (H) to the injury. For each time-point n values are indicated (legend). Arrows indicate the 5-dpi time-point is significantly increased in the dorsal region compared with lateral and ventral regions (p = 0.0003, LMER, Tukey). Data are expressed as mean ± SEM. dpi, day post-injury; GFAP, glial fibrillary acidic protein; IL-1β, interleukin 1 beta; LMER, linear mixed-effects models; SCI, spinal-cord injured animals without red-light treatment; SCI+670, spinal-cord injured animals with red-light treatment; SEM, standard error of the mean. Color image is available online.
FIG. 8.
FIG. 8.
IL-1β producing microglia/macrophage population is not affected by red-light treatment following T10 hemi-contusion. (A) The schematic representation of the spinal cord illustrates the dorsal, lateral, and ventral regions of interest for analysis (enclosed by dashed lines, area of each box: 0.1 mm2). Approximate location of injury is indicated by the purple shaded area. (B) Example images shown of IL-1β (red), IBA1 (green), and DAPI (blue) triple-positive cells from spinal-cord injured untreated and light-treated groups at the dorsal level, ipsilateral to the injury at 7 dpi. (C,D) Quantification of IL-1β+IBA1+DAPI+ cells, expressed as triple-positive cell density within the region of interest, are shown for the dorsal region of the spinal cord, contralateral (C) and ipsilateral (D) to the injury of untreated and light-treated groups. (E,F) IL-1β+IBA1+DAPI+ cell density in the lateral regions of interest contralateral (E) and ipsilateral (F) to the injury. (G,H) IL-1β+IBA1+DAPI+ cell density in the ventral regions of interest contralateral (G) and ipsilateral (H) to the injury. For each time-point n values are indicated (legend) . Data are expressed as mean ± SEM. dpi, day post-injury; IL-1β, interleukin 1 beta; SCI, spinal-cord injured animals without red-light treatment; SCI+670, spinal-cord injured animals with red-light treatment; SEM, standard error of the mean. Color image is available online.
FIG. 9.
FIG. 9.
iNOS expressing microglia/macrophage immunoreactivity is reduced by red-light treatment following T10 hemi-contusion. (A) The schematic representation of the spinal cord illustrates the dorsal, lateral, and ventral regions of interest for analysis (enclosed by dashed lines, area of each box: 0.1 mm2). Approximate location of injury is indicated by the purple shaded area. (B) Example images are shown of uNOS (red), IBA1 (green), and DAPI (blue) triple-positive cells from spinal-cord injured untreated and light-treated animals at the dorsal region, ipsilateral to the injury at 7 dpi. (C,D) Quantification of uNOS+IBA1+DAPI+ cells, expressed as triple-positive cell density within the dorsal region of interest, is shown contralateral (C) and ipsilateral (D) to the injury of untreated and light-treated groups. (E,F) uNOS+IBA1+DAPI+ cell density in the lateral regions of interest contralateral (E) and ipsilateral (F) to the injury. (G,H) uNOS+IBA1+DAPI+ cell density in the ventral regions of interest contralateral (G) and ipsilateral (H) to the injury. For each time-point n values are indicated (legend). Data are expressed as mean ± SEM; *p < 0.05, **p < 0.01, LMER. dpi, day post-injury; IL-1β, interleukin 1 beta; iNOS, inducible nitric oxide synthase; LMER, linear mixed-effects models; SCI, spinal-cord injured animals without red-light treatment; SCI+670, spinal-cord injured animals with red-light treatment; SEM, standard error of the mean. Color image is available online.

Similar articles

Cited by

References

    1. World Health Organization and International Spinal Cord Society. (2013). International perspectives on spinal cord injury. World Health Organization: Geneva, Switzerland.. https://apps.who.int/iris/bitstream/handle/10665/94190/9789241564663_eng...
    1. Singh A., Tetreault L., Kalsi-Ryan S., Nouri A., and Fehlings M.G. (2014). Global prevalence and incidence of traumatic spinal cord injury. Clin. Epidemiol. 6, 309–331 - PMC - PubMed
    1. Turner J.A., Cardenas D.D., Warms C.A., and McClellan C.B. (2001). Chronic pain associated with spinal cord injuries: a community survey. Arch. Phys. Med. Rehabil. 82, 501–509 - PubMed
    1. Pascoal-Faria P., Yalcin N., and Fregni F. (2015). Neural markers of neuropathic pain associated with maladaptive plasticity in spinal cord injury. Pain Pract. 15, 371–377 - PubMed
    1. Finnerup N.B., Norrbrink C., Trok K., Piehl F., Johannesen I.L., Sorensen J.C., Jensen T.S., and Werhagen L. (2014). Phenotypes and predictors of pain following traumatic spinal cord injury: a prospective study. J. Pain 15, 40–48 - PubMed

Publication types