. 2020 Aug 28;127(6):727-743.
doi: 10.1161/CIRCRESAHA.119.316500. Epub 2020 Jun 17.

Somatic Gain of KRAS Function in the Endothelium Is Sufficient to Cause Vascular Malformations That Require MEK but Not PI3K Signaling

Affiliations

Somatic Gain of KRAS Function in the Endothelium Is Sufficient to Cause Vascular Malformations That Require MEK but Not PI3K Signaling

Jason E Fish et al. Circ Res. .

Abstract

Rationale: We previously identified somatic activating mutations in the KRAS (Kirsten rat sarcoma viral oncogene homologue) gene in the endothelium of the majority of human sporadic brain arteriovenous malformations; a disorder characterized by direct connections between arteries and veins. However, whether this genetic abnormality alone is sufficient for lesion formation, as well as how active KRAS signaling contributes to arteriovenous malformations, remains unknown.

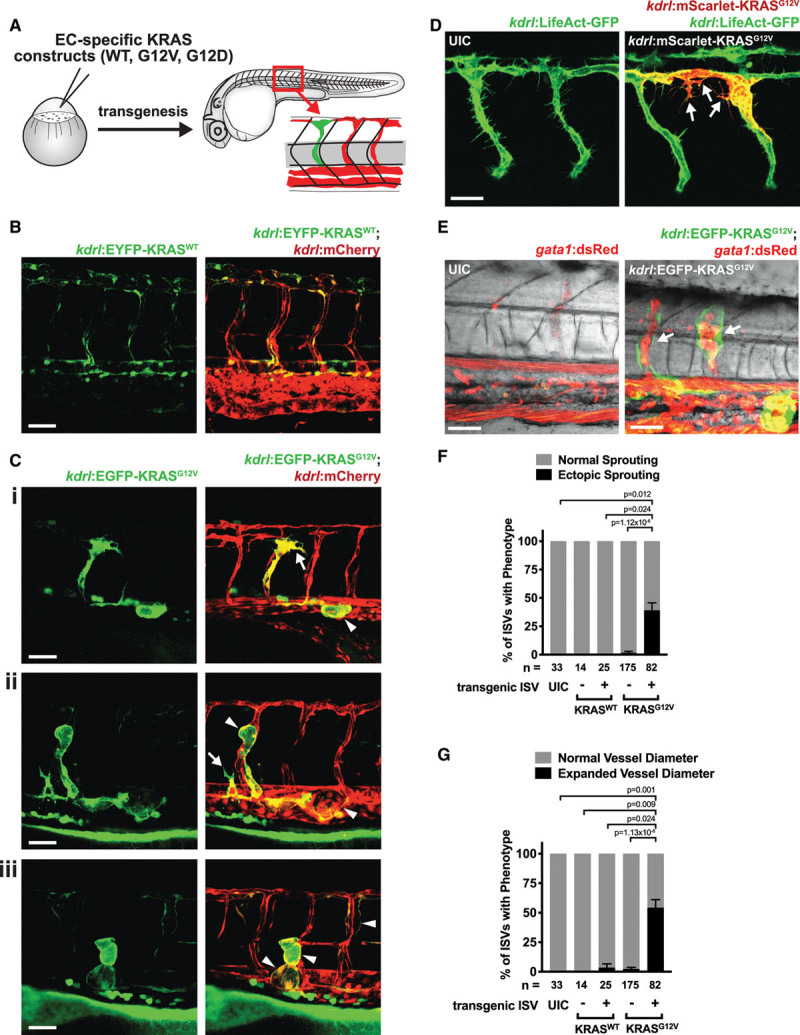
Objective: To establish the first in vivo models of somatic KRAS gain of function in the endothelium in both mice and zebrafish to directly observe the phenotypic consequences of constitutive KRAS activity at a cellular level in vivo, and to test potential therapeutic interventions for arteriovenous malformations.

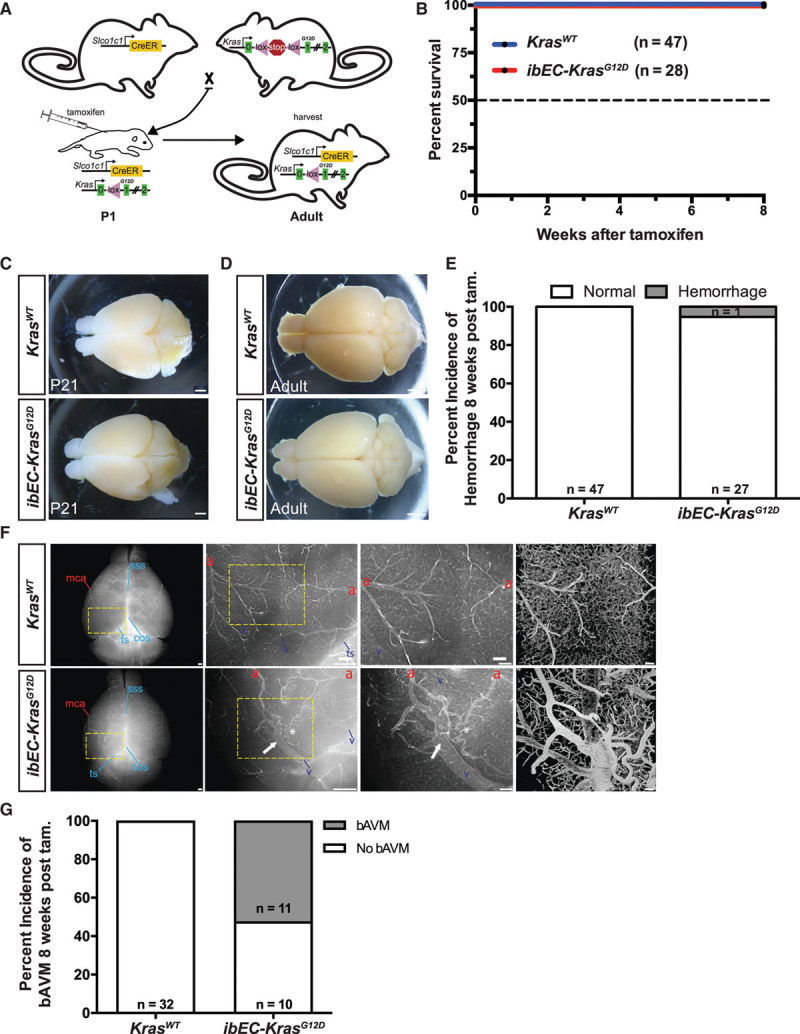
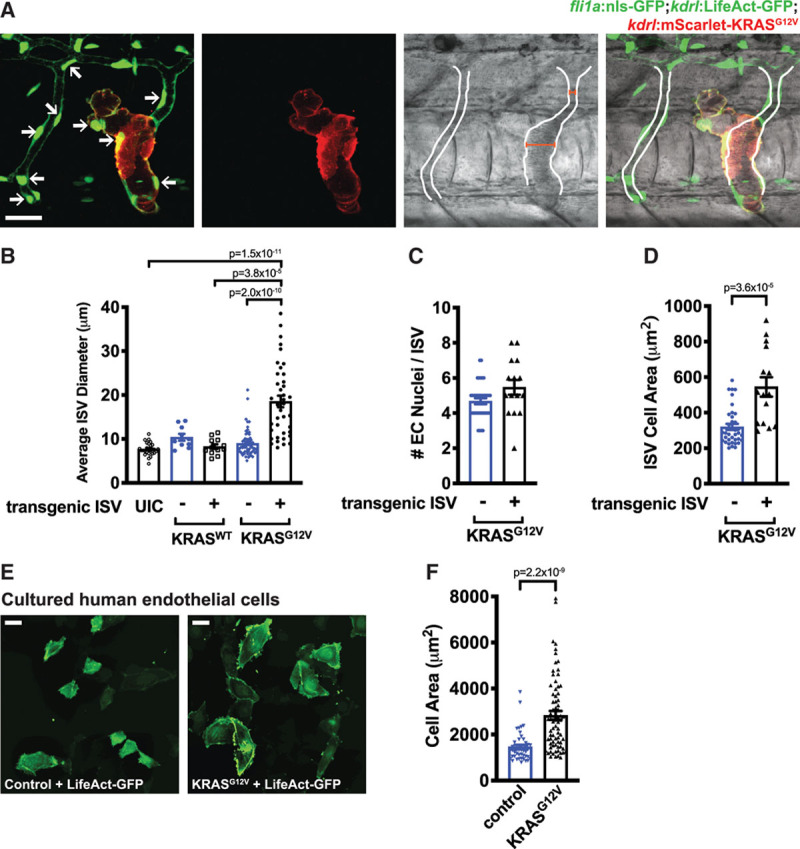
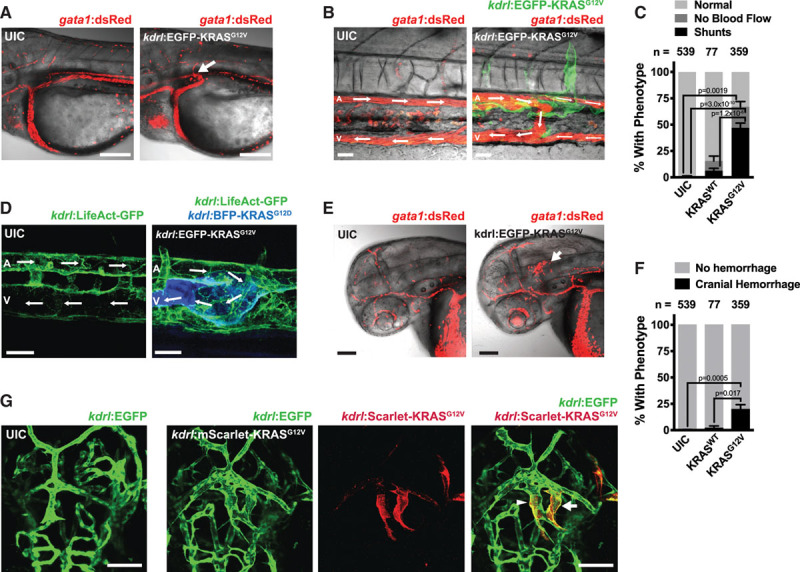
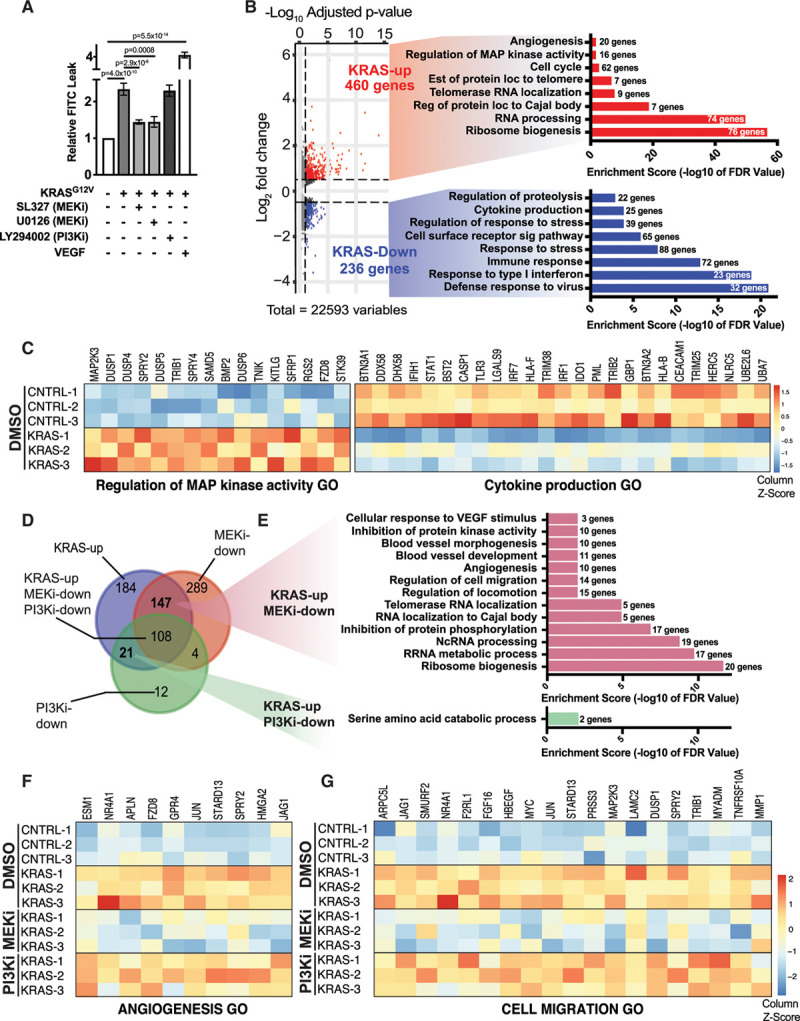
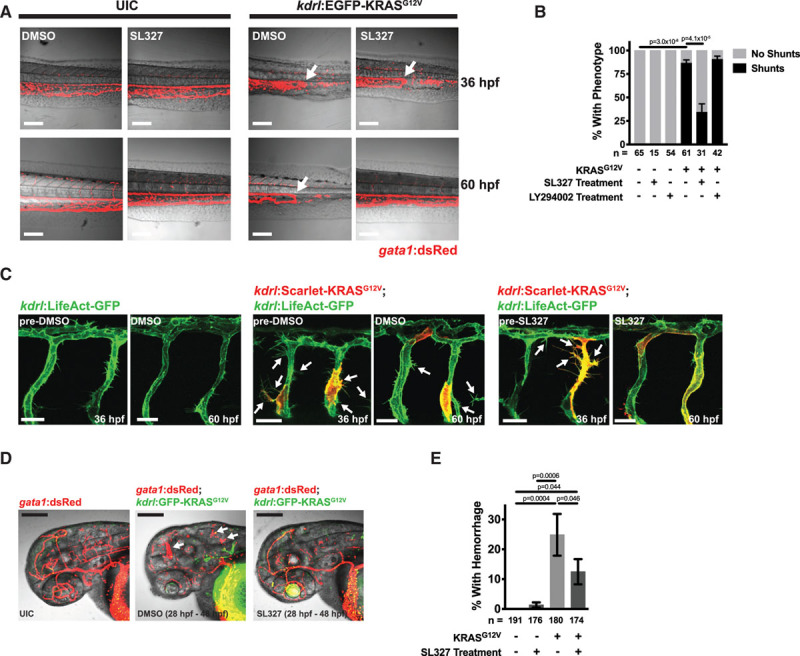
Methods and results: Using both postnatal and adult mice, as well as embryonic zebrafish, we demonstrate that endothelial-specific gain of function mutations in Kras (G12D or G12V) are sufficient to induce brain arteriovenous malformations. Active KRAS signaling leads to altered endothelial cell morphogenesis and increased cell size, ectopic sprouting, expanded vessel lumen diameter, and direct connections between arteries and veins. Furthermore, we show that these lesions are not associated with altered endothelial growth dynamics or a lack of proper arteriovenous identity but instead seem to feature exuberant angiogenic signaling. Finally, we demonstrate that KRAS-dependent arteriovenous malformations in zebrafish are refractory to inhibition of the downstream effector PI3K but instead require active MEK (mitogen-activated protein kinase kinase 1) signaling.

Conclusions: We demonstrate that active KRAS expression in the endothelium is sufficient for brain arteriovenous malformations, even in the setting of uninjured adult vasculature. Furthermore, the finding that KRAS-dependent lesions are reversible in zebrafish suggests that MEK inhibition may represent a promising therapeutic treatment for arteriovenous malformation patients. Graphical Abstract: A graphical abstract is available for this article.

Keywords: brain; cell size; endothelium, vascular; models, animal; vascular disease.


Conflict of interest statement

None.

Figures

Figure 1.
Figure 1.
Postnatal expression of active KRAS (Kirsten rat sarcoma viral oncogene homologue) in the murine central nervous system endothelium bypasses early lethality and produces brain arteriovenous malformations. A, Breeding scheme for generating inducible brain endothelial cell KRAS mutant mice (ibEC-KrasG12D). Tamoxifen is delivered to pups at P1 and tissues are harvested at 8 wk of age. B, No survival defects were observed in ibEC-KrasG12D mice or control KrasWT littermates. C, Representative phase microscopy images of the dorsal surface of the brain at P21 show no cerebral hemorrhages in either ibEC-KrasG12D mice (n=0/7) or control littermates (n=0/14; quantification not shown). Scale bar=500 µm. D, Representative phase microscopy images of the dorsal surface of the brain at 8 wks. Scale bar=500 µm. E, Quantification of the incidence of hemorrhage at 8 wk of age in both control (n=0/35) and ibEC-KrasG12D mice (n=1/19). Fisher exact test; P=0.373. F, Representative dorsal surface view, olfactory bulb at the top and cerebellum at the bottom, via direct fluorescence microscopy of an 8-week-old adult mouse brain following perfusion with fluorescent lectin. Arteriovenous shunts, or fusions, between cerebral arteries (red letter a) and veins (blue letter v), as well as venous dilation (white arrow) and tortuosity (asterisk) are evident in ibEC-KrasG12D animals but not the control littermates at 8 wk of age. Magnified areas (yellow boxes) are shown in the panels to the right. Far right panels are flattened reconstructions of volume rendered images of the cortical vasculature following CLARITY clearing and lightsheet confocal microscopy. Scale bar=500 µm for first 2 (left to right) upper and lower panels for wild-type and mutant brain images (with yellow dashed boxes), and = 100 µm for upper and lower far right magnified images. G, Quantification of the incidence of brain arteriovenous malformation (bAVM) at 8 wk of age. Fisher exact test; P=4.6×10⁻⁶. COS indicates confluence of sinus veins; MCA, middle cerebral artery; SSS, superior sagittal sinus vein; and TS, transverse sinus vein.
Figure 2.
Figure 2.
Pan-endothelial expression of active KRAS (Kirsten rat sarcoma viral oncogene homologue) in adult mice induces brain arteriovenous malformations. A, Representative model for induction of pan-endothelial mutant KRAS activity in adult mice. B, No survival defects were observed in KRAS mutant mice or control animals up to 8 and 36 wk following induction. C, No evidence of hemorrhage was detected at 8 wk post-treatment in adult KRAS mutant or control animal brains. Representative phase microscopy images of the dorsal and ventral surfaces of the brain are shown. Scale bar=500 µm. D, Quantification of the incidence of cranial hemorrhage 8 wk after initiating tamoxifen treatment at 2 to 4 mo of age. E, Representative whole mount epifluorescent views following perfusion of fluorescent-conjugated tomato lectin reveal the presence of brain arteriovenous malformations (bAVMs; white arrow) just distal to the olfactory bulb (i) and in the cortex just proximal to the cerebellum (Eii and Eiii). a=artery, v=vein. Scale bar=500 µm for far-left panels, and Ei and Eii, and scale bar=100 µm for Eiii. F, Quantification of bAVM incidence 8 wk post tamoxifen induction. Fisher exact test; P=0.002. G, Quantification of the incidence of bAVM at 36 wk post–tamoxifen induction. The sample size was too small for statistical analysis.
Figure 3.
Figure 3.
Expression of active KRAS (Kirsten rat sarcoma viral oncogene homologue) in the endothelium of embryonic zebrafish alters cellular morphology. A, Schematic of mosaic analysis of KRAS expression in the endothelium. Wild-type KRAS (KRASWT) or mutant KRAS (KRASG12V or KRASG12D) were expressed under the control of an endothelial-specific promoter, kdrl. B, Representative image of a Tg(kdrl:mCherry) embryo injected with a kdrl:EYFP-KRASWT construct. No changes in cellular phenotype were noted. 52 h post-fertilization (hpf). C, Representative images of Tg(kdrl:mCherry) embryos injected with a kdrl:EGFP-KRASG12V construct. Arrows indicate ectopic sprouting, while arrowheads indicate vessels with enlarged vessel diameter. Ci; 48 hpf, Cii and Ciii; 52 hpf. D, Representative images of Tg(kdrl:LifeAct-GFP) embryos injected with a kdrl:EGFP-KRASG12V construct or an uninjected control (UIC). Arrows indicate ectopic sprouts. 36 hpf. E, Representative image of a Tg(gata1:dsRed) embryo injected with a kdrl:EGFP-KRASG12V construct or an UIC. Arrows indicate expanded, blood-filled lumens in intersomitic vessels (ISVs) expressing KRASG12V. 64 hpf. Quantification of ectopic sprouting (F) or expanded vessel diameter (G) phenotypes in ISVs containing cells expressing the kdrl:KRASWT or kdrl:KRASG12V transgene (+) or in transgene-negative (−) ISVs or in ISVs in UIC embryos at 48 hpf. Shown is the mean±SEM of the percentage of embryos with the indicated phenotype across multiple experiments. The total number of ISVs assessed is shown below. Kruskal-Wallis test with Dunn multiple comparisons test. Scale bar=50 μm for B, C; 30 μm for D, E.
Figure 4.
Figure 4.
Active KRAS (Kirsten rat sarcoma viral oncogene homologue) expression increases the size of endothelial cells and expands vessel diameter. A, Representative composite brightfield/fluorescent images of a Tg (fli1:nls-GFP; kdrl:LifeActGFP) embryo injected with kdrl:Scarlet-KRASG12V showing altered vessel morphology and expanded lumen (outlined from brightfield image of blood flow). Endothelial cell (EC) nuclei are indicated by arrows. Widths of intersomitic vessels (ISVs) with nontransgenic and KRASG12V-positive cells are indicated with red bars. 48 hpf. Scale bar=20 µm. B, Quantification of average diameter of ISVs containing cells expressing the kdrl:KRASWT or kdrl:KRASG12V transgene (+) or in transgene-negative (−) ISVs or in ISVs in uninjected control (UIC) embryos. Kruskal-Wallis test with Dunn multiple comparisons test. C, Quantification of the number of EC nuclei in ISVs in Tg(fli1a:nls-GFP) embryos containing cells expressing the kdrl:KRASG12V transgene (+) or in transgene-negative (−) ISVs. Unpaired Mann-Whitney U test; P=0.055. D, Quantification of ISV cell area (ie, total ISV area divided by the number of fli1a:nls-GFP nuclei) in ISVs containing cells expressing the kdrl:KRASG12V transgene (+) or in transgene-negative (−) ISVs. Unpaired Mann-Whitney U test. Representative images (E) and quantification (F) of human umbilical vein endothelial cells electroporated with control or KRASG12V constructs, together with a LifeAct-GFP construct. Scale bar=40 µm. Unpaired Mann-Whitney U test.
Figure 5.
Figure 5.
Active KRAS (Kirsten rat sarcoma viral oncogene homologue) expression in the endothelium drives the formation of arteriovenous shunts and cranial hemorrhage. A, Representative image of an arteriovenous (AV) shunt (indicated by arrow) between the dorsal aorta (DA) and the cardinal vein (CV) in a Tg(gata1:dsRed) zebrafish embryo injected with kdrl:EGFP-KRASG12V, but not in uninjected controls (UIC). Scale bar=100 μm. 60 hpf. B, Representative image of an AV shunt between the DA (A) and posterior CV (V) in the trunk of a Tg(gata1:dsRed) embryo injected with kdrl:EGFP-KRASG12V, but not in UIC. Blood flow is indicated by arrows. Note that EGFP-KRASG12V-expressing cells are present at the location of the shunt. Scale bar=30 μm. 64 hpf. C, Quantification of AV shunts and no blood flow phenotypes in the trunk of embryos injected with kdrl:EYFP-KRASWT, kdrl:EGFP-KRASG12V or UIC, as assessed under bright field imaging at 48 hpf. Data are mean±SEM of the percentages of phenotypes from multiple independent experiments. The total number of embryos analyzed are indicated above. One-way ANOVA with Tukey’s multiple comparisons test. D, Representative images of Tg(kdrl:LifeAct-GFP) embryos injected with a kdrl:BFP-KRASG12D construct or UIC demonstrating an AV shunt and altered actin polymerization. Scale bar=20 μm. 72 hpf. E, Representative image of a cranial hemorrhage in a Tg(gata1:dsRed) embryo injected with kdrl:EGFP-KRASG12V but not in UIC. Scale bar=90 μm. 48 hpf. F, Quantification of cranial hemorrhages in embryos injected with kdrl:EYFP-KRASWT, kdrl:EGFP-KRASG12V or UIC, as assessed under bright field at 48 hpf. Data are mean±SEM of the percentages of phenotypes from multiple independent experiments. The total number of embryos analyzed are indicated above. One-way ANOVA with Tukey’s multiple comparisons test. G, Representative images of cranial blood vessels in Tg(kdrl:EGFP) embryos injected with kdrl:mScarlet-KRASG12V and in UIC. The arrow indicates an abnormal vascular connection with large lumen and the arrowhead indicates a vessel with an expanded lumen. Scale bar=50 μm. 54 hpf.
Figure 6.
Figure 6.
KRASG12V (Kirsten rat sarcoma viral oncogene homologue)-signaling disrupts endothelial cell (EC) barrier and alters gene regulatory networks in a MEK (mitogen-activated protein kinase kinase 1)-dependent manner. A, EC barrier was assessed using a transwell leak assay with a FITC-Dextran tracer in HUVECs expressing KRASG12V±MEK inhibition (MEKi) with SL327 or U0126 or PI3K inhibition (PI3Ki) with LY294002 or control cells (ie, empty vector). VEGF treatment was included as a positive control for EC permeability. n=9 for control, KRASG12V and KRASG12V+SL327; n=3 for KRASG12V+U0126 and KRASG12V+LY294002; n=6 for VEGF. One-way ANOVA with Tukey’s multiple comparisons test. For simplicity, not all significant comparisons are indicated. PI3Ki was not able to rescue KRAS-dependent leak; P=0.9999. B, Volcano-plot of differentially expressed genes in HUVECs expressing KRASG12V compared with empty vector control. Associated select GO terms (with enrichment score below and number of genes to the right) for genes up-regulated by KRASG12V are shown in red, while those downregulated are shown in blue. C, Heat maps of differentially expressed transcripts detected by RNA-seq in 2 representative GO categories are shown (n=3 biological replicates). D, A Venn diagram shows the overlap between genes that are differentially up-regulated in HUVECs expressing KRASG12V compared with empty vector control following treatment with vehicle (DMSO), PI3Ki (LY294002), or MEKi (U01236). A small subset of KRASG12V upregulated targets (460 total genes) are uniquely affected by PI3Ki (21 genes), although MEKi affects a larger cohort of these KRAS-induced transcripts (147 genes). Significant genes in the Venn diagram were included if they displayed a Benjamini–Hochberg adjusted P-value of <0.1 and a log2 (fold change) >0.5. E, Associated select GO terms of MEKi- and PI3Ki-sensitive genes. F and G, Heat maps of differentially expressed transcripts detected by RNA-seq in 2 representative GO categories. KRASG12V-induced transcripts in these GO categories are not downregulated following PI3Ki but are decreased following MEKi. See Online Table II for gene list of KRAS-induced, MEK-dependent and PI3K-dependent transcripts, along with a full list of linked Gene Ontology categories.
Figure 7.
Figure 7.
MEK (mitogen-activated protein kinase kinase 1) inhibition can rescue phenotypes caused by active KRAS (Kirsten rat sarcoma viral oncogene homologue) signaling in endothelial cells. A, Representative images of Tg(gata1:dsRed) embryos, that were either uninjected (ie, UIC) or were injected with kdrl:EGFP-KRASG12V. Embryos were imaged at 36 hpf to identify embryos with AV shunts, at which point these embryos were exposed to either DMSO or 1 μM of the MEK inhibitor, SL327. The same embryos were imaged at 60 hpf. Scale bar=40 μm. B, Quantification of phenotypes after 24 h of SL327 (1 μM), LY294002 (PI3K inhibitor, 10 μM), or vehicle (ie, DMSO) treatment. All KRASG12V embryos had shunts at the beginning of treatment. Data are mean±SEM of the percentages of phenotypes from 5 (SL327) or 4 (LY294002) independent experiments. The SL327 and LY294002 treatments were performed in different experiments and data are combined in one graph for visualization purposes, but analysis was done separately. The total number of embryos analyzed are indicated below. One-way ANOVA with Tukey’s multiple comparison test. For simplicity, not all significant comparisons are indicated. PI3K was not able to rescue established shunts; P=0.816. See Online Figure X for more data on LY294002 treatment. C, Representative images of Tg(kdrl:LifeAct-GFP) embryos injected with kdrl:mScarlet-KRASG12V or UIC. Images were taken at 36 hpf and embryos were treated with 1 μM SL327 or DMSO control and imaging was then repeated on the same embryos at 60 hpf. kdrl:mScarlet-KRASG12V-injected embryos had ectopic sprouts (indicated by arrows) and these continued to be present at 60 hpf in embryos exposed to DMSO, but this phenotype was normalized by treatment with SL327. Scale bar=20 μm. D, Hemorrhage phenotype in Tg(gata1:dsRed) embryos treated with DMSO or 1 μM SL327 from 28 to 48 hpf. Hemorrhages are indicated by arrows. Scale bar=200 μm. E, Quantification of the percentage of embryos with cranial hemorrhage (mean±SEM) from 6 independent experiments. The total number of embryos analyzed are indicated below. Statistical significance was determined by one-way ANOVA with Tukey multiple comparison test.

Comment in

Similar articles

Cited by

References

    1. Solomon RA, Connolly ES., Jr. Arteriovenous malformations of the brain. N Engl J Med 20173761859–1866doi: 10.1056/NEJMra1607407 - PubMed
    1. Yun JH, Kwon DH, Lee EJ, Lee DH, Ahn JS, Kwun BD. New nidus formation adjacent to the target site of an arteriovenous malformation treated by Gamma Knife surgery. J Neurosurg 2012117suppl120–125doi: 10.3171/2012.8.GKS12994 - PubMed
    1. Nikolaev SI, Vetiska S, Bonilla X, Boudreau E, Jauhiainen S, Rezai Jahromi B, Khyzha N, DiStefano PV, Suutarinen S, Kiehl TR, et al. Somatic activating KRAS mutations in arteriovenous malformations of the brain. N Engl J Med 2018378250–261doi: 10.1056/NEJMoa1709449 - PMC - PubMed
    1. Oka M, Kushamae M, Aoki T, Yamaguchi T, Kitazato K, Abekura Y, Kawamata T, Mizutani T, Miyamoto S, Takagi Y. KRAS G12D or G12V mutation in human brain arteriovenous malformations. World Neurosurg 2019126e1365–e1373doi: 10.1016/j.wneu.2019.03.105 - PubMed
    1. Priemer DS, Vortmeyer AO, Zhang S, Chang HY, Curless KL, Cheng L. Activating KRAS mutations in arteriovenous malformations of the brain: frequency and clinicopathologic correlation. Hum Pathol 20198933–39doi: 10.1016/j.humpath.2019.04.004 - PubMed

Publication types

MeSH terms