

To screen or not to screen: an interactive framework for comparing costs of mass malaria treatment interventions
- PMID: 32552743
- PMCID: PMC7304173
- DOI: 10.1186/s12916-020-01609-7
To screen or not to screen: an interactive framework for comparing costs of mass malaria treatment interventions
Abstract
Background: Mass drug administration and mass-screen-and-treat interventions have been used to interrupt malaria transmission and reduce burden in sub-Saharan Africa. Determining which strategy will reduce costs is an important challenge for implementers; however, model-based simulations and field studies have yet to develop consensus guidelines. Moreover, there is often no way for decision-makers to directly interact with these data and/or models, incorporate local knowledge and expertise, and re-fit parameters to guide their specific goals.
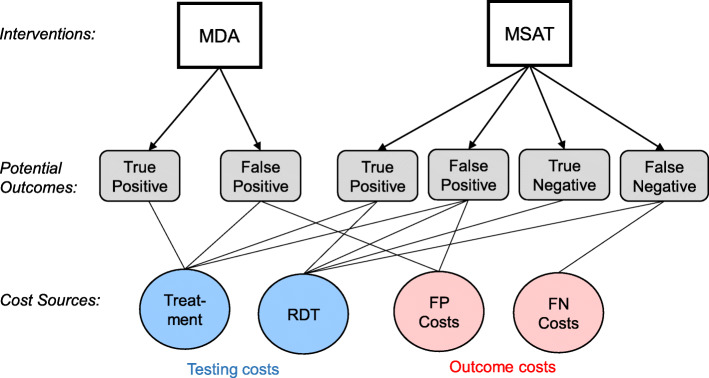
Methods: We propose a general framework for comparing costs associated with mass drug administrations and mass screen and treat based on the possible outcomes of each intervention and the costs associated with each outcome. We then used publicly available data from six countries in western Africa to develop spatial-explicit probabilistic models to estimate intervention costs based on baseline malaria prevalence, diagnostic performance, and sociodemographic factors (age and urbanicity). In addition to comparing specific scenarios, we also develop interactive web applications which allow managers to select data sources and model parameters, and directly input their own cost values.
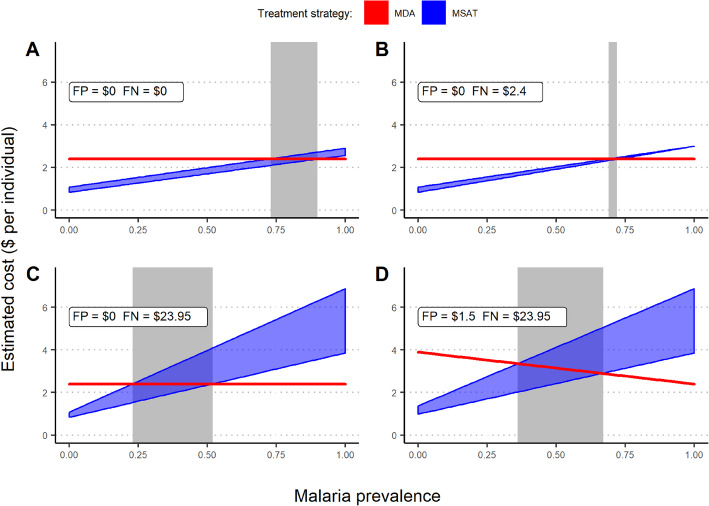
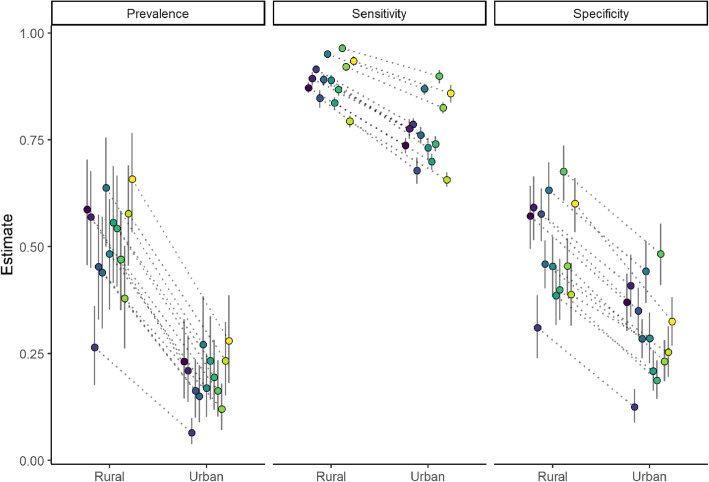
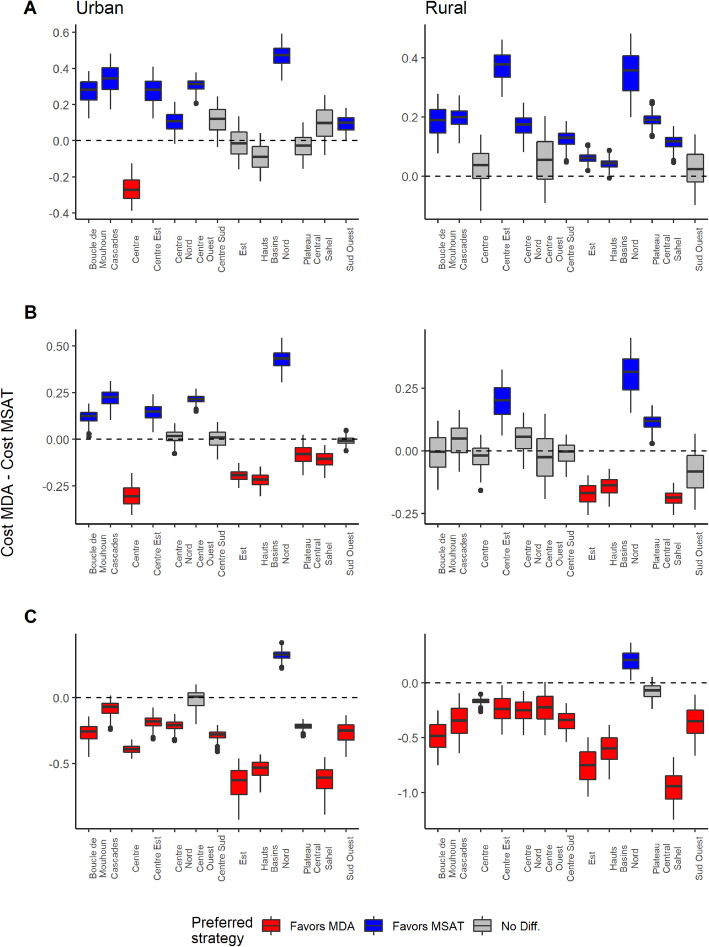
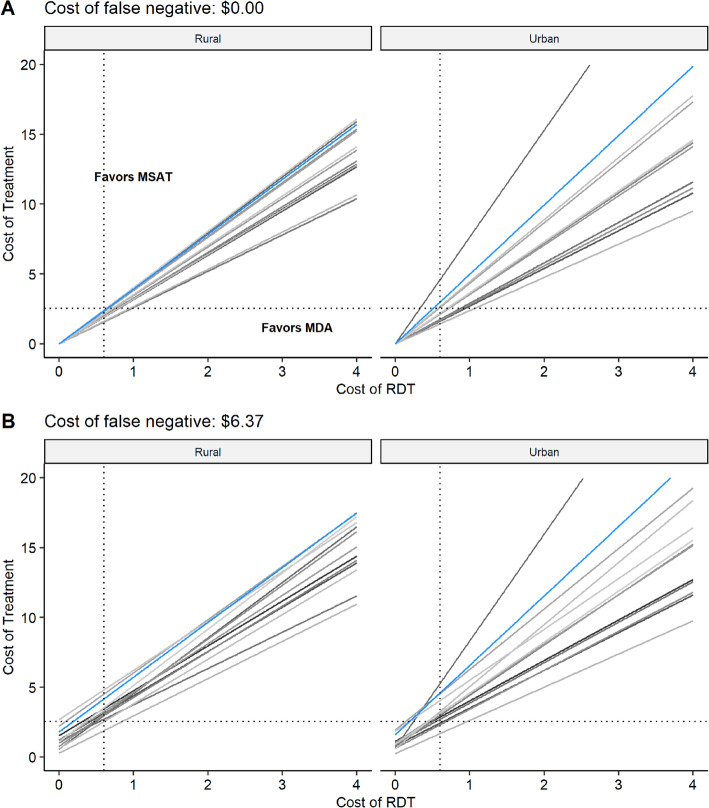
Results: The regional-level models revealed substantial spatial heterogeneity in malaria prevalence and diagnostic test sensitivity and specificity, indicating that a "one-size-fits-all" approach is unlikely to maximize resource allocation. For instance, urban communities in Burkina Faso typically had lower prevalence rates compared to rural communities (0.151 versus 0.383, respectively) as well as lower diagnostic sensitivity (0.699 versus 0.862, respectively); however, there was still substantial regional variation. Adjusting the cost associated with false negative diagnostic results to included additional costs, such as delayed treated and potential lost wages, undermined the overall costs associated with MSAT.
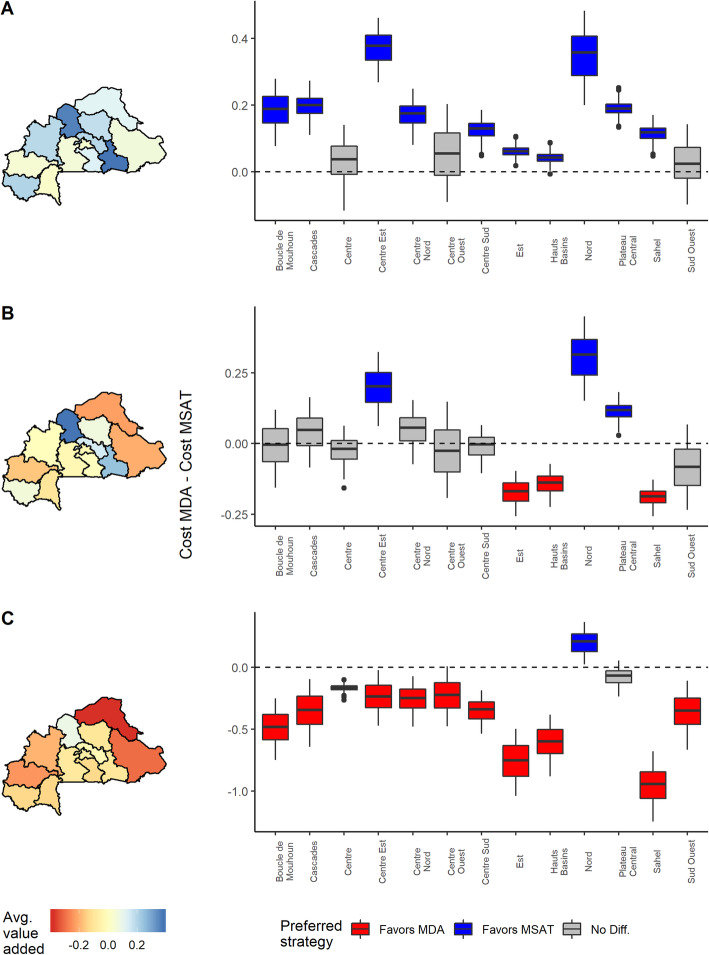
Conclusions: The observed spatial variability and dependence on specified cost values support not only the need for location-specific intervention approaches but also the need to move beyond standard modeling approaches and towards interactive tools which allow implementers to engage directly with data and models. We believe that the framework demonstrated in this article will help connect modeling efforts and stakeholders in order to promote data-driven decision-making for the effective management of malaria, as well as other diseases.
Keywords: Data-driven decision-making; Decision support; Malaria; Mass drug administration; Mass screen and treat; Resource allocation.
Conflict of interest statement
The authors declare that they have no competing interests.
Figures
Similar articles
-
An interactive model for the assessment of the economic costs and benefits of different rapid diagnostic tests for malaria.Malar J. 2008 Jan 28;7:21. doi: 10.1186/1475-2875-7-21. Malar J. 2008. PMID: 18226224 Free PMC article.
-
The future of Cochrane Neonatal.Early Hum Dev. 2020 Nov;150:105191. doi: 10.1016/j.earlhumdev.2020.105191. Epub 2020 Sep 12. Early Hum Dev. 2020. PMID: 33036834
-
Simulating the council-specific impact of anti-malaria interventions: A tool to support malaria strategic planning in Tanzania.PLoS One. 2020 Feb 19;15(2):e0228469. doi: 10.1371/journal.pone.0228469. eCollection 2020. PLoS One. 2020. PMID: 32074112 Free PMC article.
-
A Systematic Review of the Evidence on the Effectiveness and Cost-Effectiveness of Mass Screen-and-Treat Interventions for Malaria Control.Am J Trop Med Hyg. 2021 Sep 7;105(6):1722-1731. doi: 10.4269/ajtmh.21-0325. Am J Trop Med Hyg. 2021. PMID: 34491213 Free PMC article.
-
The evidence base on the cost-effectiveness of malaria control measures in Africa.Health Policy Plan. 1999 Dec;14(4):301-12. doi: 10.1093/heapol/14.4.301. Health Policy Plan. 1999. PMID: 10787646 Review.
Cited by
-
A systematic review and meta-analysis on sub-microscopic Plasmodium infections in India: Different perspectives and global challenges.Lancet Reg Health Southeast Asia. 2022 May 28;2:100012. doi: 10.1016/j.lansea.2022.05.001. eCollection 2022 Jul. Lancet Reg Health Southeast Asia. 2022. PMID: 37383294 Free PMC article.
-
Mass Testing and Treatment to Accelerate Malaria Elimination: A Systematic Review and Meta-Analysis.Am J Trop Med Hyg. 2024 Mar 12;110(4_Suppl):44-53. doi: 10.4269/ajtmh.23-0127. Print 2024 Apr 2. Am J Trop Med Hyg. 2024. PMID: 38471168 Free PMC article.
-
Guiding placement of health facilities using multiple malaria criteria and an interactive tool.Malar J. 2021 Dec 3;20(1):455. doi: 10.1186/s12936-021-03991-w. Malar J. 2021. PMID: 34861874 Free PMC article.
References
-
- Greenwood B. The use of anti-malarial drugs to prevent malaria in the population of malaria-endemic areas. Am J Trop Med Hyg. 2004;70(1):1–7. - PubMed
-
- Poirot E, Skarbinski J, Sinclair D, Kachur SP, Slutsker L, Hwang J. Mass drug administration for malaria. In: Cochrane Database of Systematic Reviews [Internet]: Wiley; 2013. Available from: http://onlinelibrary.wiley.com/doi/10.1002/14651858.CD008846.pub2/abstract. - DOI - PMC - PubMed
Publication types
MeSH terms
LinkOut - more resources
Full Text Sources
Medical
