. 2020 Jun 18;15(1):36.
doi: 10.1186/s13024-020-00388-2.

Identification of novel cerebrospinal fluid biomarker candidates for dementia with Lewy bodies: a proteomic approach

Affiliations

Identification of novel cerebrospinal fluid biomarker candidates for dementia with Lewy bodies: a proteomic approach

Inger van Steenoven et al. Mol Neurodegener. .

Abstract

Background: Diagnosis of dementia with Lewy bodies (DLB) is challenging, largely due to a lack of diagnostic tools. Cerebrospinal fluid (CSF) biomarkers have been proven useful in Alzheimer's disease (AD) diagnosis. Here, we aimed to identify novel CSF biomarkers for DLB using a high-throughput proteomic approach.

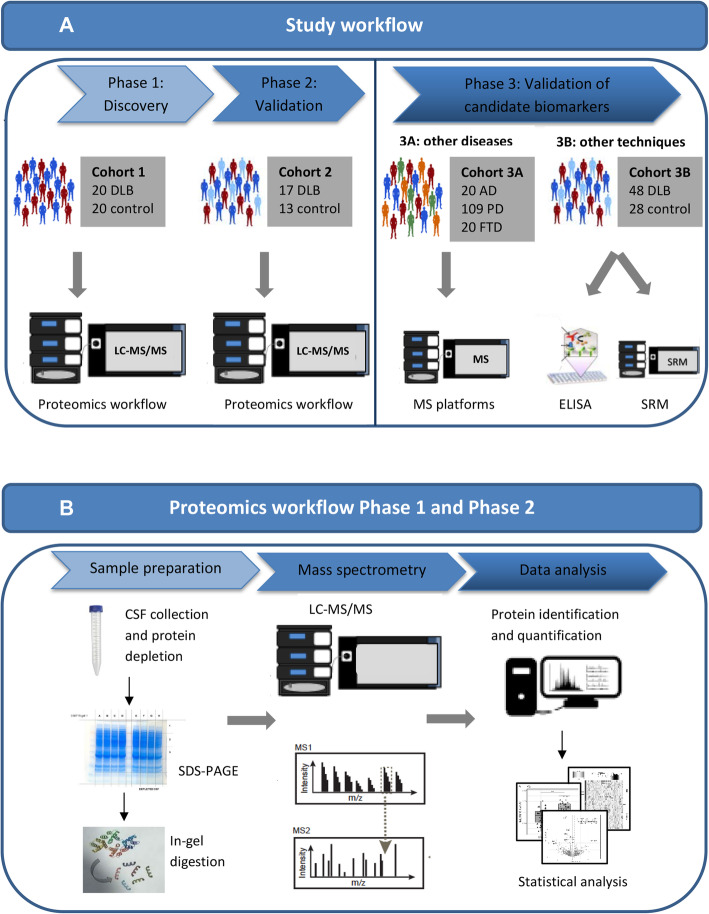
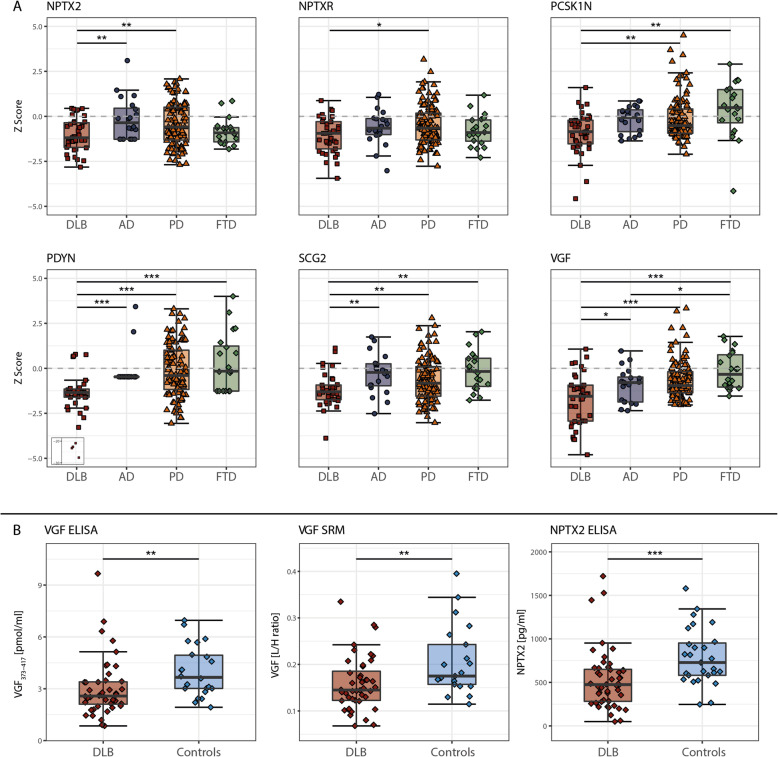
Methods: We applied liquid chromatography/tandem mass spectrometry with label-free quantification to identify biomarker candidates to individual CSF samples from a well-characterized cohort comprising patients with DLB (n = 20) and controls (n = 20). Validation was performed using (1) the identical proteomic workflow in an independent cohort (n = 30), (2) proteomic data from patients with related neurodegenerative diseases (n = 149) and (3) orthogonal techniques in an extended cohort consisting of DLB patients and controls (n = 76). Additionally, we utilized random forest analysis to identify the subset of candidate markers that best distinguished DLB from all other groups.

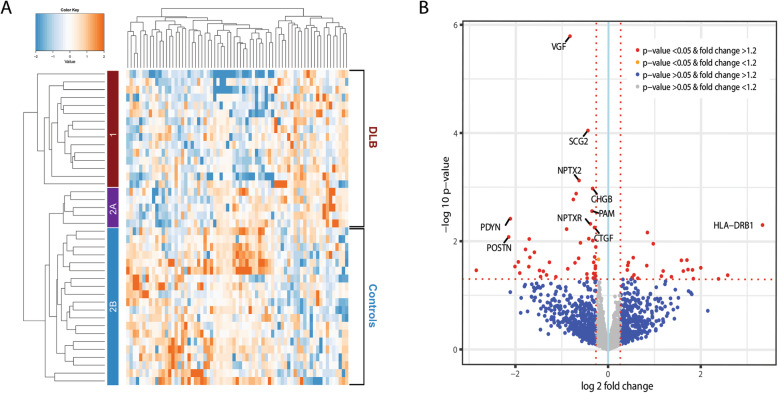
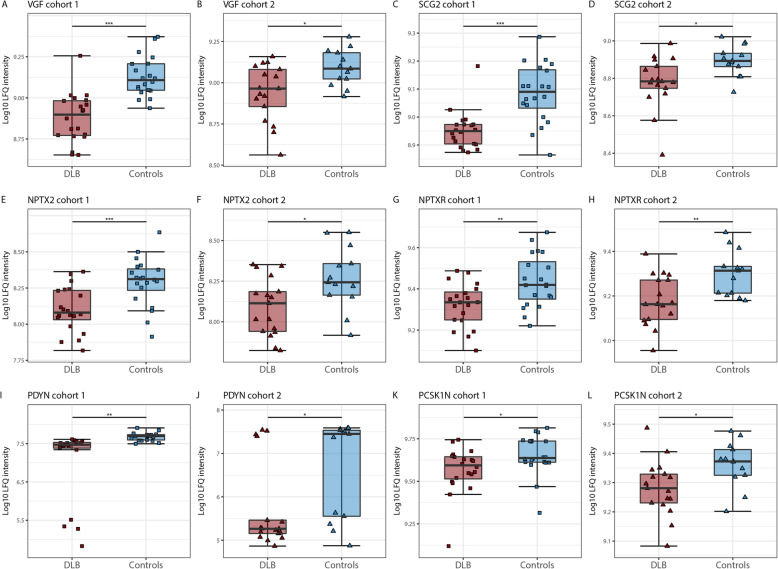
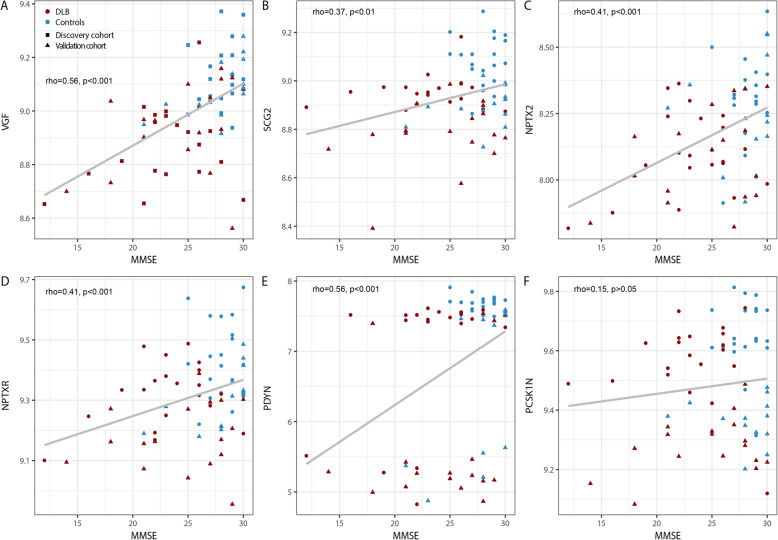
Results: In total, we identified 1995 proteins. In the discovery cohort, 69 proteins were differentially expressed in DLB compared to controls (p < 0.05). Independent cohort replication confirmed VGF, SCG2, NPTX2, NPTXR, PDYN and PCSK1N as candidate biomarkers for DLB. The downregulation of the candidate biomarkers was somewhat more pronounced in DLB in comparison with related neurodegenerative diseases. Using random forest analysis, we identified a panel of VGF, SCG2 and PDYN to best differentiate between DLB and other clinical groups (accuracy: 0.82 (95%CI: 0.75-0.89)). Moreover, we confirmed the decrease of VGF and NPTX2 in DLB by ELISA and SRM methods. Low CSF levels of all biomarker candidates, except PCSK1N, were associated with more pronounced cognitive decline (0.37 < r < 0.56, all p < 0.01).

Conclusion: We identified and validated six novel CSF biomarkers for DLB. These biomarkers, particularly when used as a panel, show promise to improve diagnostic accuracy and strengthen the importance of synaptic dysfunction in the pathophysiology of DLB.

Keywords: Biomarkers; Cerebrospinal fluid; Dementia with Lewy bodies; Lewy body dementia; Proteomics.


Conflict of interest statement

Nothing to report.

Figures

Fig. 1
Fig. 1
Graphical summary of the workflow used to identify novel CSF biomarkers for DLB. a Graphical summary of study workflow. In short, CSF samples from cohort 1 were evaluated using a high-throughput proteomic workflow. The CSF proteome from DLB patients was compared with that of cognitively normal individuals. Validation was performed in an independent validation cohort (cohort 2) using an identical proteomic workflow. Proteins that were significantly altered in abundance in both cohort 1 and cohort 2 were indicated as candidate biomarkers. Levels of the identified candidate biomarkers in DLB patients were compared with the levels of the identified candidate biomarkers as quantified with mass spectrometry in related neurodegenerative diseases (cohort 3A). For a subset of the candidate biomarkers validation was performed using orthogonal methods (ELISA and SRM) in cohort 3B. b Graphical summary of the proteomic workflow. We applied an in-depth proteomic workflow, including abundant protein depletion, protein fractionation prior to nanoLC-MS/MS analysis and label-free protein quantification on CSF samples from DLB patients and controls in cohort 1 and 2
Fig. 2
Fig. 2
Results of discovery proteomics. a Heatmap and cluster analysis of differentially expressed proteins (n = 69) in cohort 1. The heatmap shows distinct patterns of up- and downregulated proteins in the clinical groups. The branching pattern of the dendrogram shows almost complete separation of patients with DLB from cognitively normal controls (35/40 (87.5%) were clustered correctly). Fifteen DLB patients were assigned to cluster 1 (red) and five DLB patients and 20 controls were assigned to cluster 2. The five DLB patients in cluster 2 clustered together in a small subgroup (cluster 2A, purple) and the controls clustered together in another subgroup (cluster 2B, blue). b Volcano plot representing the top biomarker candidates discriminating DLB from controls. The horizontal axis indicates log2 fold change. The vertical axis indicates − 10 log p-values. Each point represents a protein. Points at the far right- and left-hand sides of the plot have the largest fold changes, while those along the top of the plot are the most statistically significant. The non-axial red dotted vertical lines denote fold change thresholds of 1.2. The non-axial red dotted horizontal line denotes p-value threshold of 0.05. Proteins in red have a fold change > 1.2 and p-value < 0.05. The top-10 biomarker candidates are highlighted in the plot
Fig. 3
Fig. 3
Box and Whisker plots of candidate CSF biomarkers for DLB. a Log 10 LFQ intensity of VGF in cohort 1, b VGF in cohort 2, c, d SCG, e, f NPTX2, g, h NPTXR, i, j PDYN, k, l PCSK1N. The line through the middle of the boxes corresponds to the median and the lower and the upper lines to the 25th and 75th percentile, respectively. The whiskers extend from the 5th percentile on the bottom to the 95th percentile on top. Differences between DLB patients and controls were assessed limma package available from the Bioconductor package, * p < 0.05, ** p < 0.01, *** p < 0.001. Abbreviations: DLB, Dementia with Lewy bodies; NPTX2, Neuronal pentraxin 2; NPTXR, Neuronal pentraxin receptor, PCSK1N, ProSAAS; PDYN, Proenkephalin-B; SCG2, Secretogranin-2; VGF, Neurosecretory protein
Fig. 4
Fig. 4
Associations between the six CSF candidate biomarkers for DLB and MMSE. Scatter plots of MMSE and CSF levels of (a) VGF (b) SCG2, (c) NPTX2, (d) NPTXR, (e) PDYN, (f) PCSK1N across DLB (red) and control groups (blue). Individual subject cohort 1 are depicted as squares and individual subjects from cohort 2 are depicted as triangles. Associations were assessed using Spearman partial correlation adjusted for cohort. To correct for multiple comparisons, p-values were corrected using a false discovery rate (FDR) correction. Abbreviations: DLB, Dementia with Lewy bodies; NPTX2, Neuronal pentraxin 2; NPTXR, Neuronal pentraxin receptor, PCSK1N, ProSAAS; PDYN, Proenkephalin-B; SCG2, Scretogranin-2; VGF, Neurosecretory protein VGF
Fig. 5
Fig. 5
Validation of candidate biomarkers. a Differences in levels of candidate biomarkers between DLB and related neurodegenerative diseases. All protein levels were Z transformed according to the mean and standard deviation in controls, dotted line represents average protein levels for the control group. For PDYN, 4 outliers (z-score > 20) were illustrated in a box. Please note that the low variation in PDYN levels in AD patients is caused by lack of a measurable concentration.Differences were assessed with GLM corrected for age and a FDR correction was applied. * p < 0.05, ** p < 0.01, *** p < 0.001. b Validation of VGF and NPTX2 using orthogonal analytical methods. Levels of VGF373–417 (pmol/ml) were determined by ELISA, levels of VGF [LH/ratio] were determined with SRM and levels of NPTX2 (pg/ml) were determined with ELISA in CSF samples from DLB patients (n = 48) and controls (n = 28). The line through the middle of the boxes corresponds to the median and the lower and the upper lines to the 25th and 75th percentile, respectively. The whiskers extend from the 5th percentile on the bottom to the 95th percentile on top. Differences between DLB patients and controls were assessed with GLM. * p < 0.05, ** p < 0.01, *** p < 0.001. Abbreviations: AD, Alzheimer’s disease; DLB, Dementia with Lewy bodies; ELISA, enzyme-linked immunosorbent assays; FTD, frontotemporal dementia; NPTX2, Neuronal pentraxin 2; NPTXR, Neuronal pentraxin receptor, PCSK1N, ProSAAS; PD, Parkinson’s disease; PDYN, Proenkephalin-B; SCG2, Secretogranin-2; SRM, selected reaction monitoring; VGF, Neurosecretory protein VGF

References

    1. Walker Z, Possin KL, Boeve BF, Aarsland D. Lewy body dementias. Lancet. 2015;386(10004):1683–1697. - PMC - PubMed
    1. McKeith IG, Boeve BF, Dickson DW, Halliday G, Taylor JP, Weintraub D, et al. Diagnosis and management of dementia with Lewy bodies: fourth consensus report of the DLB consortium. Neurology. 2017;89(1):88–100. - PMC - PubMed
    1. Vekrellis K, Xilouri M, Emmanouilidou E, Rideout HJ, Stefanis L. Pathological roles of alpha-synuclein in neurological disorders. Lancet Neurol. 2011;10(11):1015–1025. - PubMed
    1. Blennow K, Hampel H, Weiner M, Zetterberg H. Cerebrospinal fluid and plasma biomarkers in Alzheimer disease. Nat Rev Neurol. 2010;6(3):131–144. - PubMed
    1. Teunissen CE, Otto M, Engelborghs S, Herukka SK, Lehmann S, Lewczuk P, et al. White paper by the society for CSF analysis and clinical neurochemistry: overcoming barriers in biomarker development and clinical translation. Alzheimers Res Ther. 2018;10(1):30. - PMC - PubMed

Publication types