. 2020 Jul 7;119(1):99-114.
doi: 10.1016/j.bpj.2020.05.025. Epub 2020 Jun 2.

Determining the Stoichiometry of Small Protein Oligomers Using Steady-State Fluorescence Anisotropy

Affiliations

Determining the Stoichiometry of Small Protein Oligomers Using Steady-State Fluorescence Anisotropy

Philipp J Heckmeier et al. Biophys J. .

Abstract

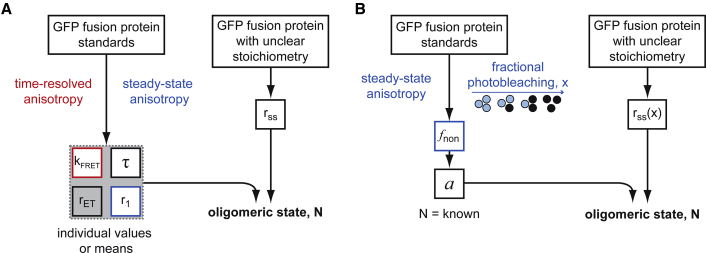
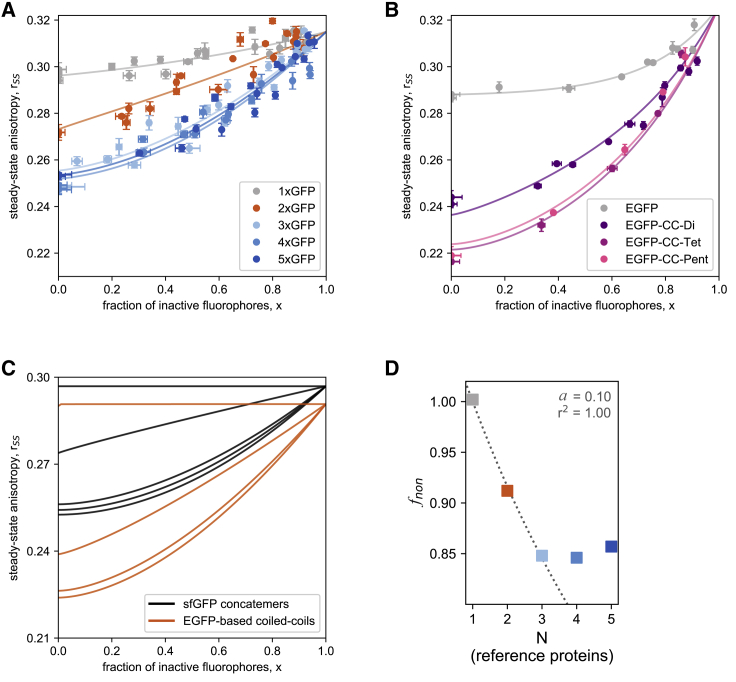
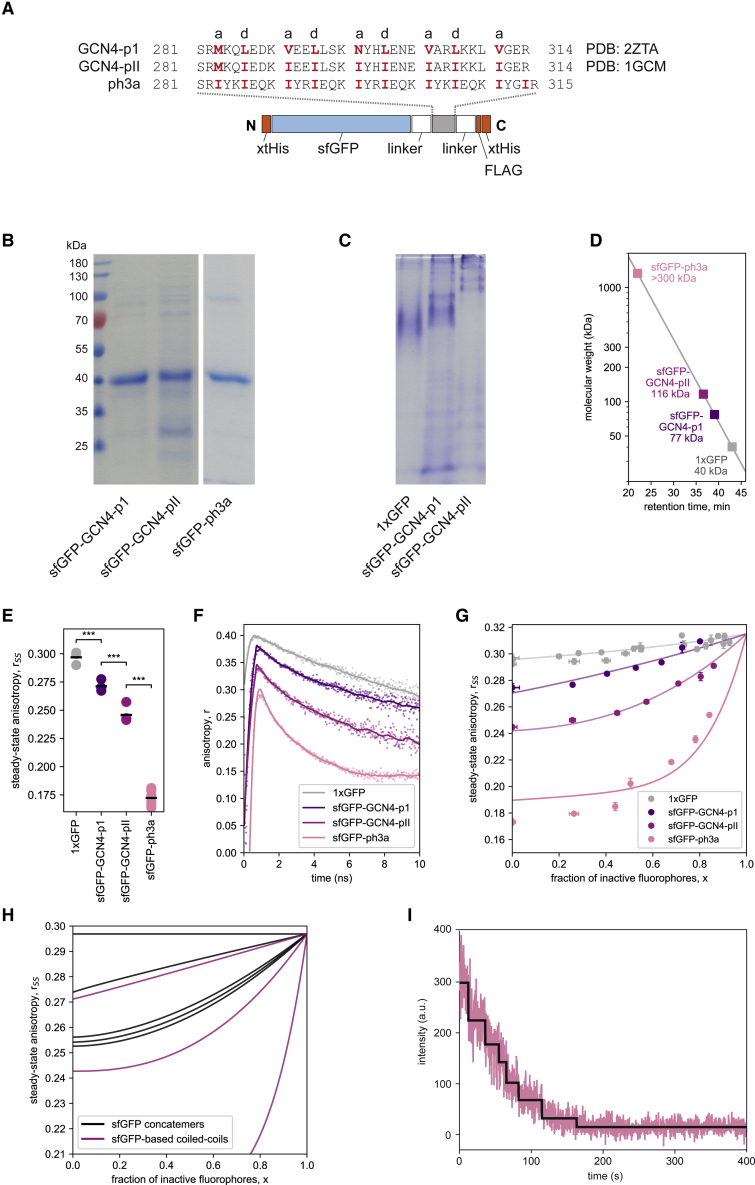
A large fraction of soluble and membrane-bound proteins exists as non-covalent dimers, trimers, and higher-order oligomers. The experimental determination of the oligomeric state or stoichiometry of proteins remains a nontrivial challenge. In one approach, the protein of interest is genetically fused to green fluorescent protein (GFP). If a fusion protein assembles into a non-covalent oligomeric complex, exciting their GFP moiety with polarized fluorescent light elicits homotypic Förster resonance energy transfer (homo-FRET), in which the emitted radiation is partially depolarized. Fluorescence depolarization is associated with a decrease in fluorescence anisotropy that can be exploited to calculate the oligomeric state. In a classical approach, several parameters obtained through time-resolved and steady-state anisotropy measurements are required for determining the stoichiometry of the oligomers. Here, we examined novel approaches in which time-resolved measurements of reference proteins provide the parameters that can be used to interpret the less expensive steady-state anisotropy data of candidates. In one approach, we find that using average homo-FRET rates (kFRET), average fluorescence lifetimes (τ), and average anisotropies of those fluorophores that are indirectly excited by homo-FRET (rET) do not compromise the accuracy of calculated stoichiometries. In the other approach, fractional photobleaching of reference oligomers provides a novel parameter a whose dependence on stoichiometry allows one to quantitatively interpret the increase of fluorescence anisotropy seen after photobleaching the candidates. These methods can at least reliably distinguish monomers from dimers and trimers.


Figures

Figure 1
Figure 1
Schematic structure of the test constructs and biochemical analysis of their stoichiometry. (A) Schematic structure of sfGFP concatemers. (B) SDS-PAGE of sfGFP concatemers (1 μM in loading buffer). (C) The amino acid sequences of de novo coiled-coil elements (25,26) linked to EGFP-based fusion proteins via short polyglycine linkers (27). (D) SDS-PAGE of the EGFP-based coiled-coil fusion proteins (2 μM). (E) EGFP-coiled-coil fusion proteins (2 μM) separated via native PAGE. We note that the uncropped gel image shown in Fig. S7 reveals a very minor fraction of aggregates formed by EGFP-CC-Pent that does not enter the gel. The other proteins tested here, however, did not show any signs of aggregation, nor is degradation detected. Thus, the influence of such artifacts on subsequent anisotropy measurements can essentially be excluded. (F) Derived molecular weights for EGFP-based coiled-coil fusion proteins from SEC profiles. The molecular masses were calculated relative to those of standard proteins. The data points represent ultraviolet or fluorescence intensity maxima, respectively (see details in Fig. S3). To see this figure in color, go online.
Figure 2
Figure 2
Characterization of sfGFP concatemers and EGFP-coiled-coil oligomers via fluorescence anisotropy. (A) The steady-state anisotropy of sfGFP concatemers (2 μM; λex = 488 nm; λem = 520 nm). Shown are the individual values of the steady-state anisotropy and the respective means (n = 3–6). Differences were classified with an unpaired Student’s t-test and ranked by their two-tailed p-values (p > 0.05). (B) The time-resolved fluorescence anisotropy of sfGFP concatemers (2 μM; excited with a polarized 468 nm pulsed laser, parallel and perpendicular detected fluorescence at 508 nm). (C) The steady-state anisotropy of EGFP-coiled-coil fusion protein (2 μM). Measurements and evaluation were done as in (A). (D) Time-resolved anisotropy decay of EGFP-coiled-coil fusion protein (2 μM). Measurements and evaluation were done as in (B). For the time-resolved fluorescence anisotropy measurements, samples were measured in buffer containing 30% glycerol to minimize molecular rotation (see also, Fig. S4). p ≤ 0.05, ∗∗p ≤ 0.01, ∗∗∗p ≤ 0.001. ns, not significant. To see this figure in color, go online.
Figure 3
Figure 3
Different approaches to determine protein stoichiometry from fluorescence anisotropy data. (A) Determination of oligomeric state Nss,indiv or Nss,std by time-resolved and steady-state anisotropy according to Runnels and Scarlata (10). (B) Characterization of Nx,a by steady-state anisotropy in combination with fractional photobleaching. To see this figure in color, go online.
Figure 4
Figure 4
Determination of protein stoichiometry via steady-state anisotropy and fractional photobleaching. Steady-state anisotropy was measured as a function of the fraction of photobleached fluorophores, as determined from the fluorescence intensities. The data were fitted with Eq. 6 for (A) sfGFP concatemers and (B) EGFP-based coiled-coil fusion proteins. (C) A comparison of fits of photobleaching data between the two test systems, sfGFP concatemers (long linkers, black), and EGFP-based non-covalent assemblies (short linkers). For better comparability, anisotropies were corrected for the apparent increase of monomer values in the wake of photobleaching. (D) The parameter fnon, calculated for both test systems via Eq. 5, is plotted as a function of N. A nonlinear least-squares approach for fnon = 1+a1+N×a was used to fit the data for the samples with N = 1–3 to obtain parameter a. To see this figure in color, go online.
Figure 5
Figure 5
Characterization of naturally occurring GCN4-based coiled-coil constructs and the multimeric ph3a. (A) Amino acid sequences of the coiled-coil elements of the GCN4-p1, GCN4-pII (30), and de novo designed peptide ph3a. The sequences were expressed in the context of a modular sfGFP-based fusion protein (see Fig. S1). (B) SDS-PAGE and (C) native PAGE separation of GCN4-based fusion proteins (2 μM in loading buffer). Note that the uncropped gel image shown in Fig. S7 reveals a very minor fraction of aggregates formed by sfGFP-GCN4-pII that does not enter the gel. The other proteins tested here, however, did not show any signs of aggregation, nor is degradation detected. Thus, the influence of such artifacts on subsequent anisotropy measurements can essentially be excluded. (D) Molecular masses derived from SEC profiles (see original elution profiles in Fig. S3). (E) The steady-state and (F) time-resolved anisotropies of GCN4 coiled-coil fusion proteins (2 μM). Measurements and evaluation were done as in Fig. 2. (G) Steady-state anisotropy was measured as a function of the fraction of photobleached fluorophores, as determined from the fluorescence intensities measured after various periods of irradiation. The data were fitted with Eq. 6. (H) A comparison of fits of photobleaching data between the sfGFP concatemers (black) and sfGFP-based GCN4 constructs (violet). For better comparability, all anisotropy values were corrected for the apparent increase of monomer values in the wake of photobleaching. (I) Number of subunits in sfGFP-ph3a assembly directly probed with TIRF microscopy. sfGFP-ph3a was immobilized on the polyethylene-glycol-passivated glass surface via anti-GFP antibody. Bleaching was induced with a 480 nm laser. For clarity, bleaching steps as detected by fitting the gradual decrease of GFP fluorescence are represented by a black line. We found seven bleaching steps that are consistent with a heptameric structure of the ph3a protein (also, see Fig. S6). To see this figure in color, go online.

References

    1. Goodsell D.S., Olson A.J. Structural symmetry and protein function. Annu. Rev. Biophys. Biomol. Struct. 2000;29:105–153. - PubMed
    1. Jones S., Thornton J.M. Principles of protein-protein interactions. Proc. Natl. Acad. Sci. USA. 1996;93:13–20. - PMC - PubMed
    1. Neumann J., Klein N., Schneider D. Folding energetics and oligomerization of polytopic α-helical transmembrane proteins. Arch. Biochem. Biophys. 2014;564:281–296. - PubMed
    1. Ali M.H., Imperiali B. Protein oligomerization: how and why. Bioorg. Med. Chem. 2005;13:5013–5020. - PubMed
    1. Gell D.A., Grant R.P., Mackay J.P. The detection and quantitation of protein oligomerization. In: Matthews J.M., editor. Protein Dimerization and Oligomerization in Biology. Springer; 2012. pp. 19–41. - PubMed

Publication types

MeSH terms

Substances

LinkOut - more resources