. 2020 Aug 6;182(3):744-753.e4.
doi: 10.1016/j.cell.2020.06.011. Epub 2020 Jun 10.

A SARS-CoV-2 Infection Model in Mice Demonstrates Protection by Neutralizing Antibodies

Affiliations

A SARS-CoV-2 Infection Model in Mice Demonstrates Protection by Neutralizing Antibodies

Ahmed O Hassan et al. Cell. .

Abstract

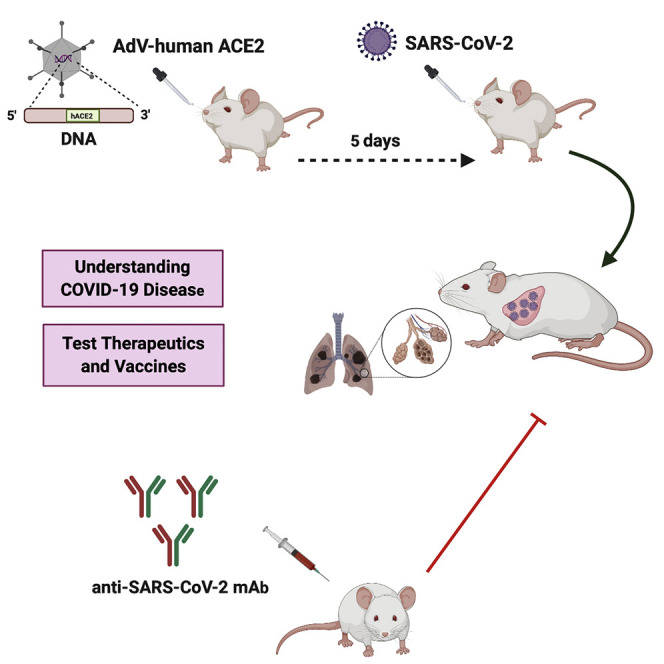
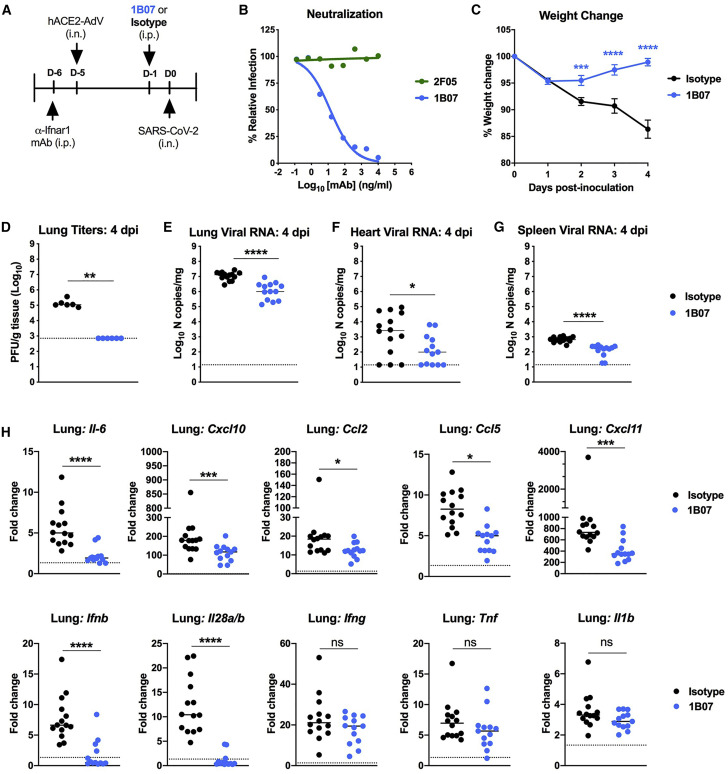
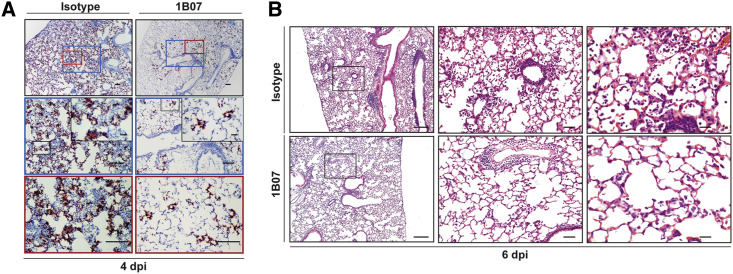
Severe acute respiratory syndrome coronavirus 2 (SARS-CoV-2) has caused a pandemic with millions of human infections. One limitation to the evaluation of potential therapies and vaccines to inhibit SARS-CoV-2 infection and ameliorate disease is the lack of susceptible small animals in large numbers. Commercially available laboratory strains of mice are not readily infected by SARS-CoV-2 because of species-specific differences in their angiotensin-converting enzyme 2 (ACE2) receptors. Here, we transduced replication-defective adenoviruses encoding human ACE2 via intranasal administration into BALB/c mice and established receptor expression in lung tissues. hACE2-transduced mice were productively infected with SARS-CoV-2, and this resulted in high viral titers in the lung, lung pathology, and weight loss. Passive transfer of a neutralizing monoclonal antibody reduced viral burden in the lung and mitigated inflammation and weight loss. The development of an accessible mouse model of SARS-CoV-2 infection and pathogenesis will expedite the testing and deployment of therapeutics and vaccines.

Keywords: COVID-19; SARS-CoV-2; animal model; antibody; coronavirus; inflammation; mice; pathogenesis; pneumonia.


Conflict of interest statement

Declaration of Interests M.S.D. is a consultant for Inbios, Eli Lilly, Vir Biotechnology, NGM Biopharmaceuticals, and on the Scientific Advisory Board of Moderna. A.H.E. is a consultant for Inbios and Fimbrion Therapeutics. The Diamond laboratory has received unrelated funding under sponsored research agreements from Moderna and Emergent BioSolutions. The Ellebedy laboratory has received funding under a sponsored research agreement with Emergent BioSolutions. The Perlman laboratory has received research support from Eli Lilly and AbbVie.

Figures

None
Graphical abstract
Figure 1
Figure 1
SARS-CoV-2 Infection in Conventional Laboratory Strains of Mice and Expression of hACE2 after AdV Transduction (A and B) 3-to-4-week-old BALB/c, DBA/2J, Stat1−/− C57BL/6, Rag1−/− C57BL/6, and AG129 mice were inoculated via combined intranasal and intravenous routes with 105 focus-forming units (FFU) of SARS-CoV-2. Weight change (A) was monitored, and viral burden (B) in the lung was determined at 10 dpi by RT-qPCR and expressed as copies of viral N gene per mg of tissue (n = 2 to 3 for each strain). Naive mice are shown as a control. Error bars indicate standard deviations (SD). (C) HEK293 cells were transduced with AdV-hACE2-GFP. Flow cytometric analysis of hACE2 and GFP expression was analyzed at 4 and 10 h after AdV transduction. One of two experiments is shown. (D) mRNA expression levels of hACE2 in the lungs of mice receiving the AdV-hACE2 at D-3, D-1, D0, and D4 relative to SARS-CoV-2 infection (2, 4, 5, and 8 days after AdV delivery) via intranasal route as measured by species-specific qRT-PCR of hACE2. Bars indicate median values. (E) In situ hybridization using probes for hACE2 in lungs of control mice receiving anti-Ifnar1 mAb (left) or at D-3, D-1, and D0 relative to SARS-CoV-2 infection (2, 4, or 5 days post-transduction of mice receiving anti-Ifnar1 + AdV-hACE2) (right). Images show low-power (top; scale bars, 100 μm) and medium-power (middle [blue] and bottom [red]; scale bars, 100 μm) magnifications with an additional high-power magnification inset (scale bars, 10 μm). Arrows indicate hACE2-positive cells in medium-power magnification (representative images from n = 3 per group).
Figure 2
Figure 2
SARS-CoV-2 Infection in AdV-hACE2-Transduced Mice (A) 8-to-10-week-old male and female BALB/c mice received anti-Ifnar1 mAb (2 mg, intraperitoneal [i.p.] route; day −5), hACE2-AdV (2.5 × 108 PFU, intranasal [i.n.] route, day −5), or SARS-CoV-2 (105 FFU, i.n. + intravenous [i.v.] route, day 0) as indicated. (B and C) Weight change was monitored (B) and viral burden in the lungs was analyzed at 4 dpi by plaque assay (C) (two experiments). Error bars indicate SD. The dashed line indicates the assay limit of detection. (D–H) Viral RNA levels in tissues of BALB/c (D–F and H) or C57BL/6J (G) mice after AdV-hACE2 transduction (i.n.) and SARS-CoV-2 inoculation (i.n. only, E–G; i.n. + i.v., D–E and H, route) was measured by RT-qPCR after harvesting at indicated days. As indicated in each graph legend, in some experiments anti-Ifnar1 mAb was administered prior to hACE2-AdV transduction and/or SARS-CoV-2 inoculation. All symbols are color-coded to the indicated experimental conditional and represent data from individual mice. (E–H) Bars indicate median values. (I) SARS-CoV-2 RNA in situ hybridization of lungs of naive mice or mice receiving AdV-hACE2 only, AdV-hACE2 + SARS-CoV-2, AdV-hACE2 + anti-Ifnar1 mAb + SARS-CoV-2 at 4 dpi. Images show low- (top; scale bars, 100 μm) and medium- (middle; scale bars, 100 μm) power magnification with a high-power magnification inset (scale bars, 10 μm; representative images from n = 3 per group).
Figure 3
Figure 3
Histopathological Analysis of SARS-CoV-2 Infection in AdV-hACE2-Transduced BALB/c Mice (A–C) Hematoxylin and eosin staining of lung sections from BALB/c mice after no treatment (A) or after intranasal administration of AdV-hACE2, AdV-hACE2 + SARS-CoV-2, or AdV-hACE2 + anti-Ifnar1 Ab + SARS-CoV-2 with tissue analysis at 4 dpi (B) or 8 dpi (C) using the protocol described in Figure 2. Scale bars, 500 μm. Each image is representative of a group of 3 mice.
Figure 4
Figure 4
Protective Effect of a Neutralizing mAb against SARS-CoV-2 Infection (A) Experimental scheme. 8-week-old male BALB/c mice were treated with anti-Ifnar1 mAb and transduced with AdV-hACE2 via the i.n. route. Four days later, mice were treated via i.p. route with 200 ug of 1B07 (anti-SARS-CoV-2) or isotype control 2H09 (anti-influenza A virus) mAb. One day later, SARS-CoV-2 (4 × 105 FFU per mouse) was inoculated via an i.n. route. (B) Anti-SARS-CoV-2 mAbs (1B07 and 2F05) were incubated with 102 FFU of SARS-CoV-2 for 1 h at 37°C followed by addition of mAb-virus mixture to Vero E6 cells. Virally infected foci were stained and counted. Wells containing mAb were compared with wells containing no mAb to determine the relative infection. One experiment of three is shown. (C–G) In vivo outcomes. Weight change (C) was monitored (n = 15–16, two-way ANOVA with Sidak’s post-test: ∗∗∗p < 0.001, ∗∗∗∗p < 0.0001), and viral burden at 4 dpi was determined in the lung (D and E), heart (F), and spleen (G) by plaque assay (D) or qRT-PCR (E–G) (D, n = 6; E–G, n = 13–16; Mann-Whitney test, p < 0.05, ∗∗p < 0.01, ∗∗∗∗p < 0.0001). The dashed line indicates the assay limit of detection. (H) Fold change in gene expression of indicated cytokines and chemokines was determined by qRT-PCR, normalized to Gapdh, and compared with naive controls in lung homogenates at 4 dpi from 1B07 or isotype control mAb-treated mice (three experiments, n = 13-15 per group, Mann-Whitney test: ns, not significant, p < 0.05, ∗∗∗p < 0.001, ∗∗∗∗p < 0.0001). Dotted line indicates the average level of cytokine or chemokine transcript in naive mice. Error bars indicate standard error of the mean (C), and bars represent median values (D–H).
Figure 5
Figure 5
Pathological Analysis of SARS-CoV-2 Infection in Anti-SARS-CoV-2-mAb-Treated AdV-hACE2-Transduced BALB/c Mice (A) SARS-CoV-2 RNA in situ hybridization at 4 dpi of lungs from 8-week-old BALB/c mice treated with 200 μg of 1B07 (anti-SARS-CoV-2) or isotype control 2H09 (anti-influenza A virus) that also received AdV-hACE2 + anti-Ifnar1 mAb + SARS-CoV-2 as described in Figure 4. Images show low- (top; scale bars, 100 μm) and medium- (middle; scale bars, 100 μm) power magnification with a high-power magnification inset (scale bars, 10 μm; representative images from n = 3 per group). (B) Hematoxylin and eosin staining of lung sections from 8-week-old BALB/c mice at 6 dpi after treatment with 1B07 or isotype control mAbs. Mice were given an intranasal administration of AdV-hACE2 + anti-Ifnar1 Ab + SARS-CoV-2 as described in Figure 4. Images show low- (left; scale bars, 250 μm), medium- (middle; scale bars, 50 μm), and high-power magnification (scale bars, 25 μm). Each image is representative of a group of 3 mice.

References

    1. Alattar R., Ibrahim T.B.H., Shaar S.H., Abdalla S., Shukri K., Daghfal J.N., Khatib M.Y., Aboukamar M., Abukhattab M., Alsoub H.A. Tocilizumab for the Treatment of Severe COVID-19. J Med Virol. 2020 doi: 10.1002/jmv.25964. Published online May 5, 2020. - DOI - PMC - PubMed
    1. Amanat F., Krammer F. SARS-CoV-2 Vaccines: Status Report. Immunity. 2020;52:583–589. - PMC - PubMed
    1. Bao L., Deng W., Huang B., Gao H., Liu J., Ren L., Wei Q., Yu P., Xu Y., Qi F. The pathogenicity of SARS-CoV-2 in hACE2 transgenic mice. Nature. 2020 doi: 10.1038/s41586-020-2312-y. Published online May 7, 2020. - DOI - PubMed
    1. Barton L.M., Duval E.J., Stroberg E., Ghosh S., Mukhopadhyay S. COVID-19 Autopsies, Oklahoma, USA. Am. J. Clin. Pathol. 2020;153:725–733. - PMC - PubMed
    1. Boon A.C., Finkelstein D., Zheng M., Liao G., Allard J., Klumpp K., Webster R., Peltz G., Webby R.J. H5N1 influenza virus pathogenesis in genetically diverse mice is mediated at the level of viral load. MBio. 2011;2 e00171–e00111. - PMC - PubMed

Publication types

MeSH terms