. 2021 Jan:227:1-14.
doi: 10.1016/j.trsl.2020.06.006. Epub 2020 Jun 15.

The selective PPAR-delta agonist seladelpar reduces ethanol-induced liver disease by restoring gut barrier function and bile acid homeostasis in mice

Affiliations

The selective PPAR-delta agonist seladelpar reduces ethanol-induced liver disease by restoring gut barrier function and bile acid homeostasis in mice

Huikuan Chu et al. Transl Res. 2021 Jan.

Abstract

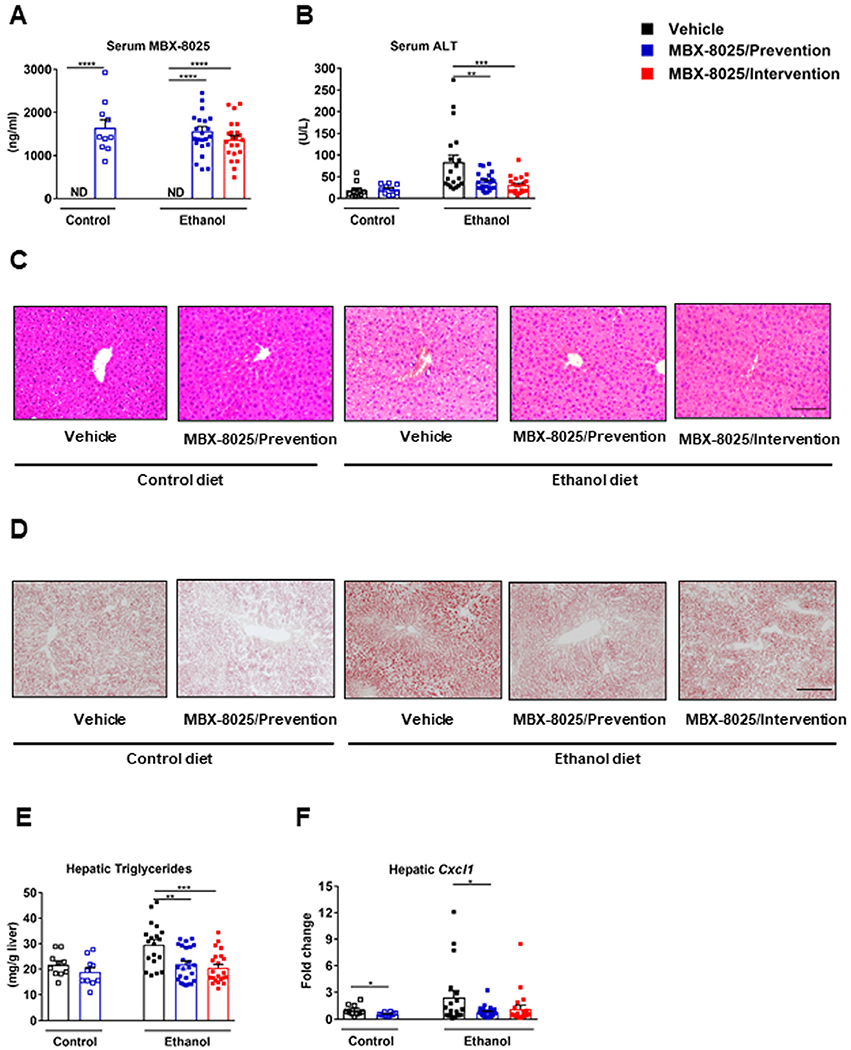
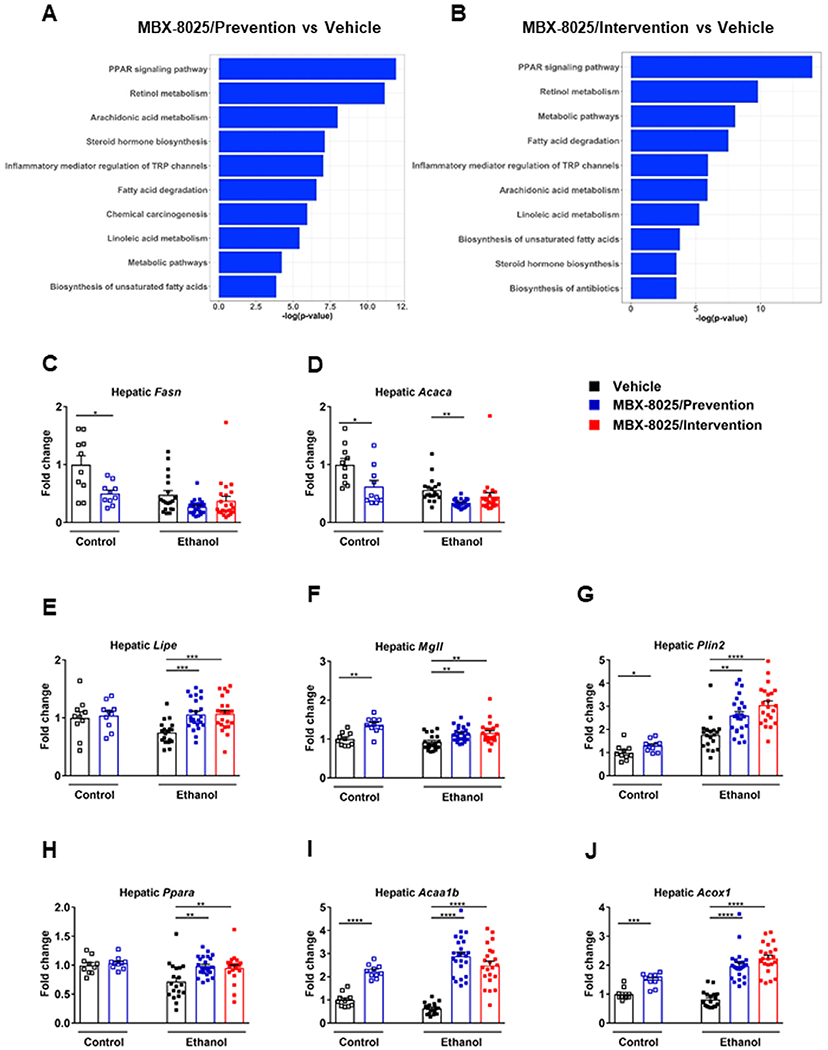
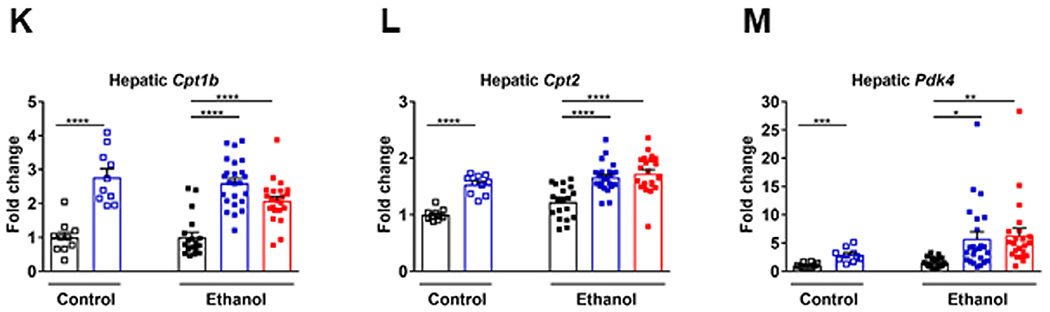
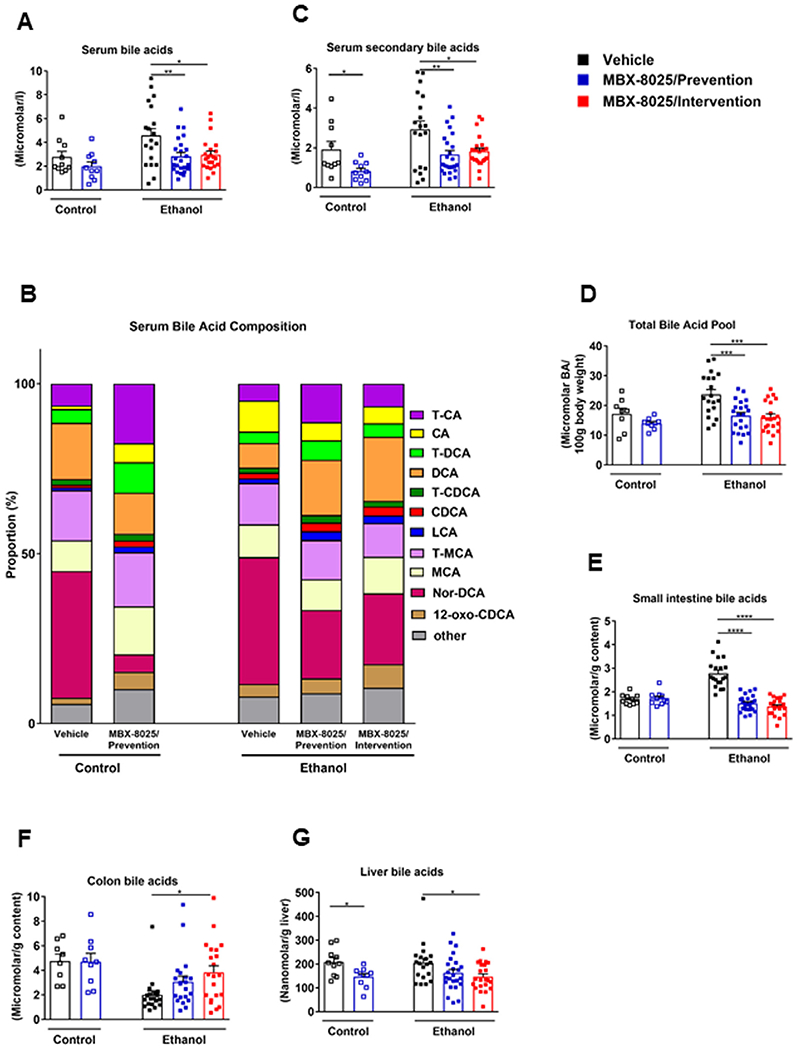
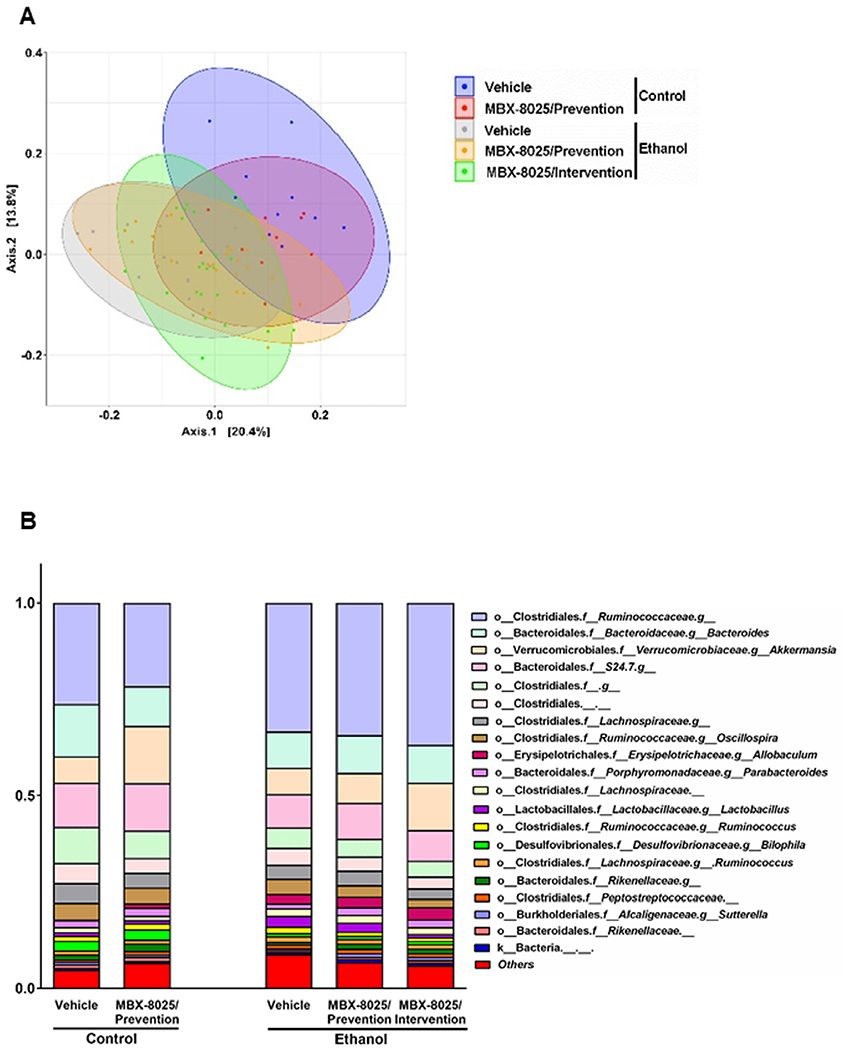
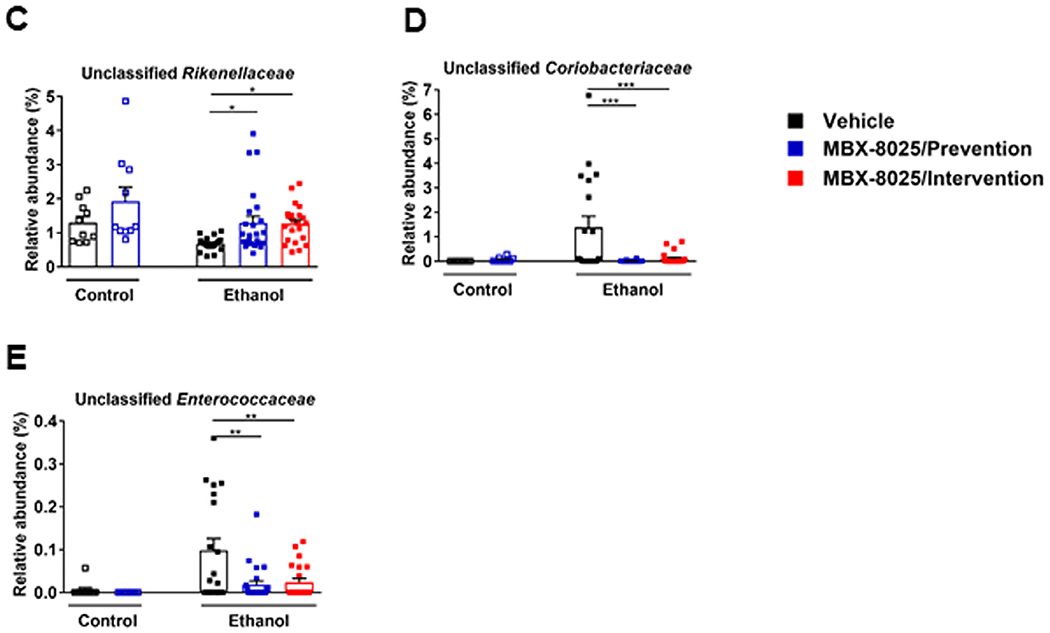
Alcohol-associated liver disease is accompanied by dysregulation of bile acid metabolism and gut barrier dysfunction. Peroxisome proliferator-activated receptor-delta (PPARδ) agonists are key metabolic regulators and have anti-inflammatory properties. Here, we evaluated the effect of the selective PPAR-delta agonist seladelpar (MBX-8025) on gut barrier function and bile acid metabolism in a mouse model of ethanol-induced liver disease. Wild type C57BL/6 mice were fed LieberDeCarli diet containing 0%-36% ethanol (caloric) for 8 weeks followed by a single binge of ethanol (5 g/kg). Pair fed mice received an isocaloric liquid diet as control. MBX-8025 (10 mg/kg/d) or vehicle were added to the liquid diet during the entire feeding period (prevention), or during the last 4 weeks of Lieber DeCarli diet feeding (intervention). In both prevention and intervention trials, MBX-8025 protected mice from ethanol-induced liver disease, characterized by lower serum alanine aminotransferase (ALT) levels, hepatic triglycerides, and inflammation. Chronic ethanol intake disrupted bile acid metabolism by increasing the total bile acid pool and serum bile acids. MBX-8025 reduced serum total and secondary bile acids, and the total bile acid pool as compared with vehicle treatment in both prevention and intervention trials. MBX-8025 restored ethanol-induced gut dysbiosis and gut barrier dysfunction. Data from this study demonstrates that seladelpar prevents and treats ethanol-induced liver damage in mice by direct PPARδ agonism in both the liver and the intestine.

Keywords: Enterohepatic circulation; Gut barrier; Microbiome.


Figures

Fig 1.
Fig 1.
MBX-8025 protects from ethanol-induced liver disease. C57BL/6 mice were fed an oral isocaloric (control) diet (1–2 technical replicates) or a chronic Lieber-DeCarli diet for 8 weeks followed by 1 binge of ethanol (3–4 technical replicates), and treated with vehicle, or MBX-8025 (10 mg/kg/d) daily by adding MBX-8025 in the liquid diet during the entire feeding period (prevention) or during the last 4 weeks of ethanol feeding (intervention). (A) Serum levels of MBX-8025. (B) Serum levels of alanine aminotransferase (ALT). (C) Representative images of H&E stained liver tissue. (D) Representative images of Oil Red O stained liver tissue. (E) Hepatic triglyceride levels. (F) Hepatic levels of Cxcl1 mRNA. Control diet: Vehicle, n = 8–10; MBX-8025/ Prevention, n= 10; Ethanol diet: Vehicle, n= 15–19; MBX-8025/Prevention, n = 23–24; MBX-8025/Intervention, n = 22. Scale bar = 50 μm (C). Scale bar= 100 μm (D). Results are expressed as mean § s.e.m. (A, B, E, F). P values were determined using Mann-Whitney-Wilcoxon test for control diet-fed mouse groups (A, B, E, F), and Kruskal-Wallis test with Dunn’s post hoc test for ethanol-fed mouse groups (A) and one-way ANOVA with Tukey’s post hoc test for ethanol-fed mouse groups (B, E, F). *P < 0.05, **P < 0.01, ***P < 0.001, ****P < 0.0001.
Fig 2.
Fig 2.
Effect of MBX-8025 on hepatic gene expression. C57BL/6 mice were fed an oral isocaloric (control) diet (1-2 technical replicates) or a chronic Lieber-DeCarli diet for 8 weeks followed by 1 binge of ethanol (3–4 technical replicates), and treated with vehicle, or MBX-8025 (10 mg/kg/d) daily by adding MBX-8025 in the liquid diet during the entire feeding period (prevention) or during the last 4 weeks of ethanol feeding (intervention). (A) Ranking of top 10 biological processes by −log(P value) in the liver of MBX-8025 treated (prevention group) compared with vehicle treated, ethanol-fed mice. (B) Ranking of top 10 biological processes by −log(P value) in the liver of MBX-8025 treated (intervention group) compared with vehicle treated, ethanol-fed mice. (C) Hepatic levels of Fasn mRNA. (D) Hepatic levels of Acaca mRNA. (E) Hepatic levels of Lipe mRNA. (F) Hepatic levels of Mgll mRNA. (G) Hepatic levels of Plin2 mRNA. (H) Hepatic levels of Ppara mRNA. (I) Hepatic levels of Acaa1b mRNA. (J) Hepatic levels of Acox1 mRNA. (K) Hepatic levels of Cpt1b mRNA. (L) Hepatic levels of Cpt2 mRNA. (M) Hepatic levels of Pdk4 mRNA. Control diet: Vehicle, n = 10; MBX-8025/Prevention, n = 10; Ethanol diet: Vehicle, n = 19; MBX-8025/Prevention, n = 24; MBX-8025/Intervention, n = 22. Results are expressed as mean § s.e.m. (C-M). P values were determined using one-way ANOVA with Tukey’s post hoc test for ethanol-fed mouse groups and Mann-Whitney-Wilcoxon test for control diet-fed mouse groups (C-M). *P < 0.05, **P < 0.01, ***P < 0.001, ****P < 0.0001.
Fig 2.
Fig 2.
Effect of MBX-8025 on hepatic gene expression. C57BL/6 mice were fed an oral isocaloric (control) diet (1-2 technical replicates) or a chronic Lieber-DeCarli diet for 8 weeks followed by 1 binge of ethanol (3–4 technical replicates), and treated with vehicle, or MBX-8025 (10 mg/kg/d) daily by adding MBX-8025 in the liquid diet during the entire feeding period (prevention) or during the last 4 weeks of ethanol feeding (intervention). (A) Ranking of top 10 biological processes by −log(P value) in the liver of MBX-8025 treated (prevention group) compared with vehicle treated, ethanol-fed mice. (B) Ranking of top 10 biological processes by −log(P value) in the liver of MBX-8025 treated (intervention group) compared with vehicle treated, ethanol-fed mice. (C) Hepatic levels of Fasn mRNA. (D) Hepatic levels of Acaca mRNA. (E) Hepatic levels of Lipe mRNA. (F) Hepatic levels of Mgll mRNA. (G) Hepatic levels of Plin2 mRNA. (H) Hepatic levels of Ppara mRNA. (I) Hepatic levels of Acaa1b mRNA. (J) Hepatic levels of Acox1 mRNA. (K) Hepatic levels of Cpt1b mRNA. (L) Hepatic levels of Cpt2 mRNA. (M) Hepatic levels of Pdk4 mRNA. Control diet: Vehicle, n = 10; MBX-8025/Prevention, n = 10; Ethanol diet: Vehicle, n = 19; MBX-8025/Prevention, n = 24; MBX-8025/Intervention, n = 22. Results are expressed as mean § s.e.m. (C-M). P values were determined using one-way ANOVA with Tukey’s post hoc test for ethanol-fed mouse groups and Mann-Whitney-Wilcoxon test for control diet-fed mouse groups (C-M). *P < 0.05, **P < 0.01, ***P < 0.001, ****P < 0.0001.
Fig 3.
Fig 3.
Effect of MBX-8025 on bile acid metabolism. C57BL/6 mice were fed an oral isocaloric (control) diet (1–2 technical replicates) or a chronic Lieber-DeCarli diet for 8 weeks followed by 1 binge of ethanol (3–4 technical replicates), and treated with vehicle, or MBX-8025 (10 mg/kg/d) daily by adding MBX-8025 in the liquid diet during the entire feeding period (prevention) or during the last 4 weeks of ethanol feeding (intervention). (A) Bile acid concentration in serum. (B) Serum bile acid composition ratio. (C) Secondary bile acid concentration in serum. (D) Total bile acid pool. (E) Bile acid concentration in small intestinal contents. (F) Bile acid concentration in colon contents. (G) Bile acid concentration in liver. Control diet: Vehicle, n = 8–10; MBX-8025/ Prevention trial, n = 9–10; Ethanol diet: Vehicle, n = 19; MBX-8025/Prevention, n = 21–24; MBX-8025/Intervention, n = 21–22. Results are expressed as mean ± s.e.m. (A, C-G). P values were determined using one-way ANOVA with Tukey’s post hoc test for ethanol-fed mouse groups and Mann-Whitney-Wilcoxon test for control diet-fed mouse groups (A, C-G). *P < 0.05, **P < 0.01, ***P < 0.001, ****P < 0.0001. CA, cholic acid; CDCA, chenodeoxycholic acid; DCA, deoxycholic acid; LCA, lithocholic acid; MCA, muricholic acid; T-CA, taurocholic acid; T-CDCA, taurochenodeoxycholic acid; T-DCA, taurodeoxycholic acid; T-MCA, tauromuricholic acid.
Fig 4.
Fig 4.
MBX-8025 modulates gut microbiota.C57BL/6 mice were fed an oral isocaloric (control) diet (1–2 technical replicates) or a chronic Lieber-DeCarli diet for 8 weeks followed by 1 binge of ethanol (3–4 technical replicates), and treated with vehicle, or MBX-8025 (10 mg/kg/d) daily by adding MBX-8025 in the liquid diet during the entire feeding period (prevention) or during the last 4 weeks of ethanol feeding (intervention). (A) Principal coordinate analysis (PCoA) based on Unweighted UniFrac distances was used to show-diversity among groups, at the genus level. The axes are the 2 most discriminating axes, based on binary metric; 20.4% of the variances were explained by axis 1 and 13.8% by axis 2. (B) The mean relative abundance of sequence reads in each genus for each group. 0–1 corresponds to 0%–100% abundance. (C) Relative abundance of unclassified Rikenellaceae. (D) Relative abundance of unclassified Coriobacteriaceae. (E) Relative abundance of unclassified Enterococcaceae. Control diet: Vehicle, n = 10; MBX-8025/Prevention, n = 10; Ethanol diet: Vehicle, n = 19; MBX-8025/Prevention, n = 24; MBX-8025/Intervention, n = 22. Results are expressed as mean ± s.e.m. (C–E). P values were determined using one-way ANOVA with Tukey’spost hoc test for ethanol-fed mouse groups and Mann-Whitney-Wilcoxon test for control diet-fed mouse groups (C–E). *P < 0.05, **P < 0.01, ***P < 0.001.
Fig 4.
Fig 4.
MBX-8025 modulates gut microbiota.C57BL/6 mice were fed an oral isocaloric (control) diet (1–2 technical replicates) or a chronic Lieber-DeCarli diet for 8 weeks followed by 1 binge of ethanol (3–4 technical replicates), and treated with vehicle, or MBX-8025 (10 mg/kg/d) daily by adding MBX-8025 in the liquid diet during the entire feeding period (prevention) or during the last 4 weeks of ethanol feeding (intervention). (A) Principal coordinate analysis (PCoA) based on Unweighted UniFrac distances was used to show-diversity among groups, at the genus level. The axes are the 2 most discriminating axes, based on binary metric; 20.4% of the variances were explained by axis 1 and 13.8% by axis 2. (B) The mean relative abundance of sequence reads in each genus for each group. 0–1 corresponds to 0%–100% abundance. (C) Relative abundance of unclassified Rikenellaceae. (D) Relative abundance of unclassified Coriobacteriaceae. (E) Relative abundance of unclassified Enterococcaceae. Control diet: Vehicle, n = 10; MBX-8025/Prevention, n = 10; Ethanol diet: Vehicle, n = 19; MBX-8025/Prevention, n = 24; MBX-8025/Intervention, n = 22. Results are expressed as mean ± s.e.m. (C–E). P values were determined using one-way ANOVA with Tukey’spost hoc test for ethanol-fed mouse groups and Mann-Whitney-Wilcoxon test for control diet-fed mouse groups (C–E). *P < 0.05, **P < 0.01, ***P < 0.001.
Fig 5.
Fig 5.
MBX-8025 restores gut barrier function during chronic ethanol feeding. C57BL/6 mice were fed an oral isocaloric (control) diet (1–2 technical replicates) or a chronic Lieber-DeCarli diet for 8 weeks followed by 1 binge of ethanol (3–4 technical replicates), and treated with vehicle, or MBX-8025 (10 mg/kg/d) daily by adding MBX-8025 in the liquid diet during the entire feeding period (prevention) or during the last 4 weeks of ethanol feeding (intervention). (A) Fecal albumin. (B) Serum LPS. (C) Ranking of top 10 biological processes by −log(P value) in the ileum of MBX-8025 treated (prevention group) compared with vehicle treated, ethanol-fed mice. (D) Ranking of top 10 biological processes by −log(P value) in the ileum of MBX-8025 treated (intervention group) compared with vehicle treated, ethanol-fed mice. (E) Ileal Dhrs9 mRNA level. (F) Ileal Ftcd mRNA level. (G) Ileal FoxMl mRNA level. (H) Ileal Sox9 mRNA level. (I) Ileal S100G mRNA level. (J) Ileal Mgl2 mRNA level. Control diet: Vehicle, n = 10; MBX-8025/Prevention, n = 9–10; Ethanol diet: Vehicle, n = 15–19; MBX-8025/Prevention trial, n = 21–23; MBX-8025/Intervention, n = 17–22. Results are expressed as mean ± s.e.m (A, B, E–J). P values were determined using one-way ANOVA with Tukey’s post hoc test for ethanol-fed mouse groups and Mann-Whitney-Wilcoxon test for control diet-fed mouse groups (A–C, F–K). *P < 0.05, **P < 0.01, ****P < 0.0001.

Similar articles

Cited by

References

    1. Moon AM, Singal AG, Tapper EB. Contemporary epidemiology of chronic liver disease and cirrhosis. Clin Gastroenterol Hepatol 2019. - PMC - PubMed
    1. Crabb DW, Im GY, Szabo G, Mellinger JL, Lucey MR. Diagnosis and treatment of alcohol-associated liver diseases: 2019 practice guidance from the American Association for the Study of Liver Diseases. Hepatology 2020;71:306–33. - PubMed
    1. Dang K, Hirode G, Singal AK, Sundaram V, Wong RJ. Alcoholic liver disease epidemiology in the United States: a retrospective analysis of 3 US databases. Am J Gastroenterol 2020;115:96–104. - PubMed
    1. Kim D, Li AA, Perumpail RB, et al. Disparate trends in mortality of etiology-specific chronic liver diseases among hispanic sub-populations. Clin Gastroenterol Hepatol 2019;17:1607–15 e2. - PMC - PubMed
    1. Dunn W, Shah VH. Pathogenesis of alcoholic liver disease. Clin Liver Dis 2016;20:445–56. - PMC - PubMed

Publication types