. 2020 Aug 15:401:115111.
doi: 10.1016/j.taap.2020.115111. Epub 2020 Jun 14.

Cytochrome P4501B1 in bone marrow is co-expressed with key markers of mesenchymal stem cells. BMS2 cell line models PAH disruption of bone marrow niche development functions

Affiliations

Cytochrome P4501B1 in bone marrow is co-expressed with key markers of mesenchymal stem cells. BMS2 cell line models PAH disruption of bone marrow niche development functions

Michele Campaigne Larsen et al. Toxicol Appl Pharmacol. .

Abstract

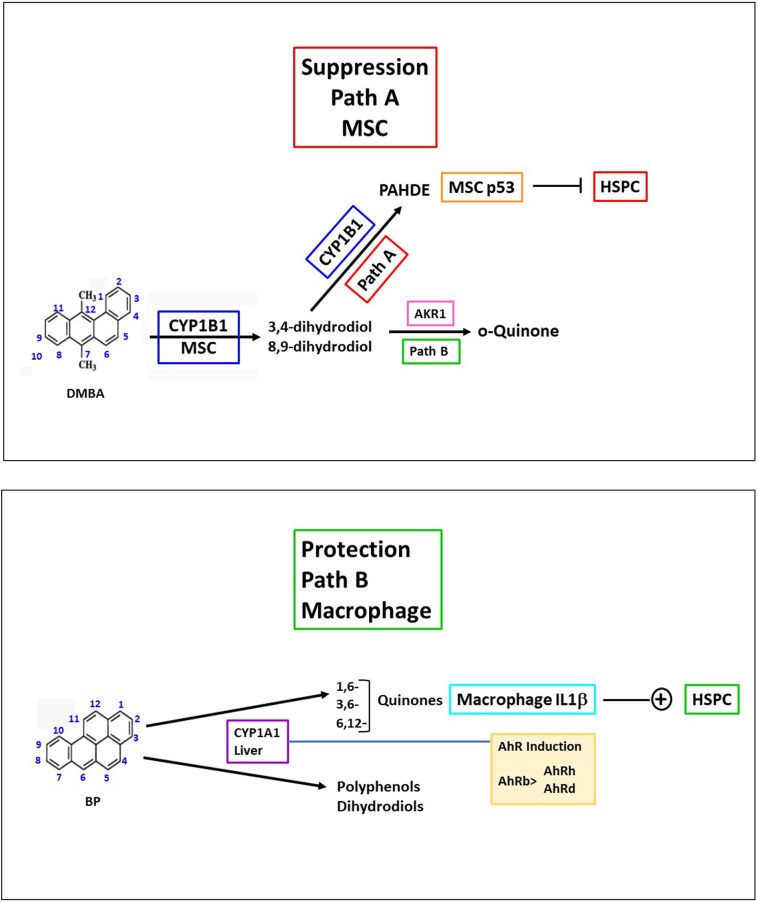
Polycyclic aromatic hydrocarbons (PAHs) are ubiquitous pollutants that are metabolized to carcinogenic dihydrodiol epoxides (PAHDE) by cytochrome P450 1B1 (CYP1B1). This metabolism occurs in bone marrow (BM) mesenchymal stem cells (MSC), which sustain hematopoietic stem and progenitor cells (HSPC). In BM, CYP1B1-mediated metabolism of 7, 12-dimethylbenz[a]anthracene (DMBA) suppresses HSPC colony formation within 6 h, whereas benzo(a)pyrene (BP) generates protective cytokines. MSC, enriched from adherent BM cells, yielded the bone marrow stromal, BMS2, cell line. These cells express elevated basal CYP1B1 that scarcely responds to Ah receptor (AhR) inducers. BMS2 cells exhibit extensive transcriptome overlap with leptin receptor positive mesenchymal stem cells (Lepr+ MSC) that control the hematopoietic niche. The overlap includes CYP1B1 and the expression of HSPC regulatory factors (Ebf3, Cxcl12, Kitl, Csf1 and Gas6). MSC are large, adherent fibroblasts that sequester small HSPC and macrophage in the BM niche (Graphic abstract). High basal CYP1B1 expression in BMS2 cells derives from interactions between the Ah-receptor enhancer and proximal promoter SP1 complexes, boosted by autocrine signaling. PAH effects on BMS2 cells model Lepr+MSC niche activity. CYP1B1 metabolizes DMBA to PAHDE, producing p53-mediated mRNA increases, long after the in vivo HSPC suppression. Faster, direct p53 effects, favored by stem cells, remain possible PAHDE targets. However, HSPC regulatory factors remained unresponsive. BP is less toxic in BMS2 cells, but, in BM, CYP1A1 metabolism stimulates macrophage cytokines (Il1b > Tnfa> Ifng) within 6 h. Although absent from BMS2 and Lepr+MSC, their receptors are highly expressed. The impact of this cytokine signaling in MSC remains to be determined.

Keywords: BMS2 cells; Bone marrow vascular niche; CYP1B1; Hematopoietic stem and progenitor cells; Lepr+MSC; Mesenchymal stem cells.


Conflict of interest statement

Declaration of Competing Interest The authors acknowledge no conflicts of interest with these studies.

Figures

Unlabelled Image
Graphical abstract
Fig. 1
Fig. 1
DMBA and BP effect changes in adherent BM. BMS2 cells effectively model MSC processes. A. IP DMBA (left, 1 uM) and BP (right, 1 uM) treatment suppresses CFU activity in C57BL/6 J (WT) lymphoid (pre—B) and myeloid (GM) BM cells within 6 h. Suppression is greater with DMBA treatment. CYP1B1 deletion (KO) attenuates these suppressive effects. Statistical significance: *p < .01, **p < .01. B. Reversal of lymphoid and myeloid CFU suppression is observable within 48 h post oral DMBA (1 uM) treatment. Statistical significance: ***p < .001. C. Time course of BP stimulated gene expression. BP (1 uM) maximally induces BM mediators of oxidative stress and inflammatory cytokine expression within 6 h, paralleling CFU activity suppression. D. The BMS2 cell model effectively models MSC, with respect to adipogenic differentiation. Differentiation (lipid droplet accumulation) was assessed in cultured BMS2 cells 8 days post adipogenic stimulation. The primary BM MSC from C57BL/6 J (BM/6 J) mice were cultured for 7 days prior to stimulation. Differentiation was examined in these primary cultures 8 days post stimulation. 10× magnification. E. Co-culture of BM MSC with BMS2 cells sustains lymphoid (pre—B) CFU activity for 24 h post BM isolation. Cells were placed in culture with media alone (Media) or in co-culture with BMS2 (BMS2) cells for 24 h prior to methocult culture initiation. Direct cultures (positive control) were placed in methocult media immediately upon isolation from the BM. *Statistical significance, p < .05. F. BMS2 cells express substantial basal CYP1B1 mRNA (10 μg mRNA/lane, left), relative to C3H10T1/2 embryo fibroblasts, which is modestly induced by 24 h AhR activation (0.1% DMSO control, C, 10 uM DMBA, D; 10 nM TCDD, T). Basal BMS2 microsomal CYP1B1 protein expression parallels primary C57BL/6 J (BM/6 J) BM levels (right), which is sustained with in vivo AhR deletion (BM/6 J AhR−/−). BM cells lack CYP1A1 expression. Cell cultures were treated with 0.1% DMSO (C) or 10 nM TCDD (T) for 24 h prior to microsomal isolation. Immunoblot analyses were completed on two separate blots, visualized with ECL detection. Purified CYP1A1 (2 ng/lane) expression servs as a standard, in common with both membranes, and a normalizing control.
Fig. 2
Fig. 2
Experimental design for the analysis of BMS2 cells as a model for CYP1B1 participation of the BM microvascular niche MSC. These studies utilize three approaches: 1. Characterization of the selectivity of gene responses to DMBA and BP, in vivo, from rapidly isolated adherent BM cells and in cultured BMS2 cells. 2. Examination of the AhR regulation of CYP1B1 expression in BMS2 cells, with respect to their high basal expression and low PAH-mediated induction. 3. Examination of the overlap of mRNA profiles between BMS2 cells, adherent BM populations and the recently reported, single cell clustering of Lepr+MSC populations.
Fig. 3
Fig. 3
Direct PAH and metabolite-mediated gene expression changes and p53 activation in BMS2 cells. A. qPCR analysis of gene expression changes induced by DMBA (1 uM, over 24 h) treatment in 4 canonical AhR-responsive genes: CYP1A1, CYP1B1, Aldh3a1, and Tiparp. Basal (0 h) microarray expression levels are normalized to 1, as indicated. B. qPCR analysis of the expression time course of 4 metabolism-mediated stress response genes with DMBA treatment: Ptgs2, Cxcl10, Cdkn1a/p21 and Ccng1/cyclin G1. Cells were treated with 1 uM DMBA over a 24 h period. Basal (0 h) microarray expression levels are normalized to 1, as indicated. C. DMBA PAH selectivity in BMS2 cells. Gene expression responses were measured after 24 h treatment by DMBA (1 uM) and BP (1 uM), in comparison to the 8 h TCDD (10 nM) response. Significance (*) was defined as p < .05 relative to DMSO control. D. Heat maps showing hierarchical cluster analysis of PAH responses in BMS2 cells. Genes are presented relative to their selective response to DMBA (left) and BP treatment (right). Red indicates upregulation (FC>2), green indicates down regulation (FC<-2). Genes are listed to the right, the corresponding relative clustering response hierarchical diagram to the left. Treatment columns are, from left to right: DMSO vehicle control (C), BP (B; 1 M; 24 h), DMBA (D; 1 M; 24 h) and TCDD (T; 10 nM; 8 h). Treatments were completed in triplicate. Only genes with expression differences, p-values<0.05 and Cy5-values >100 were analyzed. E. In cell western analysis of BMS2 cells show significant p53 phosphorylation in response to 24h PAH treatment. Top: a representative fluorescence image of PAH-mediated p53 and H2AX phosphorylation obtained in the high throughput 96-wellplate assay. BP (left) and DMBA (right) significantly activate p53 phosphorylation in BMS2 cells. Significance (*) was defined as PAH-mediated fold change p<0.05 relative to DMSO vehicle control.
Fig. 4
Fig. 4
Analysis of basal and TCDD-induced expression of the transfected CYP1B1-AhER luciferase reporter in the BMS2 cell line. A. Diagram of the XRE elements in the CYP1B1-AhER promoter and of the CYP1B1-AhER constructs investigated. B. Western immunoblot analysis of CYP1B1 protein expression in BMS2 total cell lysates. CYP1B1 expression (arrow) was analyzed in duplicate samples following 24 h TCDD-induction and 3′-methoxy-4′-nitroflavone (MNF) inhibition. A non-specific background band (top) serves as a loading control reference. C. MNF inhibits TCDD induction (2-fold) of the AhER reporter in BMS2 cells, and further reduces basal expression up to 3-fold in transfected BMS2 cells. D. Mutations in the AhER construct indicate that both Ebox and XRE4 elements play critical roles in the TCDD (1 nM)-mediated induction of luciferase reporter expression, above vehicle control, suppressing induction in BMS2 transfected cells
Fig. 5
Fig. 5
Increased cell density stimulates basal CYP1B1 expression in BMS2 cells, in parallel with increased Cxcl12 expression. A. Effect of cell density on basal and TCDD-induced activities of AhER/0.2 (AhER) and 4XRE5 reporters at different cell densities (50–100% of confluence) in BMS2 cells. The cells were transfected and then plated at the indicated densities. Cells were treated with TCDD (1 nM) or solvent control (DMSO) for 24 h prior analysis of luciferase activity. B. Expression (relative to β-actin) of basal and TCDD-induced (10 nM) CYP1B1 and CYP1A1 mRNA in BMS2 cells plated at approximately 50 and 80% of confluence and cultured for 6- and 24 h. Statistical significance: **p < .01, ***p < .001 for high relative to low density culture. C. Effects of co-culture of BMS2 and C3H10T1/2 cells on their respective basal and TCDD-induced activities. Each cell type was transfected with AhER/0.2 (AhER-SP1) and plated at 80% of confluence in separate compartments that allowed effective media exchange. Each line was also plated in both compartments (two controls). During the 24 h co-culture, the cells were separately stimulated with either TCDD (10 nM) or DMSO (solvent control) prior to analysis of luciferase activities. Significance (*) was defined as p < .05 for TCDD treatment as compared to the respective DMSO control. D. Expression of basal Cxcl12 and Csf1 (relative to β-actin) at 50 and 80% of confluent cell density. Statistical significance: ** p < .01 for high density relative to low density culture.
Fig. 6
Fig. 6
Matrix proteins and secreted regulatory proteins expressed in BMS2 cells correlate with adherent BM cell expression. A. Expression of key MSC regulatory factors in BMS2 cells (Cy3) and adherent BM, (percent of BMS2; Supplement Excel file). B. Correlation of mRNA expression for key MSC regulatory factors in BMS2 cells and in adherent BM cells, at equivalent mitochondrial mRNA (mrpl10) and GAPDH expression. C. Effects of in vitro DMBA (1 uM) treatment (12h) on adherent select core factors (left) and the three principle DMBA targets (middle) with reference standards, GAPDH and Mrpl10 (right). Statistical significance: *p < .05, **p < .01, ***p < .001 for DMBA treatment relative to basal expression.
Fig. 7
Fig. 7
Two Reaction Paths for PAHs lead to opposing effects on HSPC in the BM vascular niche. Metabolites produced by CYP1B1 and CYP1A1 direct these effects. Path A, typified by DMBA, HSPC suppression. CYP1B1 and Ephx1 (microsomal epoxide hydrolase) provide a concerted three step metabolism to generate 3,4-dihydrodiol-1,2-epoxide isomers (PAHDE), marked by DNA adducts in MSC and adjacent pre-B cells (Heidel et al., 2000). These DNA reactions cause DNA DSB, recognized by rapid activation of ATM kinase and p53 phosphorylation. Hypothesis: p53 activation in MSC and attached HSPC in the vascular niche directly effects apoptosis lineage suppression. PAH dihydrodiols are also converted to PAH ortho-quinones via AKR dehydrogenase that also cause DSB. Evidence for their participation in MSC remains to be shown. Environmental PAH share, with synthetic DMBA, structurally restrained, but more reactive PAHDE, including dibenzo(a,l)pyrene (Fjord ring configuration). Path B, Typified by BP, HSPC protection. CYP1A1, which is induced rapidly to high levels in liver, generates 10% of a mix of BP quinones that are highly active in redox cycling to ROS. BP, in combination with AhR induction, generates very high levels of Il1b and other macrophage inflammatory cytokines (Tnf) that activate their specific MSC receptors. The activation is marked by parallel responses induced by Il1b in MSC (Cxcl1, Il6). Il1b stimulates MSC proliferation responses that protect these cells from stress damage. Hypothesis:Il1b mediates early changes that diminish apoptosis in HSPC. Many PAH undergo 1e- oxidation at CYP1A1 (for example, benz(a)anthracene), but have low AhR inducing activity. Mice have two types of AhR. Inducible b-type (C57Bl/6 mice) and resistant d–type (DBA and 129 strains) in which liver CYP1A1 is very low. BP then functions like DMBA with exclusive CYP1B1-mediated suppression (N'Jai A et al., 2011).
Fig. 8
Fig. 8
Differential AhR Regulation of CYP1B1 and CYP1A1 in BMS2 cells directs selective activation of p53 by DMBA. BMS2 cells show high AhR-mediated basal CYP1B1 expression and low induction by TCDD and PAHs. Basal CYP1A1 is undetectable, but highly inducible (40% of CYP1B1). Co-culture of BMS2 with C3H10T1/2 cells cause crossover stimulation of basal CYP1B1 in C3H10T1/2 cells, indicative of BMS2 release of secreted paracrine factors (SF) that stimulate C3H10T1/2 cells. Cell density effects suggest that SF contribute to the high basal CYP1B1 in BMS2 cells. Table 5 lists 40 candidate SFs (examples in yellow box). SF bind receptors (SFR) to transmit intracellular signaling. SF/SFR pairs include PDGFa/Pdgfrb, Fg7/Fgfr2 and Hgf/Met, which activate MEK-Erk kinases, that in turn phosphorylate and thereby activate SP1. Wnt2/Frz1 activates β-catenin, which can partner AhR. This endogenous SF/SFR mechanism is selective for CYP1B1, in part because of weaker SP1 promoter site in CYP1A1. Exogenous AhR/ARNT canonical activation by exogenous agonists (purple box) supplements constitutive activation. Paracrine signaling to CYP1B1 differs appreciably in C3H10T1/2 cells, consistent with changes in CYP1B1 that directly activates DMBA to 3,4 dihydrodiol, and subsequently to the PAHDE that forms DNA adducts. PAHDE transfer rapidly to HSPC to directly suppress their replication within 6 h. Ensuing DSBs activate ATM-kinase, which phosphorylates p53, producing slower gene transcription changes (>8 h). CYP1A1 induction by BP additionally generates BP quinones (BP-Q) that do not form directly from DMBA. BP-Q inhibit both CYP1B1 and CYP1A1, thereby slowing PAHDE synthesis.

Similar articles

Cited by

References

    1. Agarwala S., Tamplin O.J. Neural crossroads in the hematopoietic stem cell niche. Trends Cell Biol. 2018;28(12):987–998. - PMC - PubMed
    1. Alexander D.L., Eltom S.E., Jefcoate C.R. Ah receptor regulation of CYP1B1 expression in primary mouse embryo-derived cells. Cancer Res. 1997;57(20):4498–4506. - PubMed
    1. Amann E.M. Inflammatory response of mesenchymal stromal cells after in vivo exposure with selected trauma-related factors and polytrauma serum. PLoS One. 2019;14(5) - PMC - PubMed
    1. Andrae J., Gallini R., Betsholtz C. Role of platelet-derived growth factors in physiology and medicine. Genes Dev. 2008;22(10):1276–1312. - PMC - PubMed
    1. Beedanagari S.R. Role of epigenetic mechanisms in differential regulation of the dioxin-inducible human CYP1A1 and CYP1B1 genes. Mol. Pharmacol. 2010;78(4):608–616. - PMC - PubMed

Publication types

Substances