. 2020 Jun 26;23(6):101229.
doi: 10.1016/j.isci.2020.101229. Epub 2020 Jun 2.

Integrating Systems Biology and an Ex Vivo Human Tumor Model Elucidates PD-1 Blockade Response Dynamics

Affiliations

Integrating Systems Biology and an Ex Vivo Human Tumor Model Elucidates PD-1 Blockade Response Dynamics

Munisha Smalley et al. iScience. .

Abstract

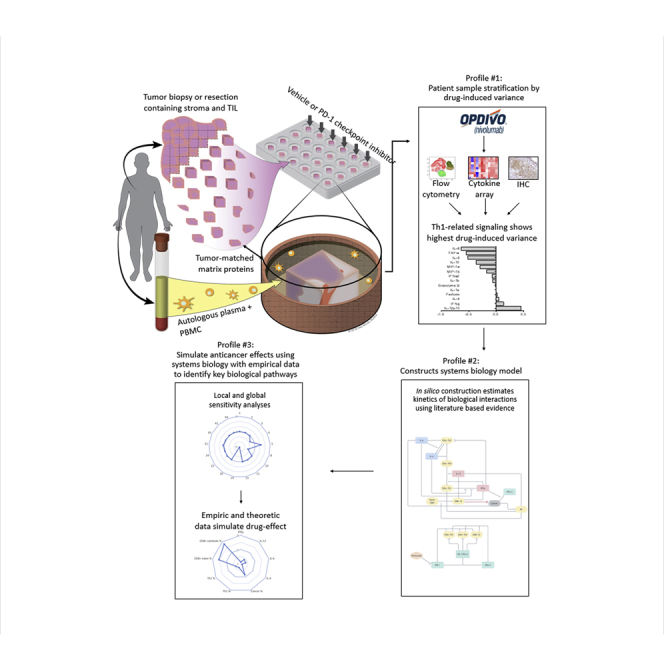
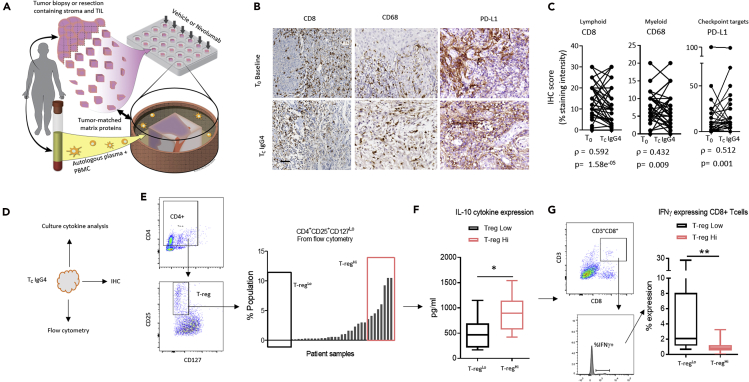
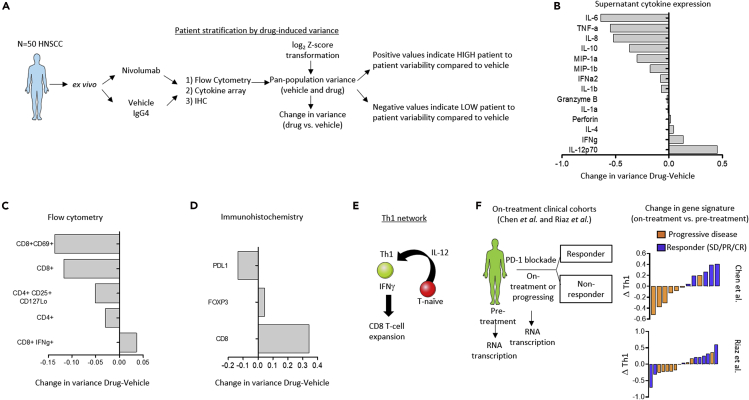
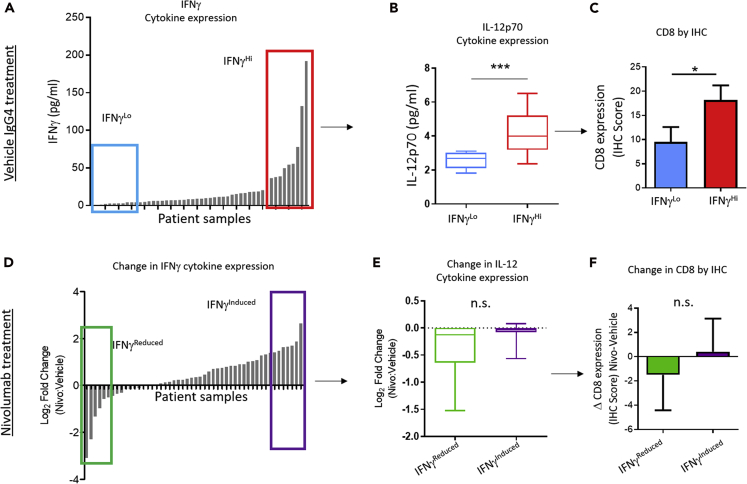
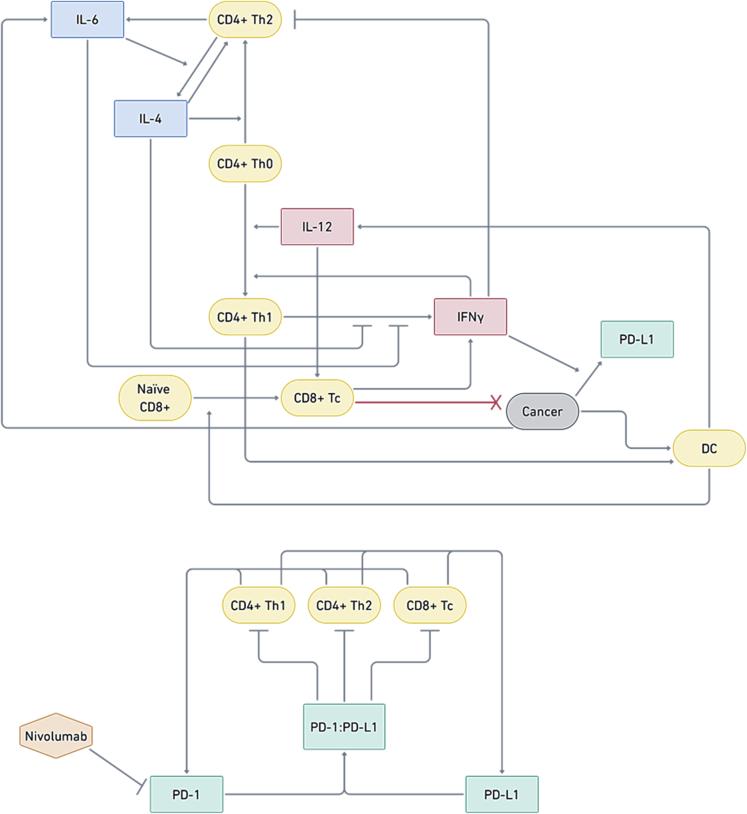
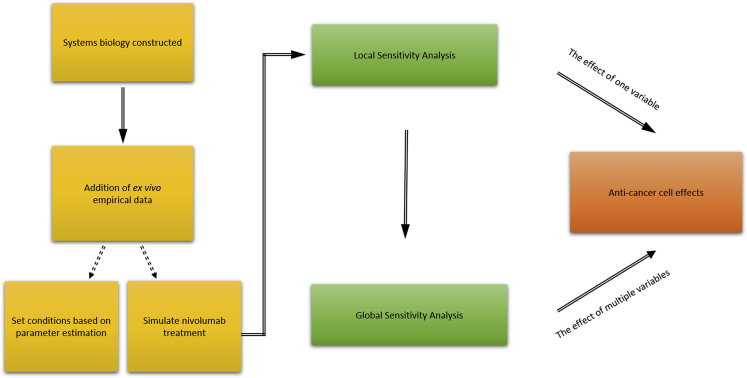
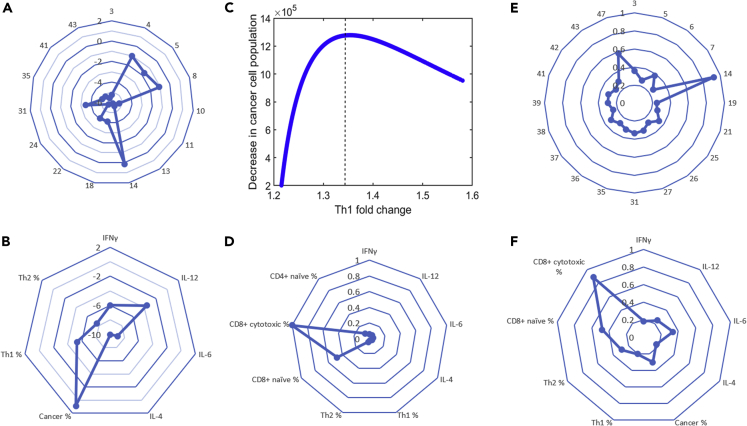
Ex vivo human tumor models have emerged as promising, yet complex tools to study cancer immunotherapy response dynamics. Here, we present a strategy that integrates empirical data from an ex vivo human system with computational models to interpret the response dynamics of a clinically prescribed PD-1 inhibitor, nivolumab, in head and neck squamous cell carcinoma (HNSCC) biopsies (N = 50). Using biological assays, we show that drug-induced variance stratifies samples by T helper type 1 (Th1)-related pathways. We then built a systems biology network and mathematical framework of local and global sensitivity analyses to simulate and estimate antitumor phenotypes, which implicate a dynamic role for the induction of Th1-related cytokines and T cell proliferation patterns. Together, we describe a multi-disciplinary strategy to analyze and interpret the response dynamics of PD-1 blockade using heterogeneous ex vivo data and in silico simulations, which could provide researchers a powerful toolset to interrogate immune checkpoint inhibitors.

Keywords: Biological Sciences; Cancer Systems Biology; Immunology; Systems Biology.


Conflict of interest statement

Declaration of Interests S.T., B.M., P.M., A.G., M.S., M.J., B.U.S., V.K., D.D., N.B., and G.T.-O. declare conflicts of interest as employees or consultants and/or holding equity in Mitra Biotech. All other authors declare no conflicts of interest. Patent applications have been filed by Mitra Biotech on behalf of authors A.G., B.M., and P.M. related to the research in this study.

Figures

None
Graphical abstract
Figure 1
Figure 1
Profiling Spatiotemporal Immune Fidelity Ex Vivo, Comparing T0 with Unstimulated Vehicle Control (TCIgG4) (A) Schematic of the ex vivo tumor model. Surgically resected or biopsied tumor tissue is obtained along with patient-matched whole blood (i.e., time 0 h, T0). Following manual fragmentation, tissue is plated into individual tissue culture wells coated with indication- and grade-matched tumor matrix proteins along with autologous serum and peripheral blood mononuclear cells. Vehicle control or nivolumab was introduced to culture and interrogated for either 48 or 72 h (Tc). Illustration by Wendy Chadbourne, 2018, Inky Mouse Studios, www.inkymousestudios.com. (B) Representative bright-field image from immunohistochemistry of three unique patient samples matching between T0 and Tc. Scale bar, 40 μm. (C) Pairwise, Spearman correlation analysis was performed using IHC pathology scores of CD8, CD68, and PD-L1 between T0 and TC. Spearman rho was calculated to determine correlation between the two time points. p Value <0.05 indicates the correlation is statistically significant. (D) Schematic shows the different phenotypic response assays that are employed to study tumor phenotype and culture media during the ex vivo culture. (E) Flow cytometry was used to quantify the regulatory T cell (T-reg) population in all patient tumor samples. Right panel plots the percentage of T-regs in the total population. Boxes indicate the highest and lowest T-reg expressing patient samples (T-regHi and T-regLo). (F) Box and whisker plot quantifies the IL-10 protein expression from the tissue culture media (pg/mL), determined by Luminex, in T-regHi and T-regLo patient samples (see [E]) ∗p < 0.05 by Mann-Whitney U test. (G) Box and whisker plot shows the percent expression of IFNγ in CD8+ T cells determined by flow cytometry in T-regHi and T-regLo patient samples, which were grouped from (E), ∗∗p < 0.01 by Mann-Whitney U test. See also Figure S1 contains patient demographic data.
Figure 2
Figure 2
Drug-Induced Patient Variance as a Method to Stratify Heterogeneous Samples Pin Points a Role for the Th1-Related Pathway (A) Schematic shows analysis workflow to determine drug-induced variance. (B–D) Waterfall plots show the change in variance of cytokines, and gene and protein immune cell signatures in the vehicle control versus drug pressure from NanoString (A), flow cytometry (B), cytokine profiling (C), and immunohistochemistry (D). Calculation for variance can be found in the Transparent Methods section. Positive values indicate protein expressions that are more variable from patient to patient under nivolumab pressure compared with the vehicle control, i.e., the drug has the effect of creating high degree of phenotypic heterogeneity across all the patient samples. Negative values indicate those proteins signatures that are less variable across all patient samples under nivolumab pressure compared with the vehicle control, i.e., nivolumab has the effect of normalizing phenotype across patient samples relative to the vehicle. (E) Schematic shows the clinical study reported in Chen et al. and Riaz et al. (F) Waterfall plots show the measurable change of Th1 gene transcription signature in data obtained from Chen et al. and Riaz et al.
Figure 3
Figure 3
Th-1 Related Pathway Is Not Simultaneously Activated under Drug Pressure, Ex Vivo (A) Histogram shows IFNγ concentration (pg/mL) in the culture supernatant from the vehicle-treated cohort of all 50 patient samples determined as a mean expression at 24, 48, and 72 h culture. Boxes indicate patient samples that are stratified into the highest and lowest IFNγ expression (IFNγHI and IFNγLo). (B) Box plot shows IL-12p70 cytokine concentration in the culture media of IFNγHI and IFNγLo cohorts, ∗∗∗p < 0.001 by Mann-Whitney U test. (C) Histogram shows expression of CD8 in tumor tissue of IFNγHI and IFNγLo cohorts determined by IHC, ∗p < 0.05 by Mann-Whitney U test. (D) Waterfall plot shows log2 fold change in IFNγ concentration in culture media comparing nivolumab with vehicle IgG4. Colored boxes indicate the patient samples with the largest increase and decrease in IFNγ expression after PD-1 drug exposure (IFNγInduced and IFNγReduced, respectively). (E) Box plot shows IL-12p70 cytokine concentration in the culture media of IFNγInduced and IFNγReduced cohorts, n.s. indicates sample sets are not significantly different by Mann-Whitney U test. (F) Histogram shows expression of CD8 in tumor tissue of IFNγInduced and IFNγReduced cohorts determined by IHC, n.s. indicates sample sets are not significantly different by Mann-Whitney U test.
Figure 4
Figure 4
Systems and In Silico Strategy to Study Th1-Related Phenotypes in the PD-1/PD-L1 Network Systems biology model, illustrating interactions between cell populations, cytokines, and PD-1 and PD-L1. Naive CD4+ T helper cells (Th0) differentiate into CD4+ Th1 or CD4+ Th2 cells, which is influenced by Th1 cytokines (IL-12 and IFNγ) and Th2 cytokines (IL-4, IL-6). CD4+ Th1 cells influence the differentiation of naive CD8+ cells into CD8+ cytotoxic (Tc) T cells, which kill cancer cells. Cancer cells express PD-L1, which can bind to PD-1 expressed by CD4+ Th1, CD4+ Th2, and CD8+ Tc cells, thus inhibiting them.
Figure 5
Figure 5
Integrating Ex Vivo Data into In Silico Analysis Schematic showing the procedure to integrate nivolumab-treated ex vivo empirical evidences in silico for local and global sensitivity analyses.
Figure 6
Figure 6
Local Sensitivity Analyses (LSA) and Global Sensitivity Analyses (GSA) Integrate Th1-Related Phenotypes to Simulate Antitumor Effect of PD-1 Blockade (A) Relative sensitivities determined by LSA for the top 15 kinetic parameters (indicated by parameter number). (B) Relative sensitivities determined by LSA for initial cytokine levels and initial T cell populations. For (A) and (B), the Log10 of the absolute value of the relative sensitivities are presented for visual clarity. (C) Decrease in cancer cell population at t = 72 h with PD-1 blockade as a function of Th1 induction, obtained by changing only the initial cancer cell population. Initial cancer cell population comprises less than 75% of the tumor for points to the left of the dashed vertical line. (D) MPSA sensitivities determined by GSA for the initial protein levels and initial relative T cell populations. (E) MPSA sensitivities determined by GSA for the top 20 kinetic parameters (indicated by parameter number). (F) MPSA sensitivities determined by GSA for the initial cytokine levels and T cell populations. In (E) and (F), all protein levels, initial T cell populations, initial cancer cell population, and kinetic parameters were varied.

Similar articles

Cited by

References

    1. Athie-Morales V., Smits H.H., Cantrell D.A., Hilkens C.M. Sustained IL-12 signaling is required for Th1 development. J. Immunol. 2004;172:61–69. - PubMed
    1. Bandhary S.K., Shetty V., Saldanha M., Gatti P., Devegowda D., Pushkal S.R., Shetty A.K. Detection of human papilloma virus and risk factors among patients with head and neck squamous cell carcinoma attending a Tertiary Referral Centre in South India. Asian Pac. J. Cancer Prev. 2018;19:1325–1330. - PMC - PubMed
    1. Benson E., Li R., Eisele D., Fakhry C. The clinical impact of HPV tumor status upon head and neck squamous cell carcinomas. Oral Oncol. 2014;50:565–574. - PMC - PubMed
    1. Bertotti A., Trusolino L. From bench to bedside: does preclinical practice in translational oncology need some rebuilding? J. Natl. Cancer Inst. 2013;105:1426–1427. - PubMed
    1. Chen P.L., Roh W., Reuben A., Cooper Z.A., Spencer C.N., Prieto P.A., Miller J.P., Bassett R.L., Gopalakrishnan V., Wani K. Analysis of immune signatures in longitudinal tumor samples yields insight into biomarkers of response and mechanisms of resistance to immune checkpoint blockade. Cancer Discov. 2016;6:827–837. - PMC - PubMed

LinkOut - more resources