. 2020 Aug 14;295(33):11542-11558.
doi: 10.1074/jbc.RA120.013348. Epub 2020 Jun 18.

The polycomb proteins EZH1 and EZH2 co-regulate chromatin accessibility and nephron progenitor cell lifespan in mice

Affiliations

The polycomb proteins EZH1 and EZH2 co-regulate chromatin accessibility and nephron progenitor cell lifespan in mice

Hongbing Liu et al. J Biol Chem. .

Abstract

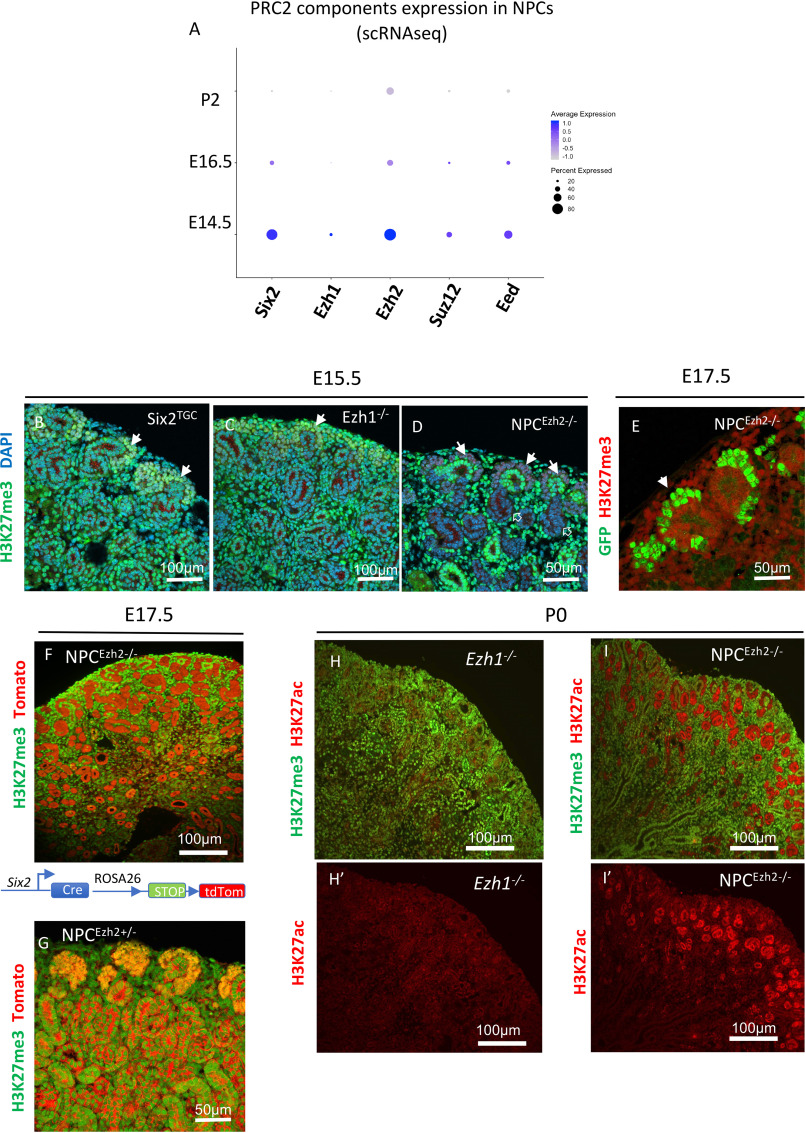
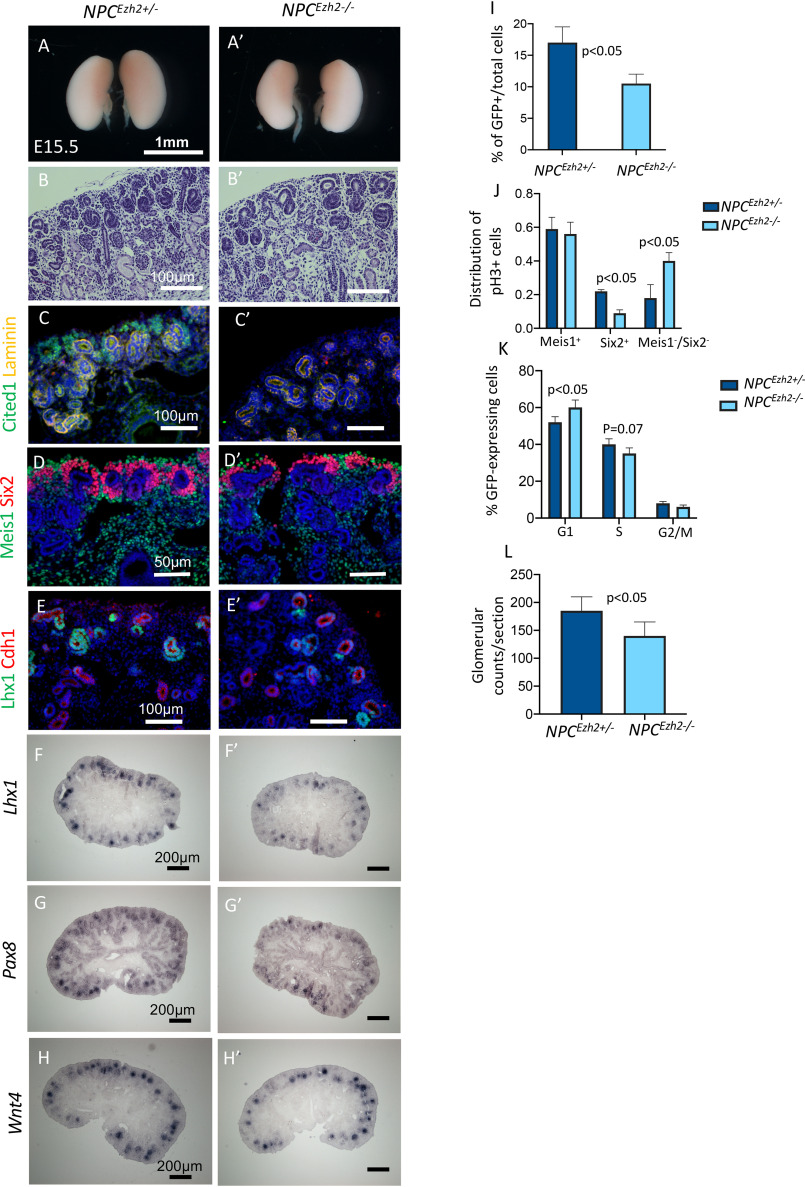
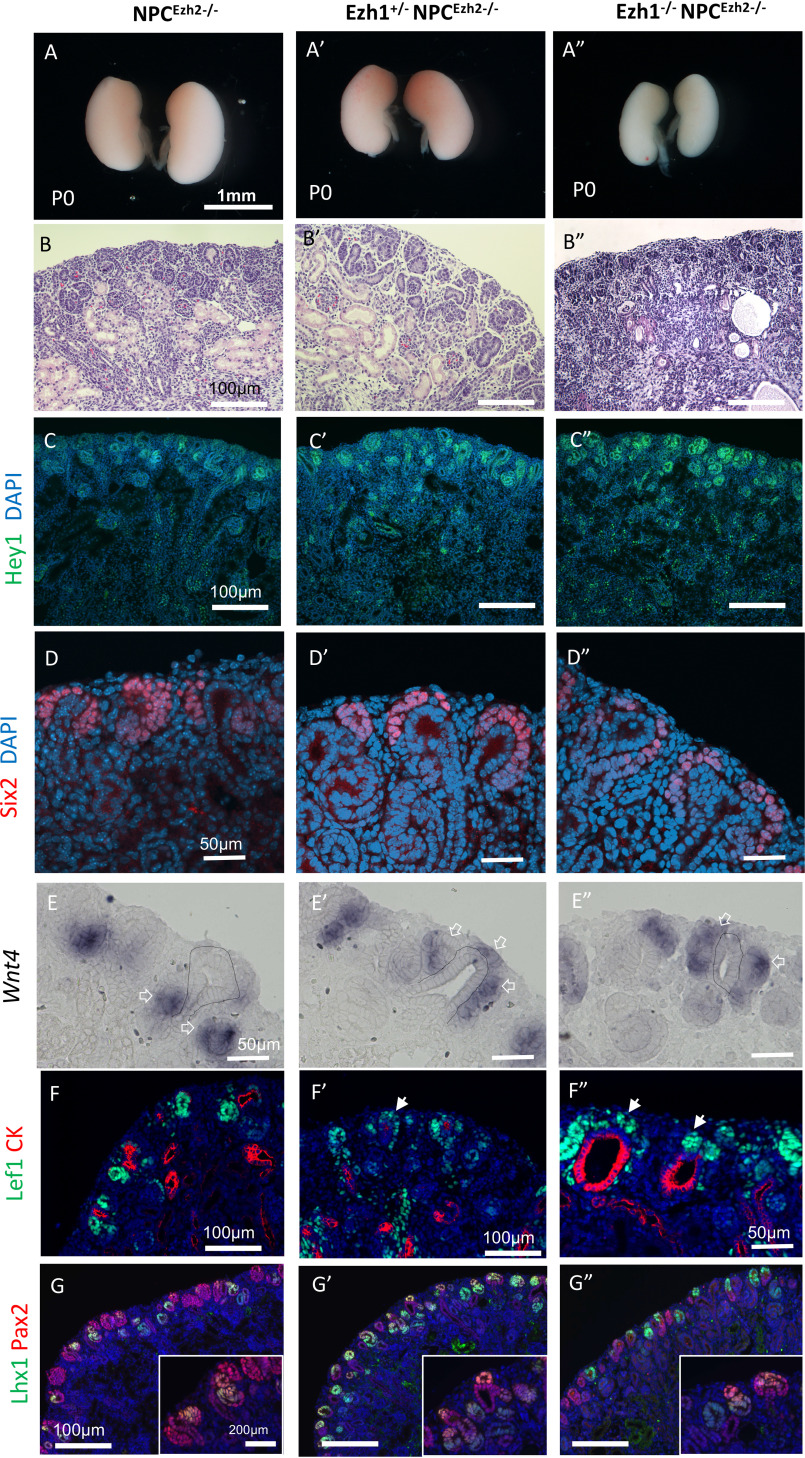
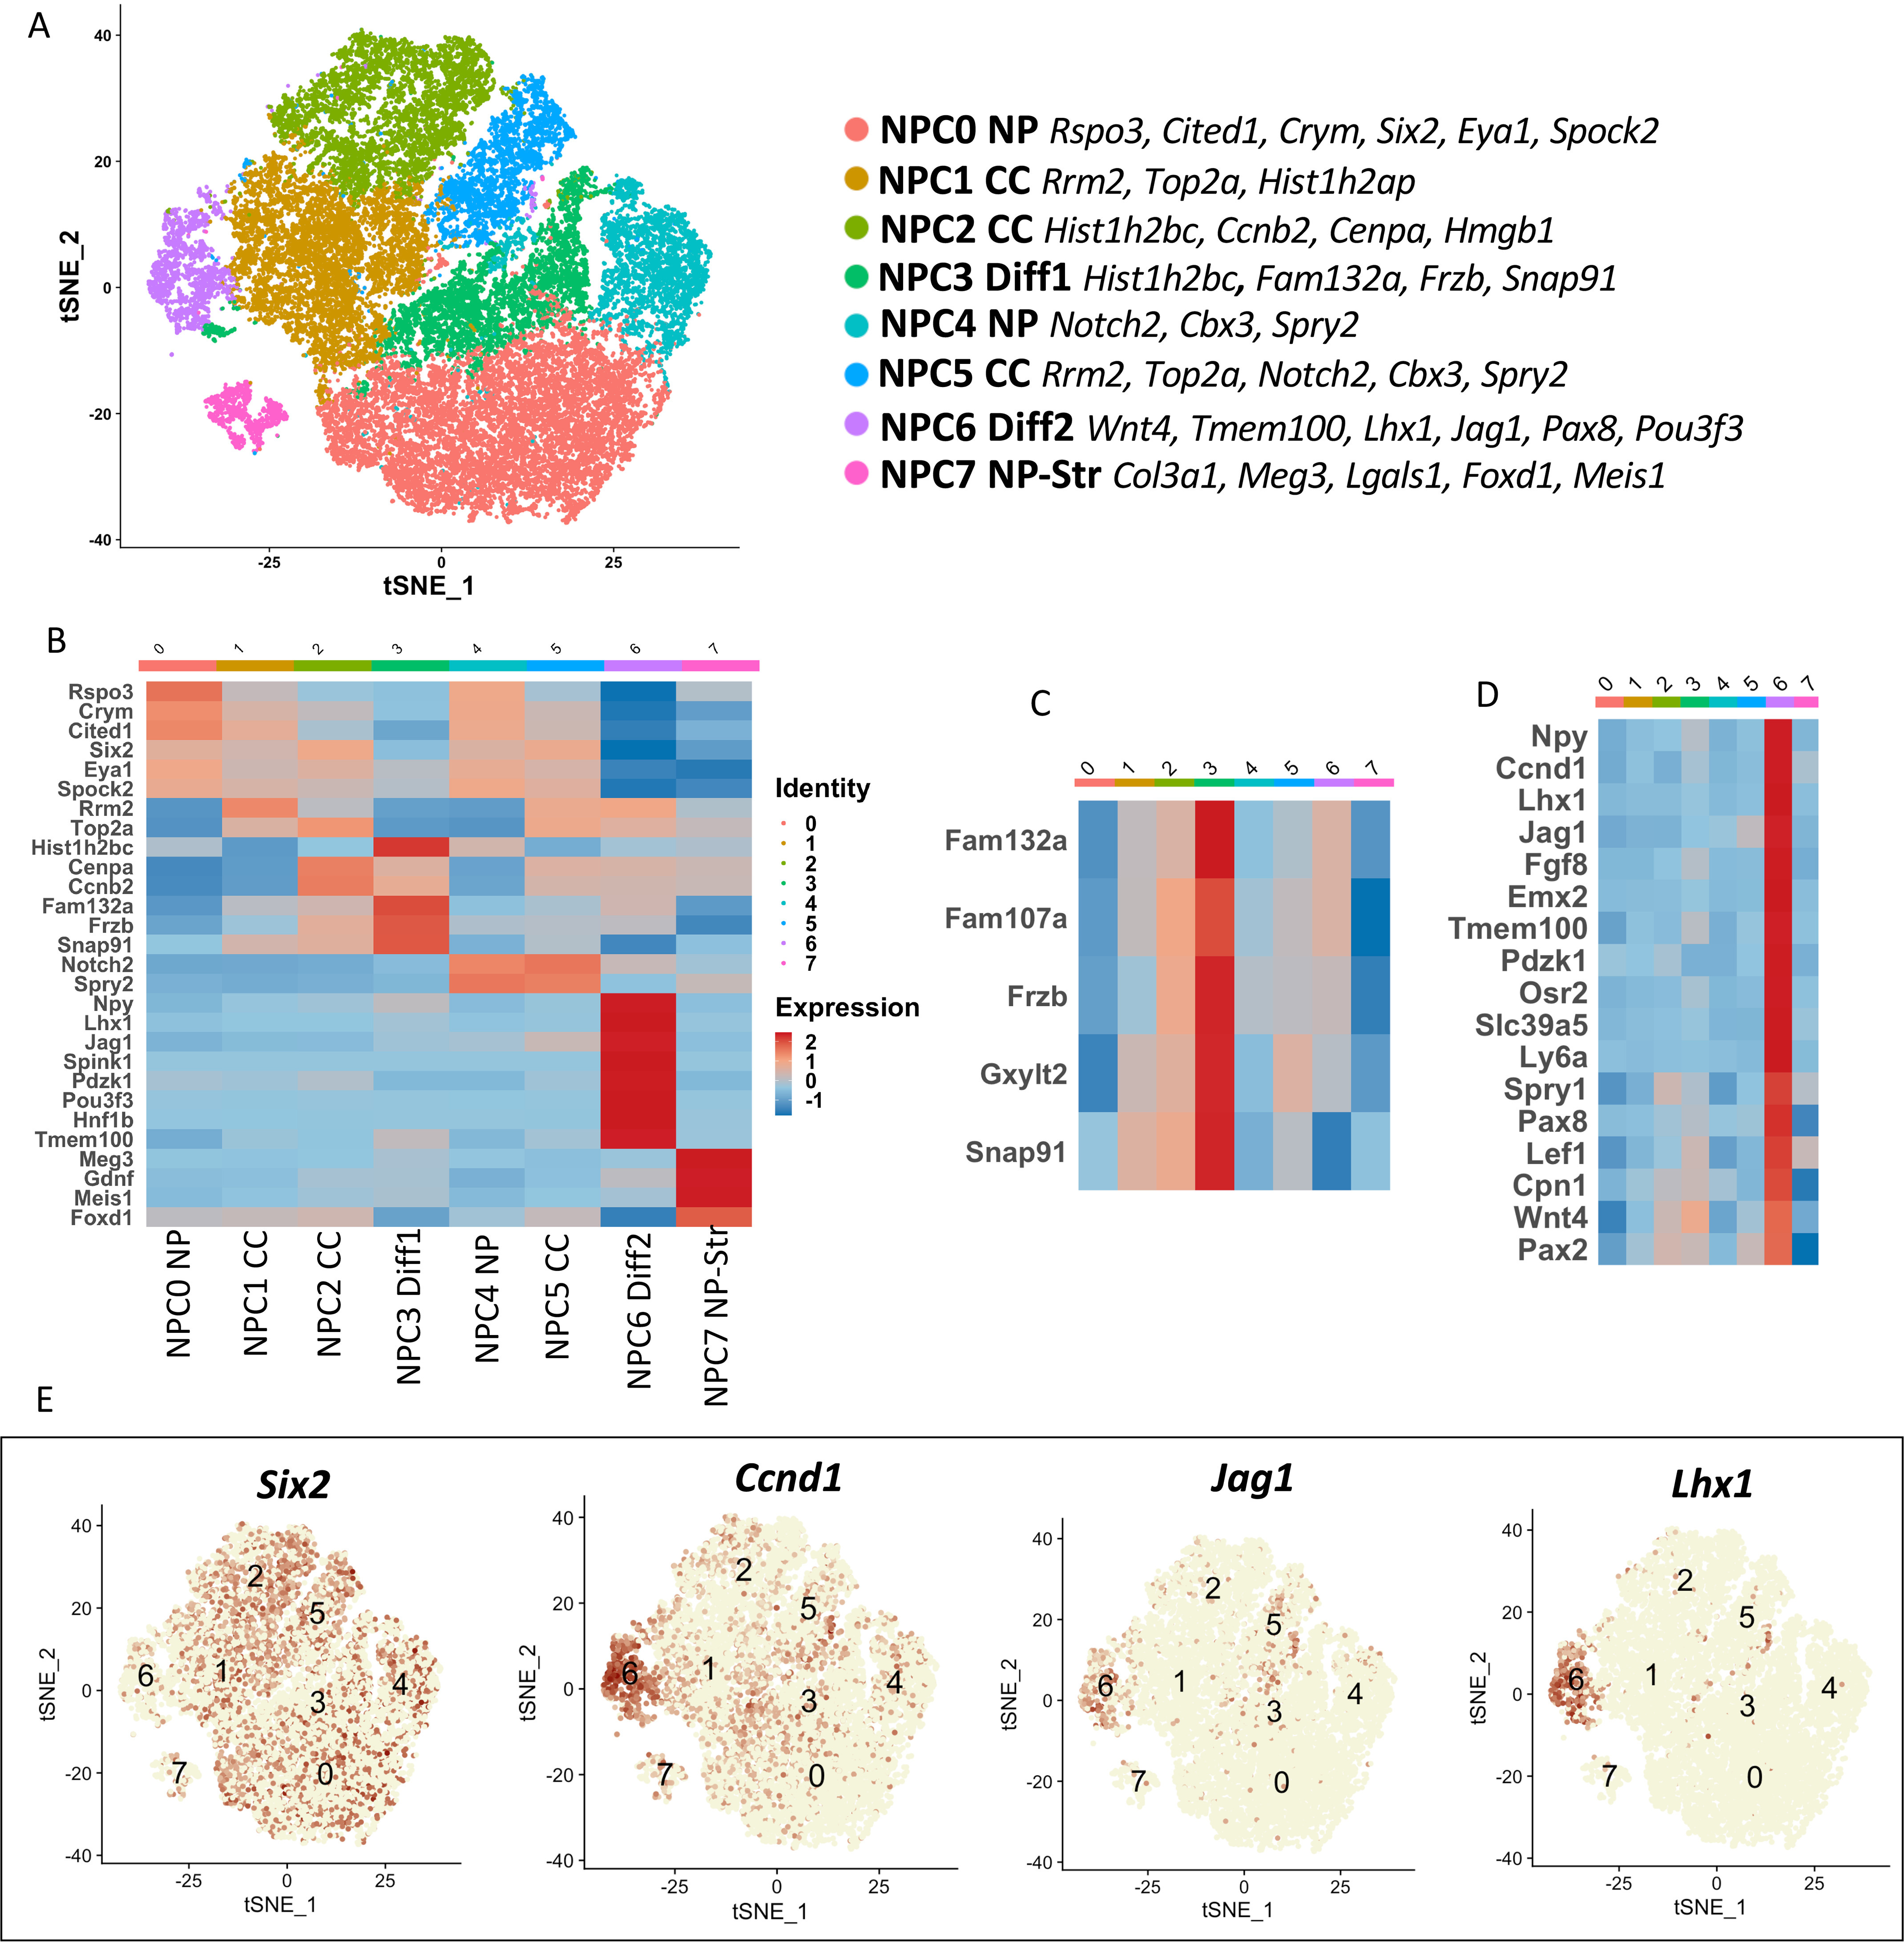
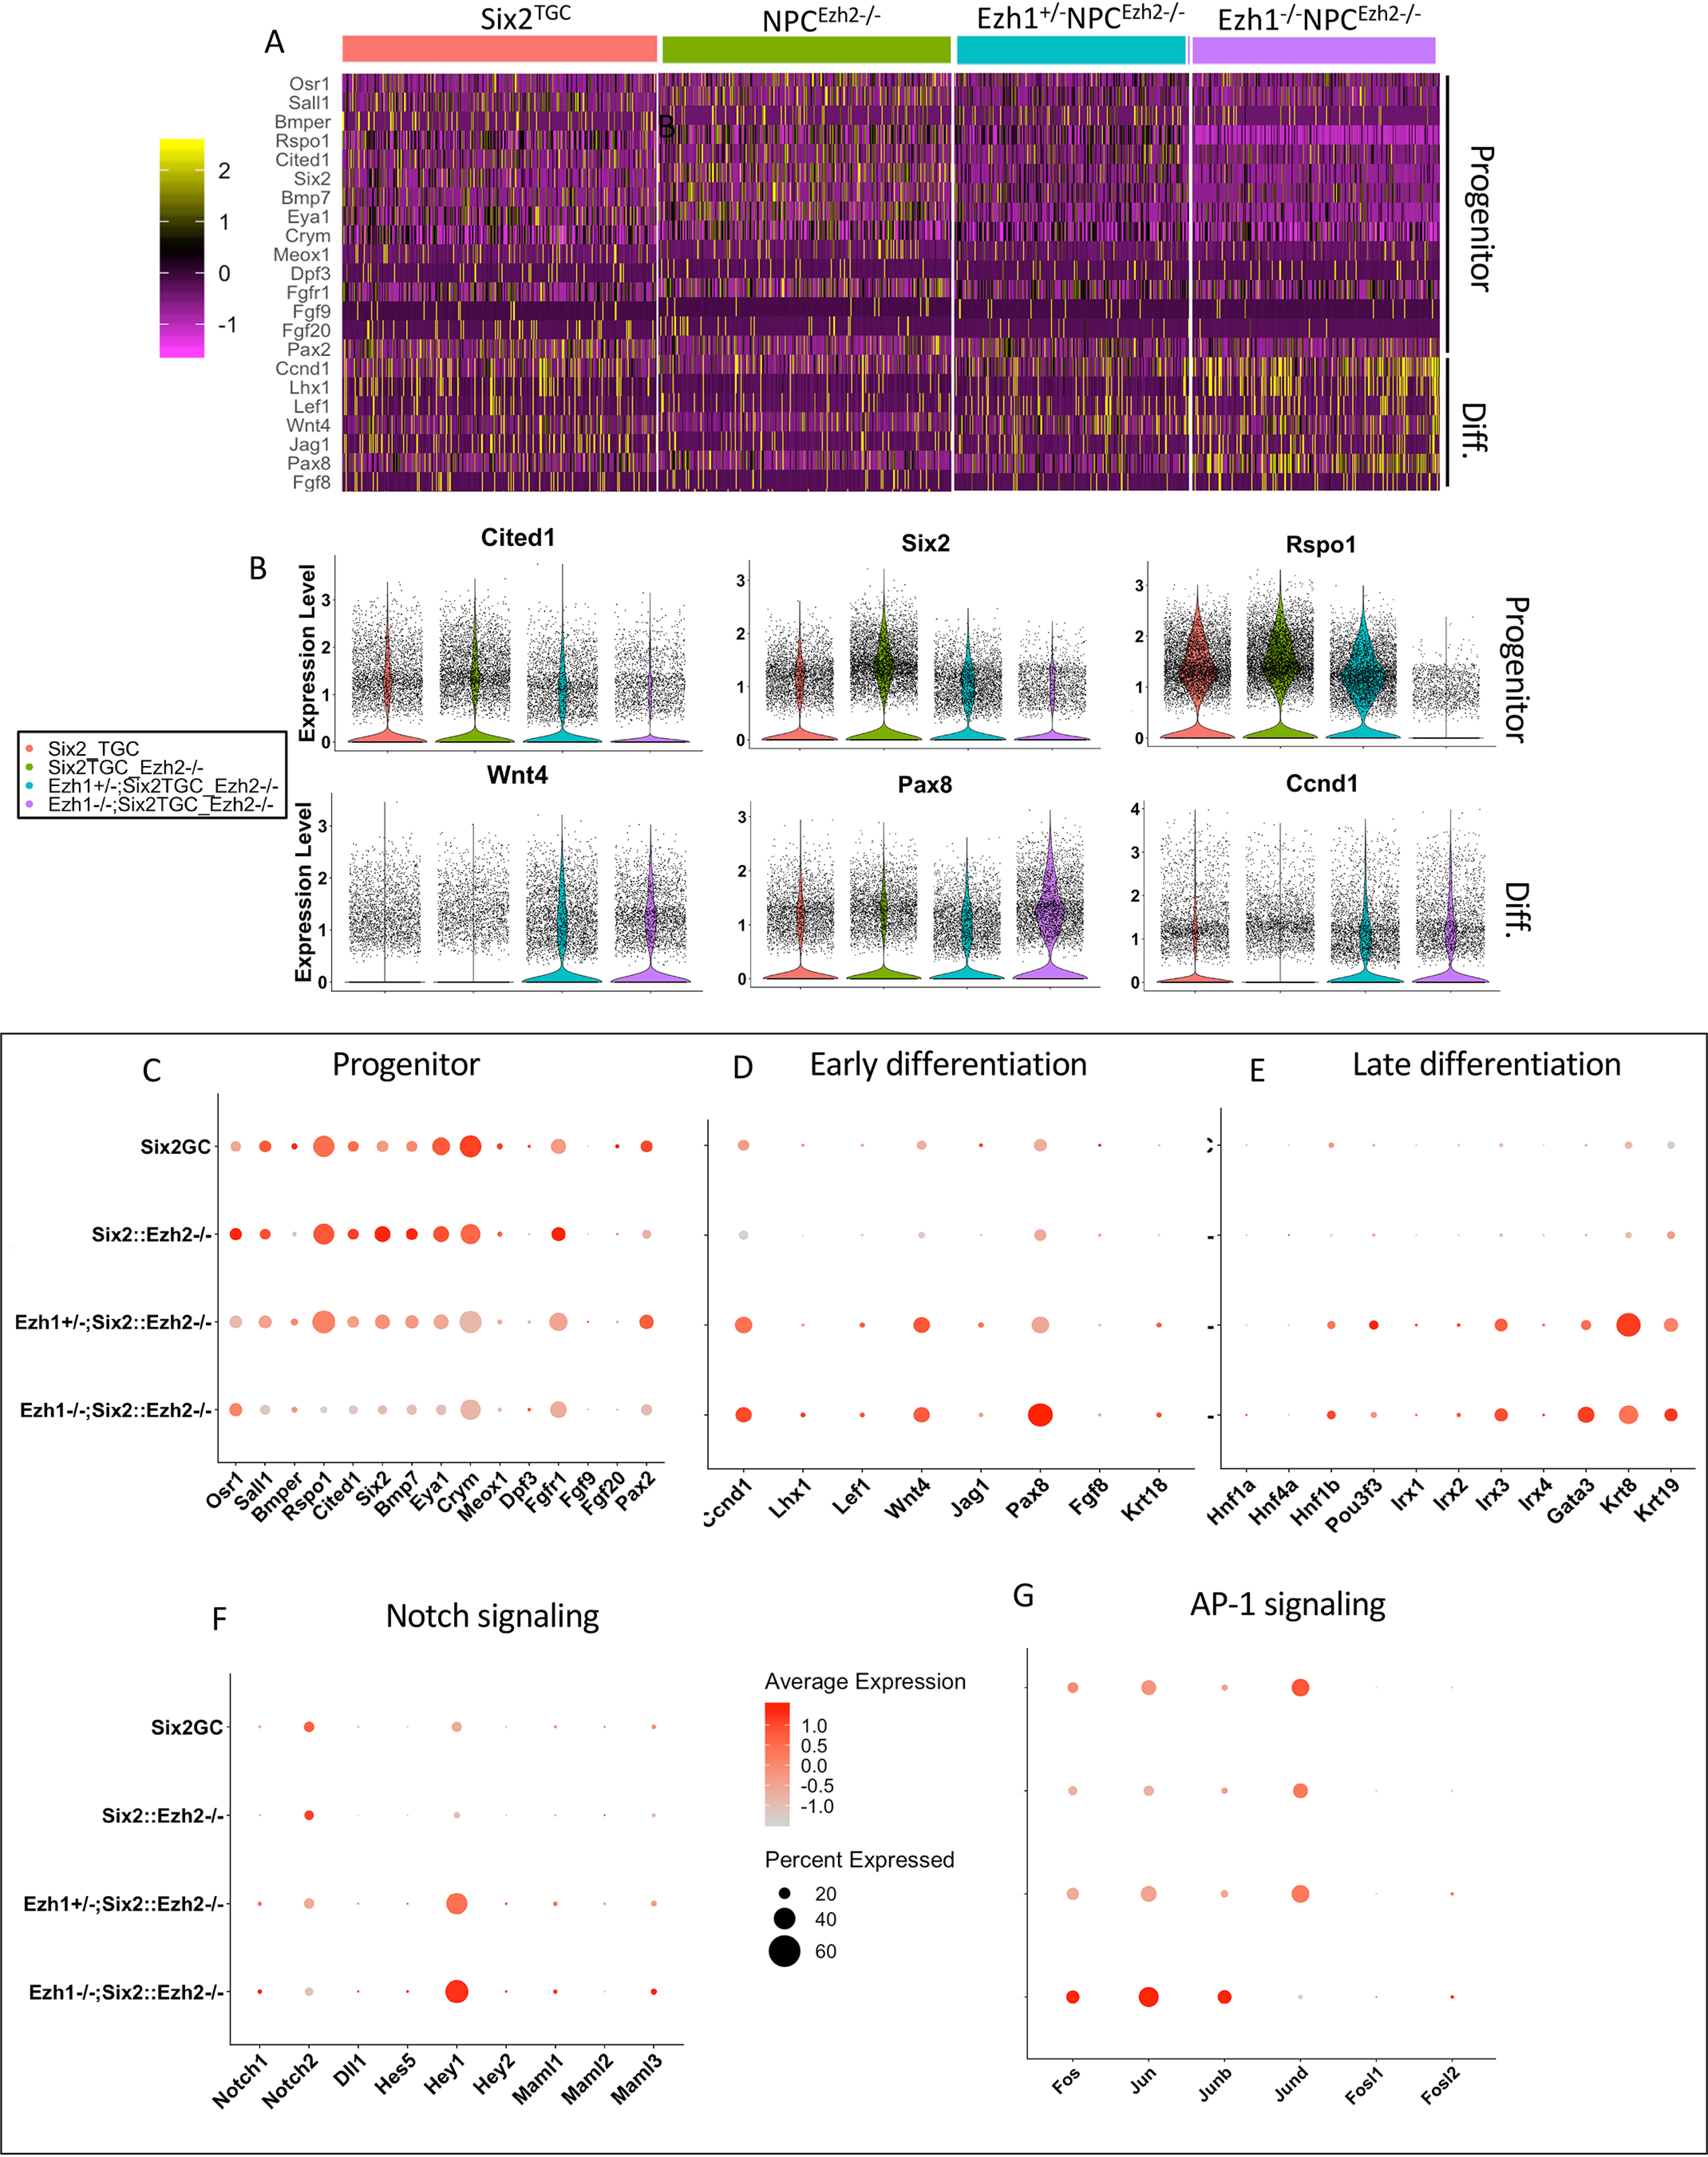
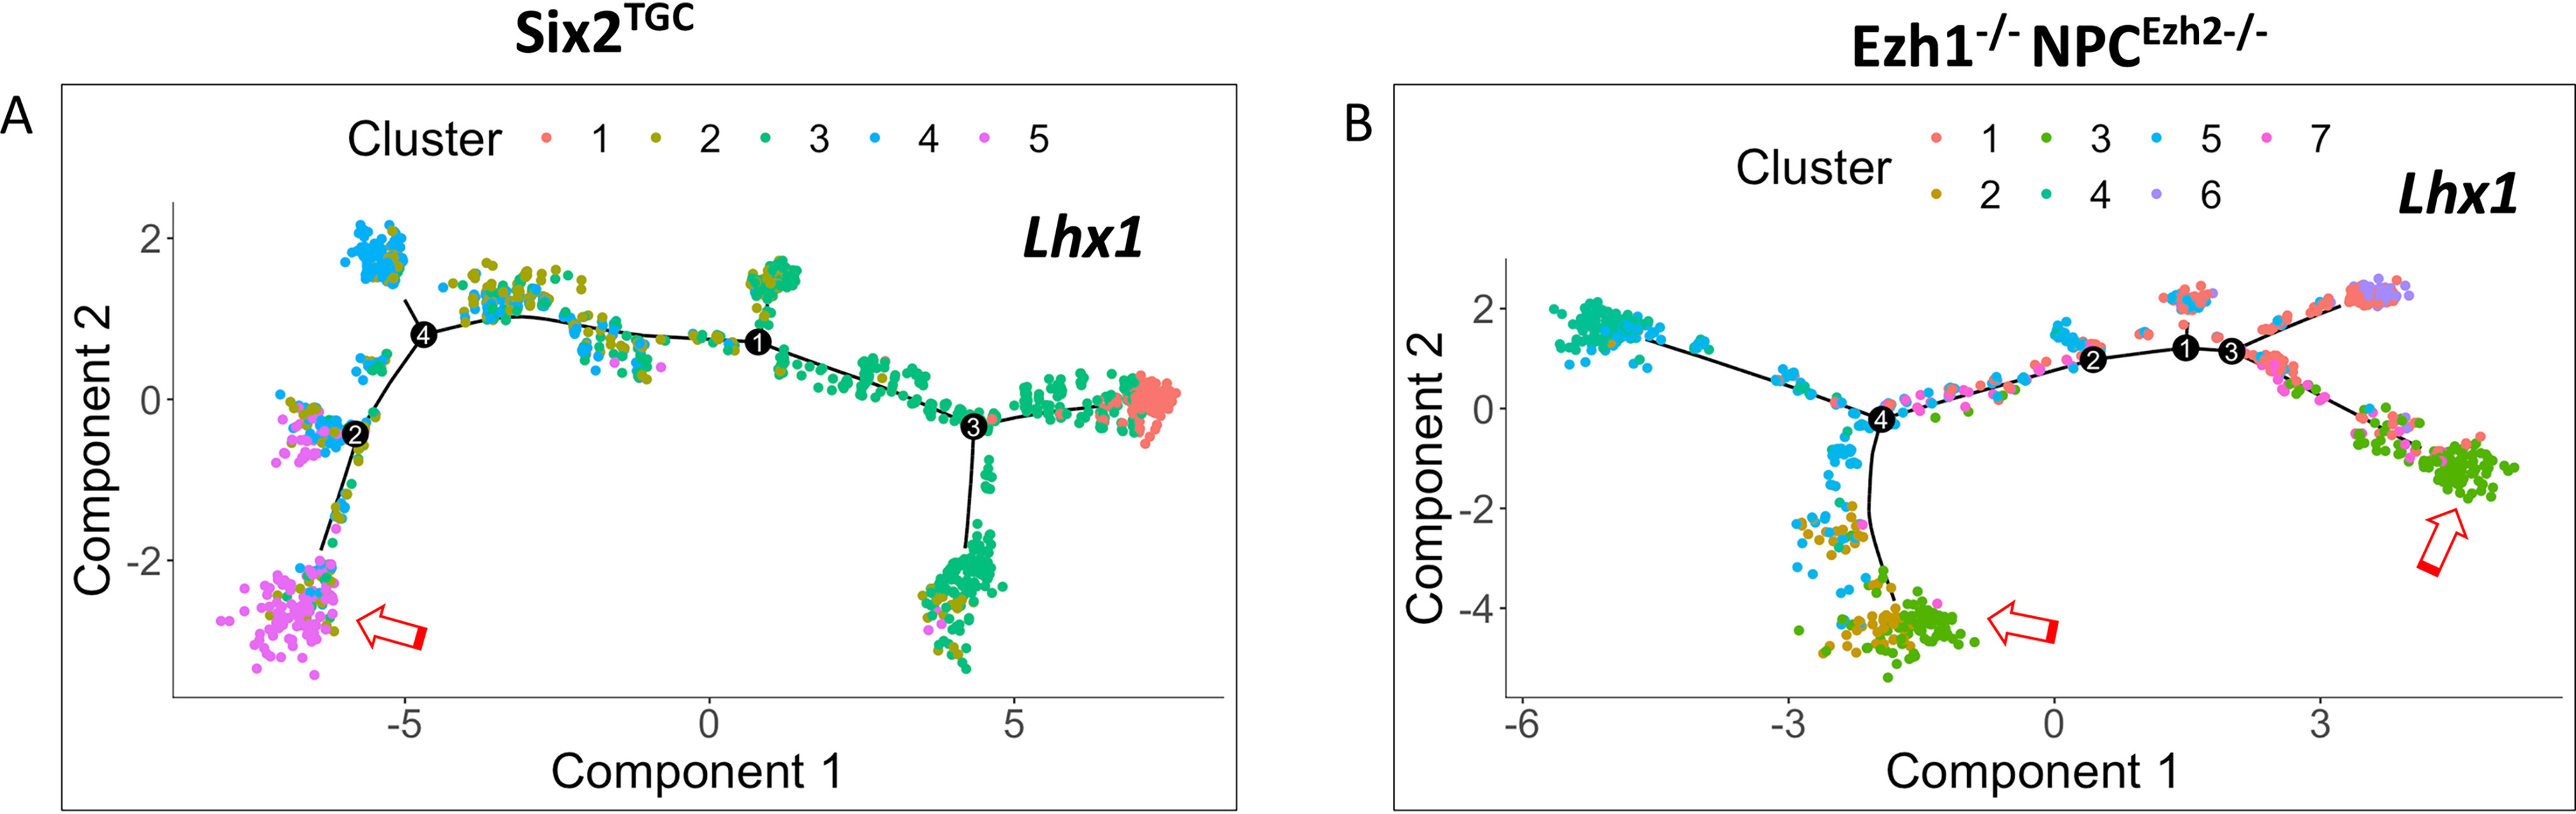
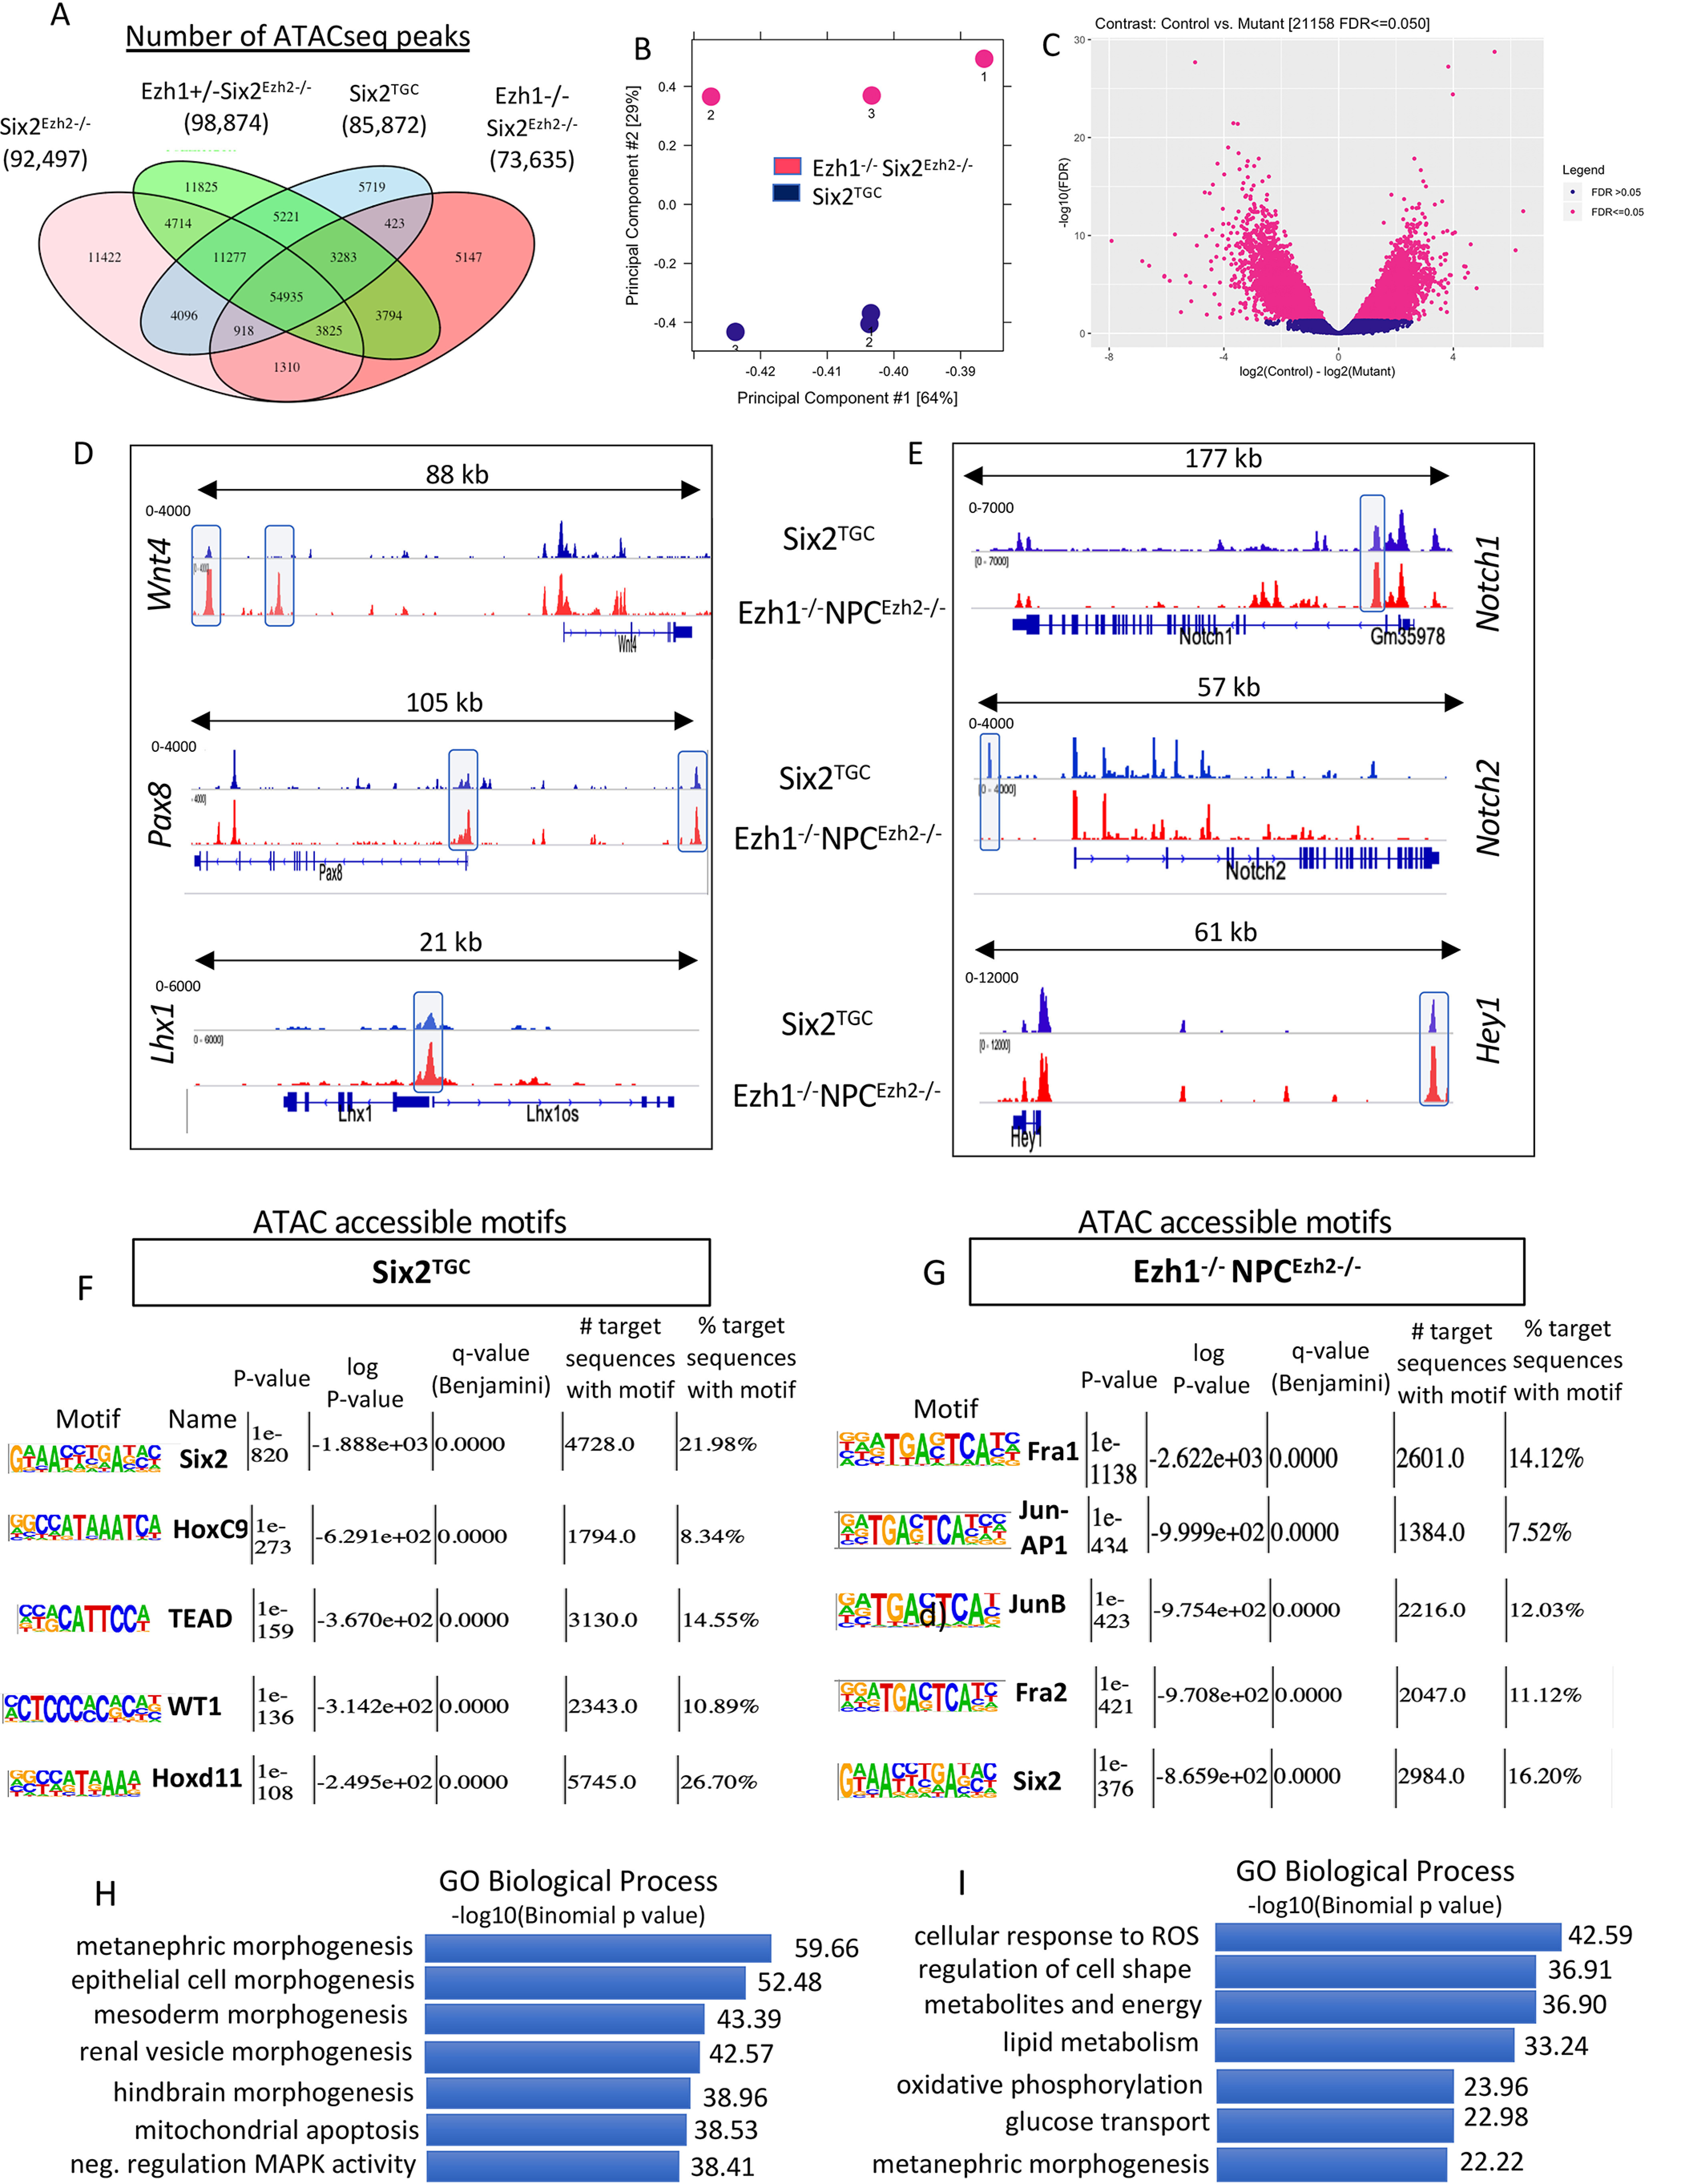
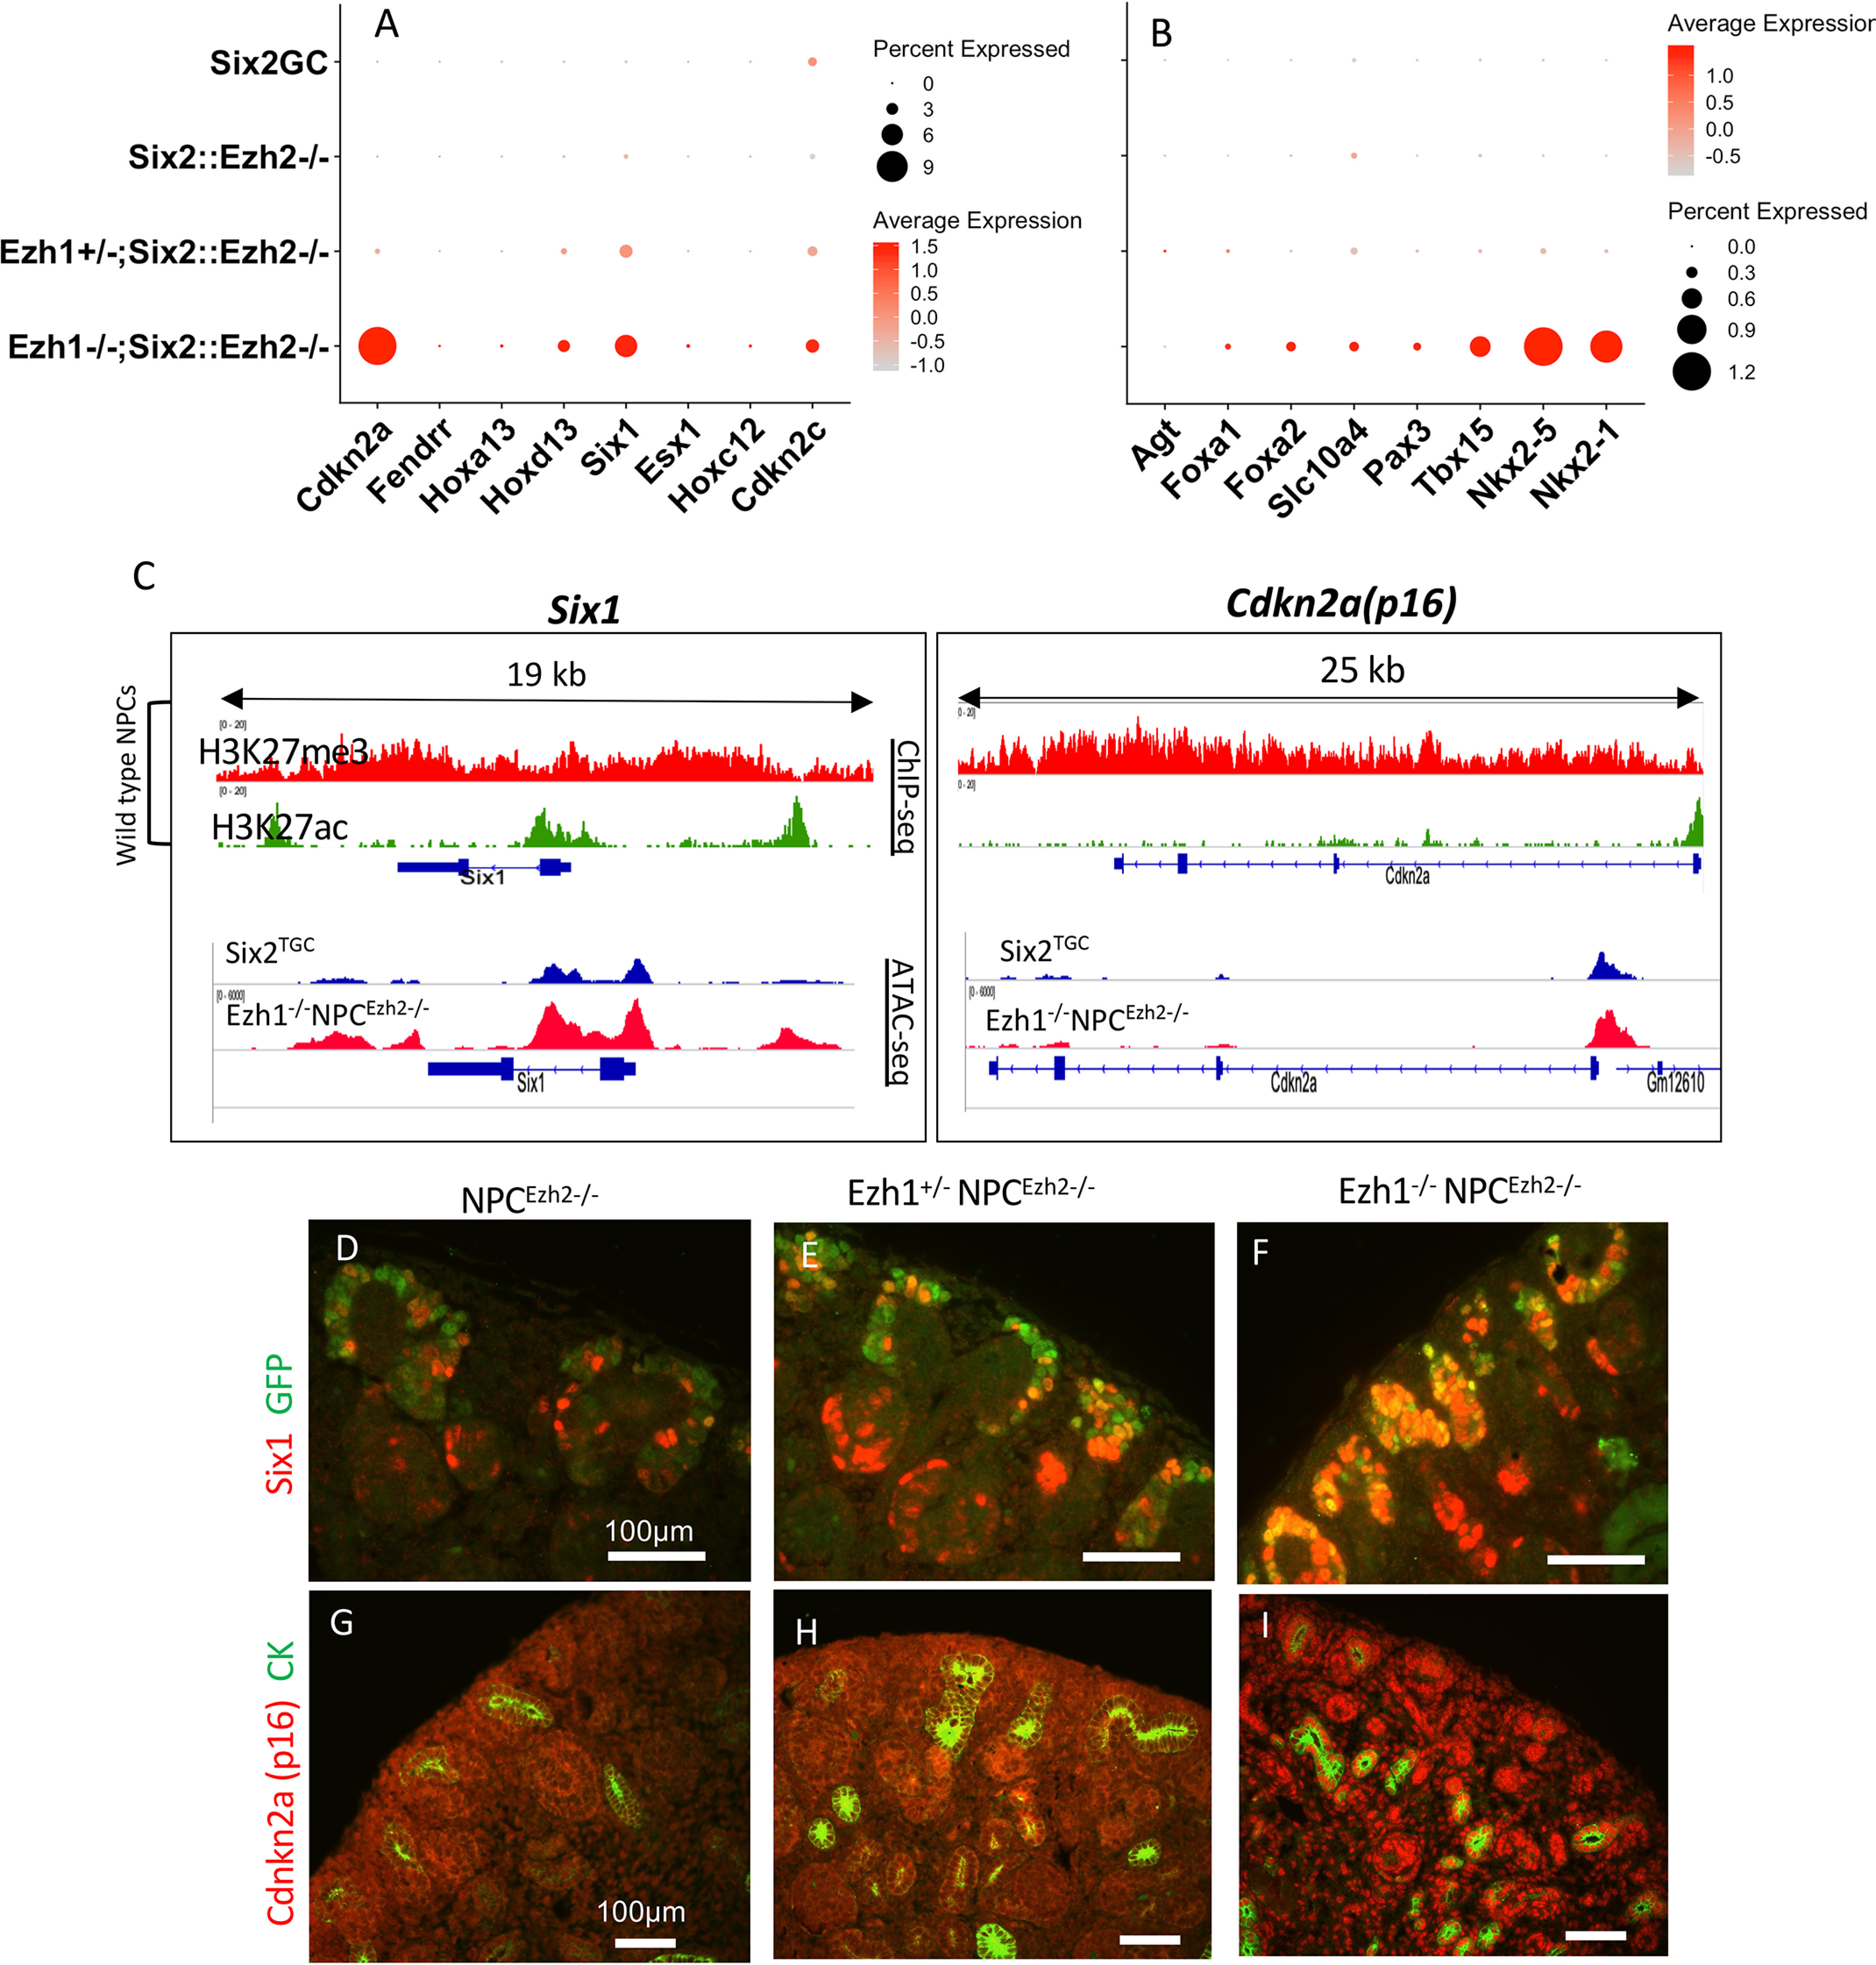
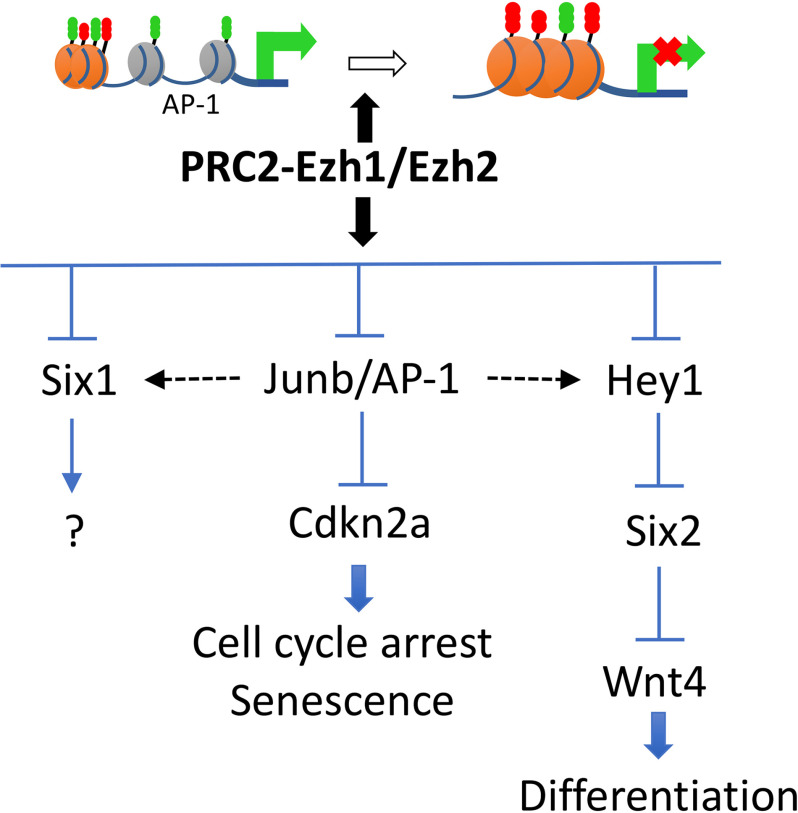
SIX2 (SIX homeobox 2)-positive nephron progenitor cells (NPCs) give rise to all epithelial cell types of the nephron, the filtering unit of the kidney. NPCs have a limited lifespan and are depleted near the time of birth. Epigenetic factors are implicated in the maintenance of organ-restricted progenitors such as NPCs, but the chromatin-based mechanisms are incompletely understood. Here, using a combination of gene targeting, chromatin profiling, and single-cell RNA analysis, we examined the role of the murine histone 3 Lys-27 (H3K27) methyltransferases EZH1 (enhancer of zeste 1) and EZH2 in NPC maintenance. We found that EZH2 expression correlates with NPC growth potential and that EZH2 is the dominant H3K27 methyltransferase in NPCs and epithelial descendants. Surprisingly, NPCs lacking H3K27 trimethylation maintained their progenitor state but cycled slowly, leading to a smaller NPC pool and formation of fewer nephrons. Unlike Ezh2 loss of function, dual inactivation of Ezh1 and Ezh2 triggered overexpression of the transcriptional repressor Hes-related family BHLH transcription factor with YRPW motif 1 (Hey1), down-regulation of Six2, and unscheduled activation of Wnt4-driven differentiation, resulting in early termination of nephrogenesis and severe renal dysgenesis. Double-mutant NPCs also overexpressed the SIX family member Six1 However, in this context, SIX1 failed to maintain NPC stemness. At the chromatin level, EZH1 and EZH2 restricted accessibility to AP-1-binding motifs, and their absence promoted a regulatory landscape akin to differentiated and nonlineage cells. We conclude that EZH2 is required for NPC renewal potential and that tempering of the differentiation program requires cooperation of both EZH1 and EZH2.

Keywords: H3K27 methyltransferase; SIX homeobox 2 (SIX2); chromatin; development; enhancer of zeste (Ezh); epigenetics; histone methylation; kidney; nephrology; nephron progenitors; polycomb.


Conflict of interest statement

Conflict of interest—The authors declare that they have no conflicts of interest with the contents of this article.

Figures

Figure 1.
Figure 1.
Ezh2 is the dominant H3K27 methyltransferase in nephron progenitors and descendant renal epithelial cells. A, dot plot depicting developmental expression of PRC2 components in NPCs from representative stages. Single-cell RNA values from E14.5 NPCs were obtained from GSE130606. ScRNA data from E16.5 and P2 are from the present study (GSE144384). B and C, at E15.5 Six2TGC and Ezh1−/− kidneys show abundant expression of H3K27me3 in the nephrogenic cortex. Solid arrows point to cap mesenchyme. D, in E15.5 NPCEzh2−/− kidneys (Six2GFPCre;Ezh2fl/fl), H3K27me3 is absent in the cap mesenchyme (solid arrows) and derived nascent nephrons (open arrows) but present in other structures such as surrounding stroma and ureteric bud branches and tips. E, H3K27me3 is absent in the cap mesenchyme of E17.5 GFP+NPCEzh2−/− (filled arrow). F and G, permanent genetic labeling shows absence of H3K27me3 in tdTomato-labeled tubules derived from NPCEzh2−/− but not NPCEzh2+/ kidneys. H, H′, I, and Í, H3K27Ac replaces H3K27me3 in NPCs and tubular derivatives of NPCEzh2−/− but not Ezh1−/− kidneys. DAPI, 4′,6-diamidino-2-phenylindole.
Figure 2.
Figure 2.
NPC-specific inactivation of Ezh2 impairs proliferation potential and nephron formation. E15.5 NPCEzh± (Six2TGC;Ezh2fl/+) are compared with NPCEzh2−/− (Six2TGC;Ezh2fl/fl) kidneys. A, Á, B, and B′, gross view and hematoxylin-stained sections. C and C′, co-staining for Cited1 (a marker of self-renewing NPCs) and Laminin (marks basement membrane of nascent nephrons and tubules). D and D′, co-staining of the stroma marker Meis1 and NPC marker Six2. E and É, co-staining of the epithelial cell marker E-cadherin and nephron differentiation marker Lhx1. F–H′, section in situ hybridization for the differentiation genes Lhx1, Pax8, and Wnt4. I, FACS isolated Six2GFP+ cells were counted and divided by the total number of kidney cells. J, phospho-H3+ cells were counted and factored for total 4′,6-diamidino-2-phenylindole (nuclei) in co-stained sections identifying stroma (Meis1), NPC (Six2), and tubular compartments (negative for Six2 and Meis1). K, cell cycle analysis of Six2GFP+ cells. L, glomerular counts/tissue section at P30. n = 3 animals/group.
Figure 3.
Figure 3.
Ezh1 and Ezh2 are essential for tempering the differentiation program in NPCs. Phenotypic comparison of P0 kidneys from NPCEzh2−/− (Six2TGC;Ezh2fl/fl), compound heterozygous Ezh1+/NPCEzh2−/− (Ezh1+/;Six2TGC;Ezh2fl/fl), and homozygous Ezh1−/−NPCEzh2−/− (Ezh1−/−;Six2TGC;Ezh2fl/fl) mice. A, gross view. B, hematoxylin and eosin section staining showing gene dosage–dependent disorganization of the outer nephrogenic cortex and cystic dysplasia. C–D´´, section IF of Hey1 (C–C´´) and Six2 (D–D´´). E–E´´, section ISH for Wnt4: Wnt4 is expressed in renal vesicles (open arrows) beneath the UB branch (dotted line) as seen in NPCEzh2−/− kidneys but is ectopically expressed in NPCs dorsal to UB tip in double mutant kidneys. F–G´´, section IF of Lef1 (F–F´´) and Lhx1 (G–G´´) denoting premature burst of NPC differentiation in double-mutant kidneys. Solid white arrows in and F´´ point to ectopic Lef1-expressing NPCs. DAPI, 4′,6-diamidino-2-phenylindole.
Figure 4.
Figure 4.
Single-cell RNA profiling of NPCs. Six2GFP+ NPCs from E16.5 Six2TGC (control), NPCEzh2−/−, Ezh1+/NPCEzh2−/−, and Ezh1−/−NPCEzh2−/− kidneys were profiled using 10× chromium scRNA-seq. Sorted NPCs (ranging in number from 6574 to 11,382 cells/group) were analyzed together using Seurat's version 3.0 data set integration approach (21). A, t-SNE plot of integrated data. Clusters are referred to as NPC clusters 0–7 (NPC0–NPC7). Top expressed markers are listed next to each cluster ID. NPC0 cluster contains “uncommitted” progenitor genes such as Cited1. Clusters NPC1, NPC2, and NPC5 are enriched with cell cycle (CC) genes. NPC3 cluster includes genes expressed in committed progenitors, whereas NPC6 cluster features of differentiating markers. Cluster NPC3 expressed Spry2, a negative regulator of FGF signaling that is important NPC maintenance (23). Notch signaling is also known to regulate NPC maintenance (24). A Spry2/Notch2-enriched cluster was described by Combes et al. (22) and is thought to represent a transitional state between nephron progenitor and early nascent nephrons. B, heat map of representative genes of the various NPC clusters shown in A. C and D, heat maps highlighting NPC3 and NPC6 clusters. E, feature plots showing the landscape of cells enriched in the progenitor transcription factor Six2 and pro-differentiation genes Ccnd1, Jag1, and Lhx1.
Figure 5.
Figure 5.
scRNA profiling reveals imbalance in progenitor and differentiation gene expression. A and B, heat map and volcano plot representations of progenitor and differentiation gene expression. Progenitor gene expression is maintained in E16.5 NPCEzh2−/− but is down-regulated in Ezh1−/−NPCEzh2−/− NPCs, which also express higher levels of differentiation markers than control Six2TGC NPCs. C–G, scRNA dot plots representing expression of progenitor, early and late differentiation, Notch and AP-1 transcription factor family genes. The intensity of the red color represents normalized expression, and the size of the dot represents percentage of cells expressing individual genes.
Figure 6.
Figure 6.
Single-cell trajectory analysis. A and B, monocle 2.0-based pseudo-time trajectory analysis of Lhx1-enriched NPCs. Open red arrows denote the locations of Lhx1high cells along the trajectory. In control, Six2TGC NPCs, Lhx1high cells (purple) are largely confined to subcluster 5 at the end of trajectory; in Ezh1−/−NPCEzh2−/− NPCs, there are early and late subclusters of Lhxhigh cells (green, subcluster #3) along the pseudo-time trajectory. FDR, false discovery rate.
Figure 7.
Figure 7.
Ezh1 and Ezh2 regulate chromatin accessibility in NPCs. Ezh1 and Ezh2 regulate chromatin accessibility in NPCs. A, number of ATAC-seq accessible chromatin regions in the four NPC genotypes. B, principal component analysis of control and mutant samples. C, differential motif accessibility in control and mutant NPCs using DiffBind R. D and E, ATACseq tracks showing open chromatin regions of representative genes comparing Six2TGC and double mutant Ezh1−/−NPCEzh2−/− groups. F and G, HOMER-based ranking of top accessible motifs in control and mutant NPCs. The p values represent the statistical significance within each group. H and I, GREAT identification of Gene Ontology biological terms associated with ATAC-accessible chromatin.
Figure 8.
Figure 8.
Nonlineage genes are targets for Ezh1/2-mediated repression in NPCs. A and B, scRNA-seq dot plot depicting expression of nonlineage genes in control and double-mutant Ezh1−/−NPCEzh2−/− cells. C, top panels, P0 WT NPCs - ChIP-seq tracks of Six1 and Cdkn2a/p16: both genes are occupied by large domains of repressive H3K27me3. Bottom panels, ATAC-seq showing increased chromatin accessibility in Six1 and Cdkn2a genes in Ezh1−/−NPCEzh2−/− as compared with control NPCs. D–I, section IF: gene dosage–dependent derepression of Six1 and p16 expression.
Figure 9.
Figure 9.
Schematic depicting a working model for the role of PRC2 in nephron progenitor maintenance. PRC2-Ezh1/Ezh2 complexes restrict chromatin access to AP-1 motifs. This action prevents unscheduled/unwanted activation of genes that disrupt the balance between NPC stemness and differentiation. Note: the composition of the AP-1 complex is based on gene expression results and thus should be considered hypothetical at this point.

References

    1. Kobayashi A., Valerius M. T., Mugford J. W., Carroll T. J., Self M., Oliver G., and McMahon A. P. (2008) Six2 defines and regulates a multipotent self-renewing nephron progenitor population throughout mammalian kidney development. Cell Stem Cell 3, 169–181 10.1016/j.stem.2008.05.020 - DOI - PMC - PubMed
    1. Lindström N. O., McMahon J. A., Guo J., Tran T., Guo Q., Rutledge E., Parvez R. K., Saribekyan G., Schuler R. E., Liao C., Kim A. D., Abdelhalim A., Ruffins S. W., Thornton M. E., Basking L., et al. (2018) Conserved and divergent features of human and mouse kidney organogenesis. J. Am. Soc. Nephrol. 29, 785–805 - PMC - PubMed
    1. Little M. H. (2015) The life cycle of the nephron progenitor. Dev. Cell 35, 5–6 10.1016/j.devcel.2015.09.023 - DOI - PubMed
    1. Zohdi V., Sutherland M. R., Lim K., Gubhaju L., Zimanyi M. A., and Black M. J. (2012) Low birth weight due to intrauterine growth restriction and/or preterm birth: effects on nephron number and long-term renal health. Int. J. Nephrol. 2012, 136942 10.1155/2012/136942 - DOI - PMC - PubMed
    1. Luyckx V. A., and Brenner B. M. (2019) Clinical consequences of developmental programming of low nephron number. Anat. Rec. (Hoboken) 10.1002/ar.24270 - DOI - PubMed

Publication types