. 2020 Sep 1;26(17):4699-4712.
doi: 10.1158/1078-0432.CCR-19-4110. Epub 2020 Jun 18.

Anti-PD-1 Induces M1 Polarization in the Glioma Microenvironment and Exerts Therapeutic Efficacy in the Absence of CD8 Cytotoxic T Cells

Affiliations

Anti-PD-1 Induces M1 Polarization in the Glioma Microenvironment and Exerts Therapeutic Efficacy in the Absence of CD8 Cytotoxic T Cells

Ganesh Rao et al. Clin Cancer Res. .

Abstract

Purpose: Anti-programmed cell death protein 1 (PD-1) therapy has demonstrated inconsistent therapeutic results in patients with glioblastoma (GBM) including those with profound impairments in CD8 T-cell effector responses.

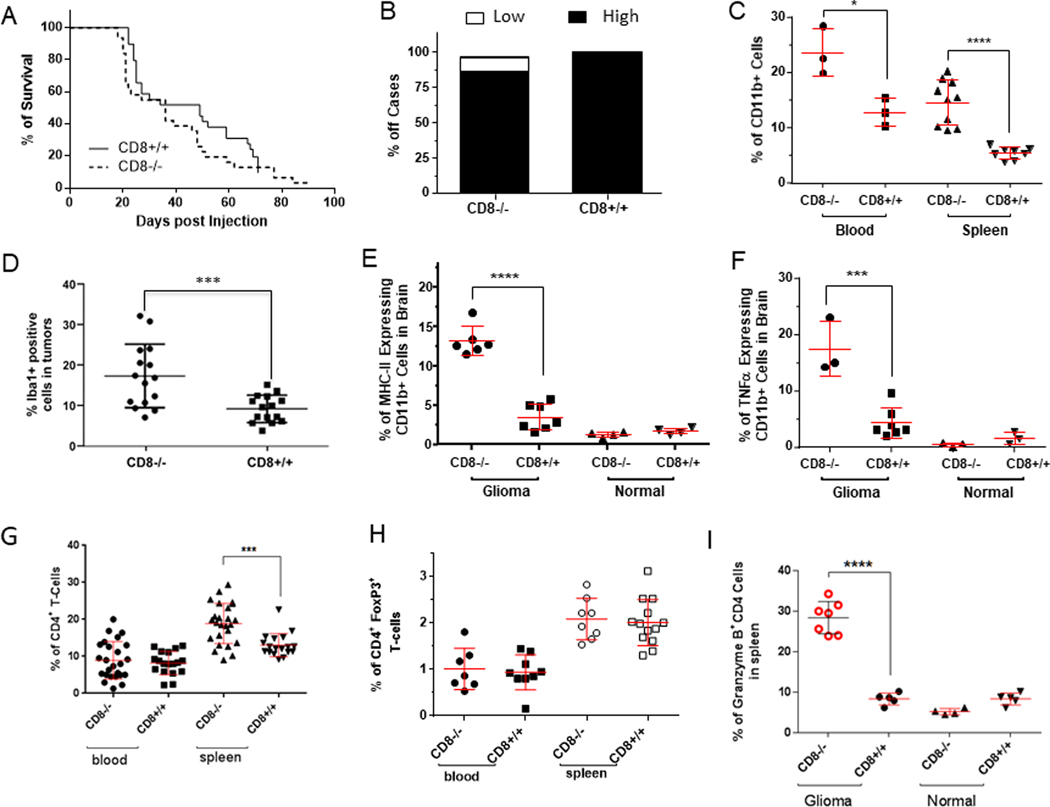
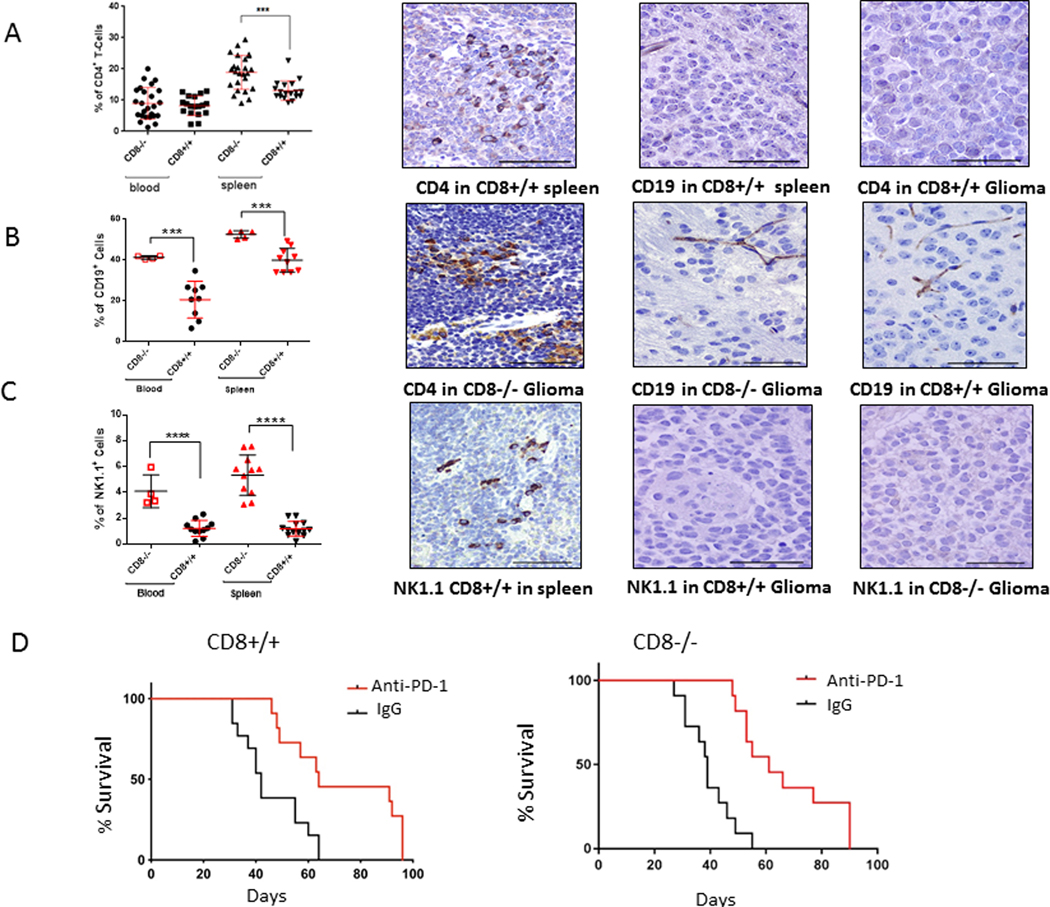
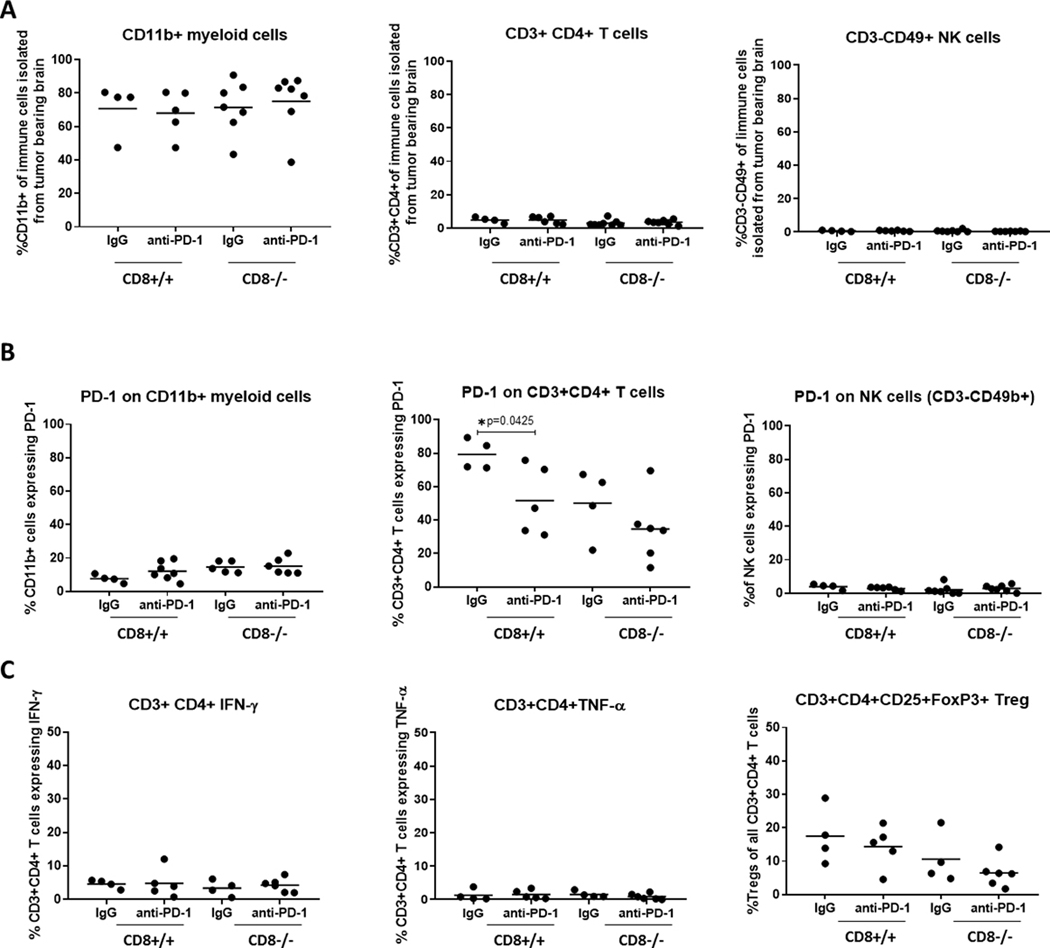
Experimental design: We ablated the CD8α gene in BL6 mice and intercrossed them with Ntv-a mice to determine how CD8 T cells affect malignant progression in forming endogenous gliomas. Tumor-bearing mice were treated with PD-1 to determine the efficacy of this treatment in the absence of T cells. The tumor microenvironment of treated and control mice was analyzed by IHC and FACS.

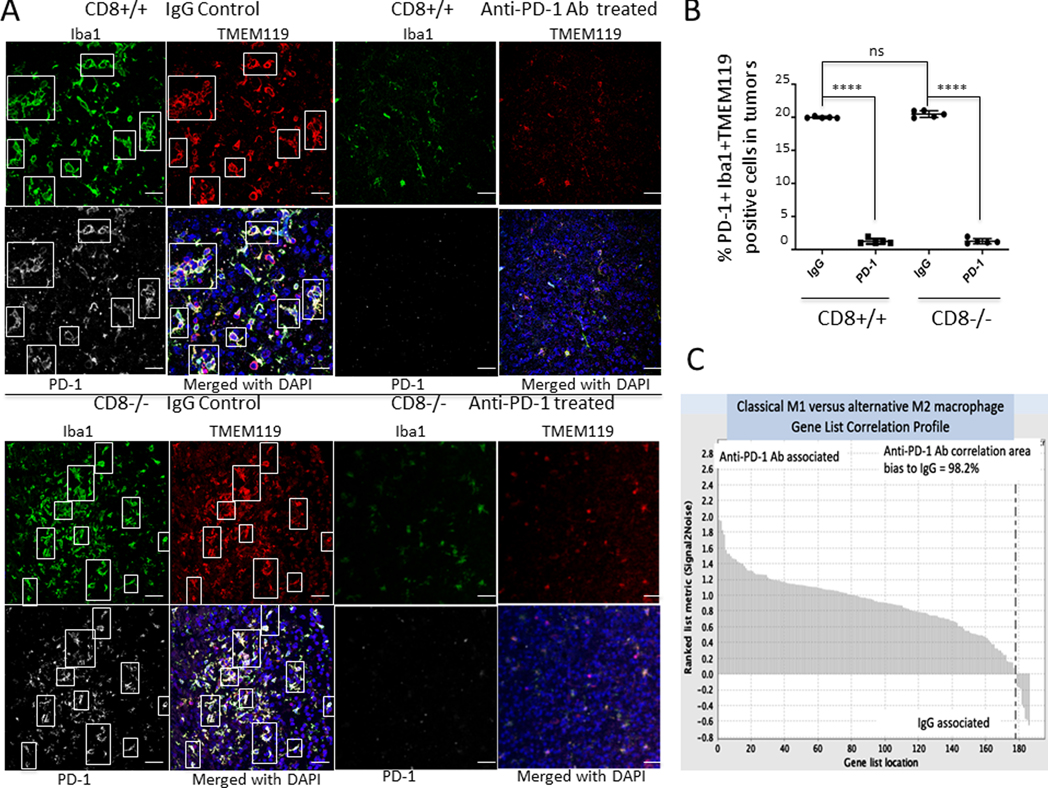
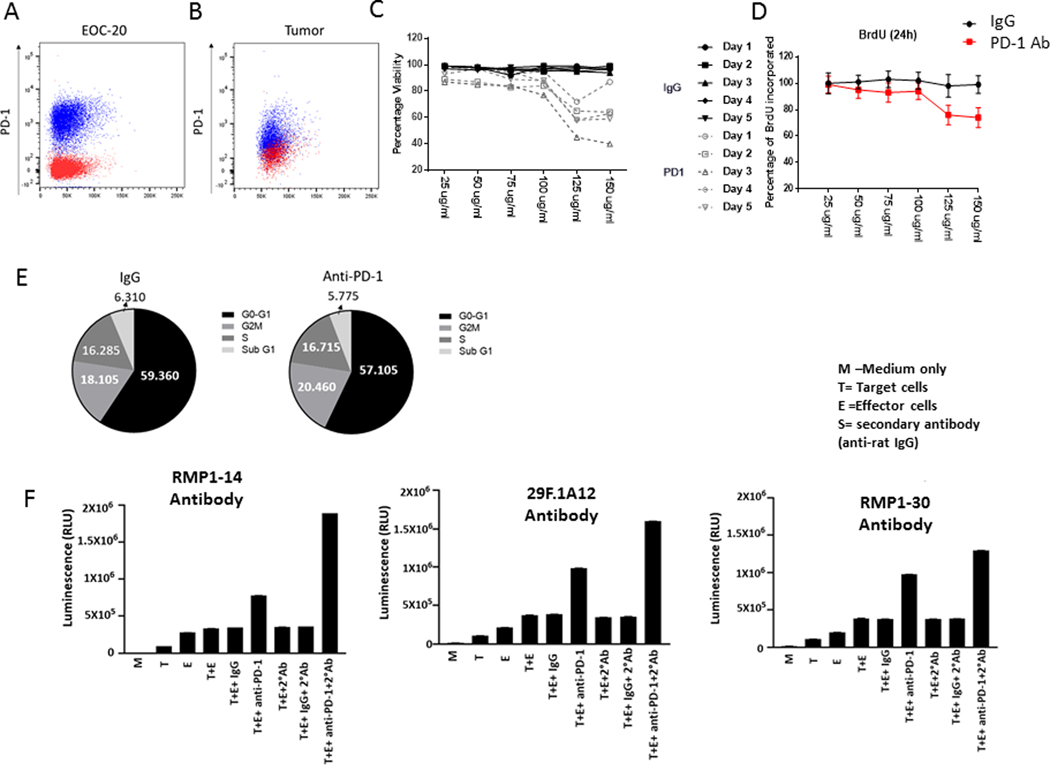
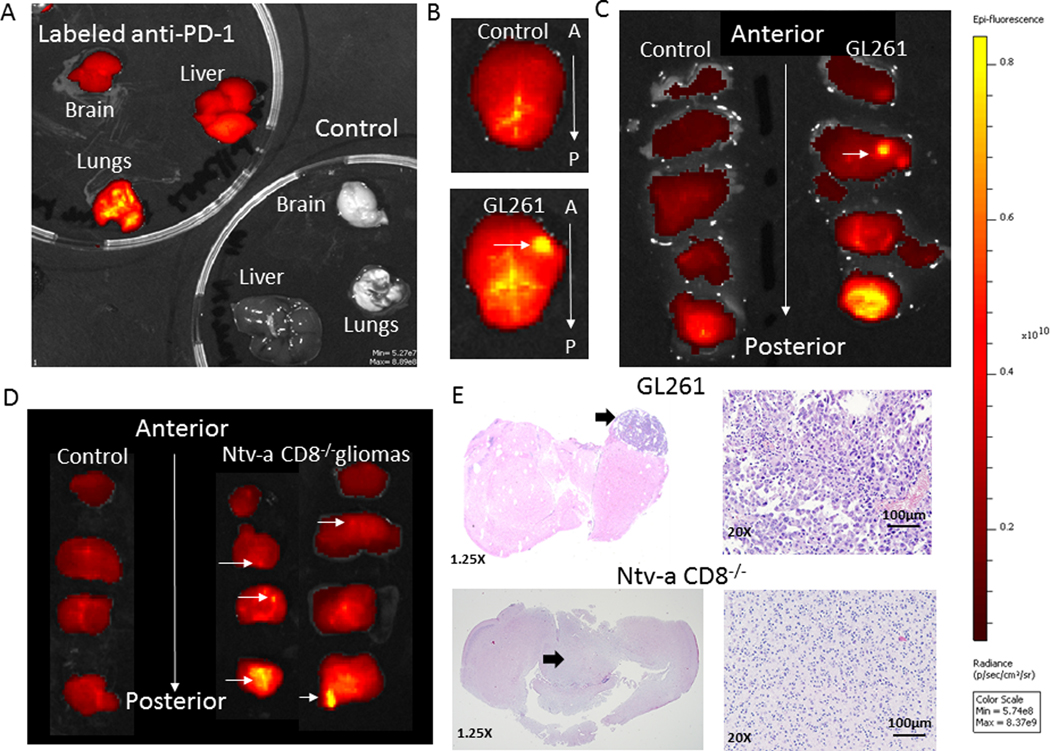
Results: We observed a survival benefit in immunocompetent mice with endogenously arising intracranial glioblastomas after intravenous administration of anti-PD-1. The therapeutic effect of PD-1 administration persisted in mice even after genetic ablation of the CD8 gene (CD8-/-). CD11b+ and Iba1+ monocytes and macrophages were enriched in the glioma microenvironment of the CD8-/- mice. The macrophages and microglia assumed a proinflammatory M1 response signature in the setting of anti-PD-1 blockade through the elimination of PD-1-expressing macrophages and microglia in the tumor microenvironment. Anti-PD-1 can inhibit the proliferation of and induce apoptosis of microglia through antibody-dependent cellular cytotoxicity, as fluorescently labeled anti-PD-1 was shown to gain direct access to the glioma microenvironment.

Conclusions: Our results show that the therapeutic effect of anti-PD-1 blockade in GBM may be mediated by the innate immune system, rather than by CD8 T cells. Anti-PD-1 immunologically modulates innate immunity in the glioma microenvironment-likely a key mode of activity.


Conflict of interest statement

Conflict of interest

The authors declare no conflict of interest.

Figures

Fig. 1.
Fig. 1.. CD8 knockout (CD8−/−) does not impact survival in a genetically-engineered murine model of glioma and demonstrate a compensatory increase in macrophages in the glioma microenvironment.
A, As shown by the Kaplan-Meier curves, survival was not impacted when 5 × 10⁴ DF-1 cells/mouse containing the RCAS-PDGFB+RCAS-STAT3 genes were injected bilaterally into the frontal brain lobes of CD8−/− mice. B, At the time of death or when the animal was moribund, an autopsy was performed, and microscope slides containing sections of the central nervous system (CNS) were stained with hematoxylin and eosin (H & E) for tumor grading. The CD8 status did not influence the glioma grade. C, CD11b+ monocytes and macrophages were found to occur more frequently in the blood and spleens of tumor-bearing CD8−/− mice than in those of CD8+/+ mice (*P=0.0202 for blood; ****P<0.0001 for spleen). The analysis was conducted using ex vivo flow cytometry and the percentage of CD11b+ cells was calculated based on the total alive cells with 30,000 total events analyzed. D, CD11b+ MHC II+ cells were found by ex vivo flow cytometry to be enriched in the CD8−/− group relative to the wild-type CD8+/+ group (****P=0.0001). The percentage of duel expressing CD11b+ MHC II+ cells was calculated based on the total alive cells with 30,000 total events analyzed. E, Dot plot summarizing a significantly higher percentage of Iba1+ cells in gliomas in the CD8−/− mice than in CD8+/+ mice. P=0.001. F, Functional analysis by detecting intracellular TNF-α expression with flow cytometry demonstrated increased numbers of TNF-α+-expressing CD11b+ cells in glioma-bearing CD8−/− mice (***P=0.0001). The analysis was conducted using ex vivo flow cytometry and the percentage of CD11b+ cells that had intracellular expression of TNF-α was calculated based on the total alive cells with 30,000 total events analyzed. G, CD8 knockout mice demonstrate a compensatory increase in the peripheral CD4 compartment. The CD4+ T cell percentage in spleens was increased in CD8−/− mice (***P=0.0002). H, Because there was an increase in the frequency of CD4+ T cells in the CD8−/− mice, the fraction of Tregs within the CD4 compartment was assessed, but no differences were observed in this in either the blood or spleen compartments, regardless of CD8 status. I, The percentage of CD4+ T cells producing granzyme B was found to be increased only in CD8−/− mice harboring intracranial tumors (****P<0.0001).
Fig. 2.
Fig. 2.. CD8 knockout mice (CD8−/−) demonstrate a compensatory increase in multiple peripheral immune compartments.
A, CD4+ T cells were not detected in the gliomas of either CD8−/− mice (CD8−/−) or wild-type mice (CD8+/+) by immunohistochemical staining. B, CD19+ cells and C, NK1.1+ populations in the blood and spleen of glioma-bearing mice were found to be significantly higher in the CD8−/− group relative to the CD8+/+ group (***P=0.0004 and ****P <0.0001, respectively). However, these cell populations were not detected within the brain tumors. Spleen staining is the positive control. Representative immunohistochemically-stained images at 200x magnification for A and B left panels, bar = 100 μM; A and B middle and right panels at 400x magnification, bar = 50 μM. D, Kaplan-Meier estimates of tumor-free survival in glioblastoma-bearing Ntv-a mice in the wild type (CD8+/+) or CD8−/− background treated with anti-PD-1 or IgG isotype control (n = 11–13 per group). The median overall survival time was 68 days in the anti-PD-1 Ab-treated wild type mice and 40 days in the control group (log rank test, P=0.0002) (left panel). The median overall survival time was 61 days in the anti-PD-1 Ab-treated CD8−/− mice and 39 days in the control group (log rank test, P<0.0001).
Fig. 3.
Fig. 3.. Flow cyotmetric analysis of immune cell subsets isolated from the whole brain of glioblastoma-bearing Ntv-a mice in the wild type (CD8+/+) or CD8−/− background treated with PD-1 antibody or IgG isotype control.
A, Percentage of CD11b+ myeloid (left) [CD8+/+ IgG vs anti-PD-1 p=0.7933; CD8−/− IgG vs anti-PD-1 p=0.6872], CD3+ CD4+ T cells (middle) [CD8+/+ IgG vs anti-PD-1 p=0.9975; CD8−/− IgG vs anti-PD-1 p=0.5572], and cells NK cells (right) [CD8+/+ IgG vs anti-PD-1 p=0.7146; CD8−/− IgG vs anti-PD-1 p=0.3732 ] of all immune cells isolated from the whole brains of tumor bearing Ntv-a mice. B, PD-1 expression on CD11b+ myeloid cells (left) [CD8+/+ IgG vs anti-PD-1 p=0.1551; CD8−/− IgG vs anti-PD-1 p= 0.8539], CD3+ CD4+ T cells (middle) [CD8+/+ IgG vs anti-PD-1 p= 0.0425; CD8−/− IgG vs anti-PD-1 p= 0.2647], and NK cells (right) [CD8+/+ IgG vs anti-PD-1 p= 0.2294; CD8−/− IgG vs anti-PD-1 p= 0.5275]. C, Quantification of functional CD3+ CD4+ T cell subsets in the brains of tumor-bearing mice, percentage of IFN-ɣ (left) [CD8+/+ IgG vs anti-PD-1 p= 0.9441; CD8−/− IgG vs anti-PD-1 p= 0.5492] and TNF-α (middle) [CD8+/+ IgG vs anti-PD-1 p= 0.8415; CD8−/− IgG vs anti-PD-1 p= 0.2869] expressing cytotoxic CD3+ CD4+ T cells, and percentage of regulatory T cells (Treg; right) [CD8+/+ IgG vs anti-PD-1 p=0.5431; CD8−/− IgG vs anti-PD-1 p=0.2994]. Two-sided unpaired t-test was performed to compare the treatment groups within the genotypes, only the statistical significant values (p≤ 0.05) are indicated in the figure.
Fig. 4.
Fig. 4.. Anti-PD-1 recalibrates the glioma-infiltrating macrophages/microglia to an M1 phenotype.
A, Representative immunofluorescent images of Iba1+TMEM119+PD-1+ microglia infiltration in a glioblastoma-bearing mouse (CD8+/+ background, with similar staining in the CD8−/− background) after IgG or anti-PD-1 Ab treatment, 400x magnification, scale bar = 50 μM. B, Scatter plot demonstrating difference in PD-1 expressing Iba1+TMEM119+ expression in the wild-type CD8+/+ and KO CD8−/− background mice demonstrating a significant reduction in the number of Iba1+TMEM119+ microglia after anti-PD-1 Ab treatment (P<0.0001, t test, n=5 per group). Quantification was done by as described in methods. C, The genetic signature of a proinflammatory M1 phenotype in macrophages/microglia compared between gliomas treated with an isotype control IgG and anti-PD-1 Ab. A GSEA waterfall plot shows that only a small subset of the total M1 genes were found to be preferentially expressed in the IgG-treated group (usually in the wild-type CD8+/+ background). Overall, the M1 profile was strongly associated with the use of the anti-PD-1 Ab.
Fig. 5.
Fig. 5.. Direct and Ab-dependent cellular cytotoxicity (ADCC) activity of anti-PD-1 Ab on PD-1 expressing macrophage/microglia.
A, PD-1 expression of EOC-20 cells, gated on CD45+ CD11b+ cells. B, PD-1 expression on myeloid cells (CD45+, CD11b+) isolated from tumor bearing Ntv-a mice. C, Coincubation of only the anti-PD-1 Ab at the designated concentrations with PD-1 expressing EOC-20 microglia resulted in diminished cellular viability starting one day after exposure, which was further enhanced with increased exposure time. D, Coincubation of BrdU-labeled EOC-20 microglia with increasing concentrations of anti-PD-1 relative to the IgG control demonstrated decreased proliferative capacity. E, Cell cycle analysis of EOC-20 cells exposed to IgG control or anti-PD-1 demonstrating that these antibodies do not impact cellular proliferation. F, Ab-dependent cellular cytotoxicity (ADCC) assay detecting lactic dehydrogenase leakage (luminescence; relative light units [RLU]) from target EOC-20 microglia cells upon exposure to anti-PD-1 and in the presence of effector cells capable of mediating ADCC. Mouse microglial target cells, EOC20, were incubated with control Ab or anti-PD-1 Ab at a concentration of 125 μg/ml or 12.5 μg/ml, followed by the addition of effector cells. The E:T ratio was 20:1. After 8h of induction at 37o C, Bio-Glo luciferase reagent was added, and luminescence (RLU) was determined. The ADCC was further potentiated by the presence of a secondary Ab (mouse anti-rat) that could be generated by repeat administration of a rat anti-mouse Ab (anti-PD-1) in vivo. M = Media; T = Target; E = Effector Cell. When the anti-PD-1 Ab was decreased to 12.5 μg/ml, similar results were obtained.
Fig. 6.
Fig. 6.. Anti-PD-1 in vivo biodistribution analysis.
A, C57BL/6 mice were either untreated (control) or injected with 200 μg of fluorescently-labeled anti-PD-1. After 3 hours, their organs were harvested, rinsed in PBS, positioned on a petri dish, and then imaged using the IVIS 200 Fluorescence Imager. The organs were then photographed. B, The brain from a non-tumor-bearing C57BL/6 mouse treated with fluorescently-labeled anti-PD-1 (top panel) or bearing intracerebral GL261 (bottom panel). The arrow denotes the location of the GL261 implantation. C, The brains from B were then sequentially coronally sectioned, with the non-tumor-bearing brain on the left and the GL261-implanted brain on the right. The sections were positioned anterior to posterior on the petri dish and imaged. The horizontal arrow denotes the location of the implanted GL261 cells in the right frontal lobe. Increased fluorescent intensity is detected in the posterior cerebellum. All brain sections were imaged for the same exposure time. D, Non-glioma-bearing (control) or glioma-bearing Ntv-a mice in the knockout (CD8−/−) background were treated with 200 μg of fluorescently-labeled anti-PD-1. After 3 hours, their brains were harvested, rinsed in PBS, coronally sectioned, positioned on a petri dish, and then imaged using the IVIS 200 Fluorescence Imager. The brains were then photographed. Increasing fluorescence intensity is seen to correlate with increasing concentration of anti-PD-1. E, Hematoxylin and eosin (H & E) stained coronal sections of GL261 (top) and Ntv-a CD8−/− (bottom) from C and D panels. 20x magnification, scale bar = 100μM. Arrows indicate the region of the tumor.

References

    1. Liau LM, Prins RM, Kiertscher SM, Odesa SK, Kremen TJ, Giovannone AJ, et al. Dendritic cell vaccination in glioblastoma patients induces systemic and intracranial T-cell responses modulated by the local central nervous system tumor microenvironment. Clin Cancer Res. 2005;11(15):5515–25. - PubMed
    1. Prins RM, Soto H, Konkankit V, Odesa SK, Eskin A, Yong WH, et al. Gene expression profile correlates with T-cell infiltration and relative survival in glioblastoma patients vaccinated with dendritic cell immunotherapy. Clin Cancer Res. 2011;17(6):1603–15. - PMC - PubMed
    1. Sampson JH, Aldape KD, Archer GE, Coan A, Desjardins A, Friedman AH, et al. Greater chemotherapy-induced lymphopenia enhances tumor-specific immune responses that eliminate EGFRvIII-expressing tumor cells in patients with glioblastoma. Neuro Oncol. 2011;13(3):324–33. - PMC - PubMed
    1. Sampson JH, Heimberger AB, Archer GE, Aldape KD, Friedman AH, Friedman HS, et al. Immunologic escape after prolonged progression-free survival with epidermal growth factor receptor variant III peptide vaccination in patients with newly diagnosed glioblastoma. J Clin Oncol. 2010;28(31):4722–9. - PMC - PubMed
    1. Yu J, Liu G, Ying H, Yong W, Black K, Wheeler CJ. Vaccination with tumor lysate-pulsed dendritic cells elicits antigen-specific, cytotoxic T-cells in patients with malignant glioma. Cancer Res. 2004;64(14):4973–9. - PubMed

Publication types

MeSH terms

Substances