. 2020 Jul 13;147(13):dev185884.
doi: 10.1242/dev.185884.

Development and function of smooth muscle cells is modulated by Hic1 in mouse testis

Affiliations

Development and function of smooth muscle cells is modulated by Hic1 in mouse testis

Aya Uchida et al. Development. .

Abstract

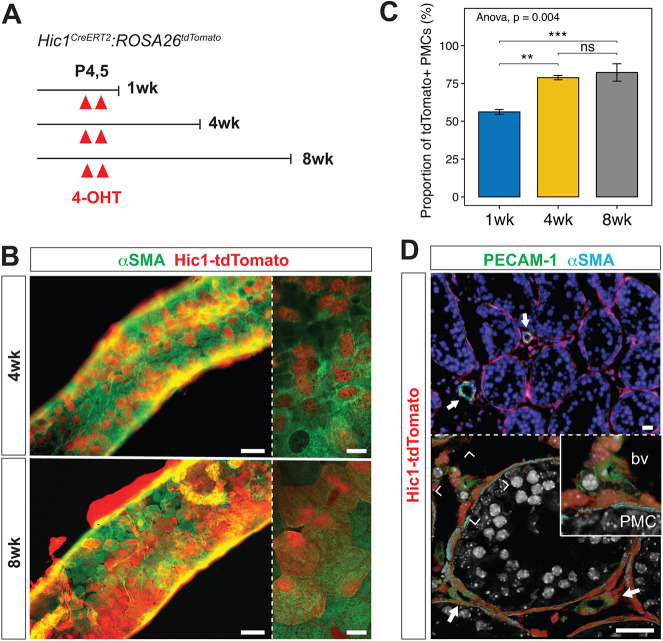
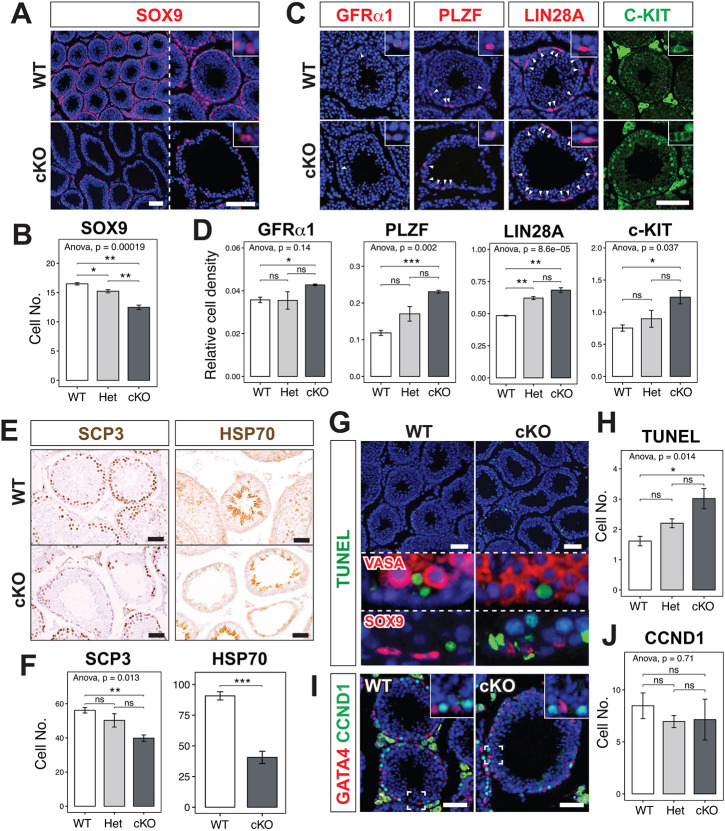
In mammalian testis, contractile peritubular myoid cells (PMCs) regulate the transport of sperm and luminal fluid, while secreting growth factors and extracellular matrix proteins to support the spermatogonial stem cell niche. However, little is known about the role of testicular smooth muscle cells during postnatal testicular development. Here we report age-dependent expression of hypermethylated in cancer 1 (Hic1; also known as ZBTB29) in testicular smooth muscle cells, including PMCs and vascular smooth muscle cells, in the mouse. Postnatal deletion of Hic1 in smooth muscle cells led to their increased proliferation and resulted in dilatation of seminiferous tubules, with increased numbers of PMCs. These seminiferous tubules contained fewer Sertoli cells and more spermatogonia, and fibronectin was not detected in their basement membrane. The expression levels of genes encoding smooth muscle contractile proteins, Acta2 and Cnn1, were downregulated in the smooth muscle cells lacking Hic1, and the seminiferous tubules appeared to have reduced contractility. These data imply a role for Hic1 in determining the size of seminiferous tubules by regulating postnatal smooth muscle cell proliferation, subsequently affecting spermatogenesis in adulthood.

Keywords: Fibronectin; Hic1; Mouse; Peritubular myoid cell; Testicular smooth muscle cells; Testis.


Conflict of interest statement

Competing interestsThe authors declare no competing or financial interests.

Figures

Fig. 1.
Fig. 1.
Identification of Hic1 expression in mouse testicular smooth muscle cells. (A) Schematic illustration of the anatomy of a mouse testis and seminiferous tubules, highlighting the testicular smooth muscle cells in green. (B) Schematic diagram of the experimental strategy used to visualize Hic1-expressing cells with tdTomato. (C-F) Hic1 expression in mouse testicular smooth muscle cells at 1 week old. (C) Anti-αSMA immunohistochemistry (green) and Hic1-tdTomato (red) in testis tissue sections from 1-week-old Hic1CreERT2:ROSA26tdTomato mice. (D,E) In situ hybridization of Hic1 (red) in 1-week-old mouse testis. Hic1 signal was observed in the cytoplasm of smooth muscle cells (red in D and E), overlapping with αSMA immunoreactivity (brown in E). (F) Hic1-tdTomato in vascular smooth muscle cells distinguished by αSMA (cyan) and adjacent PECAM-1 (green) immunoreactivities. White arrows indicate vasculature. (G) The proportion of Hic1-tdTomato+ PMCs in 1-, 4- and 8-week-old Hic1CreERT2:ROSA26tdTomato mice (n=3 for 1 week, n=4 for 4 and 8 weeks of age). Data are shown as the mean±s.e.m. Analysis was performed using one-way ANOVA followed by Tukey's multiple comparison test. ****P<0.001. (H) Anti-αSMA immunohistochemistry (green) and Hic1-tdTomato (red) in whole-mount seminiferous tubule samples from 1-, 4- and 8-week-old Hic1CreERT2:ROSA26tdTomato mice. White arrowheads indicate Hic1-tdTomato+ PMCs in the panels for 4 weeks and 8 weeks. Right panels in C-E and an inset in F show the regions surrounded by broken rectangles at higher magnifications. Right panels in H show the confocal image of PMCs at each age. Scale bars: 20 μm in C–F and right panels in H; 50 μm in left panels in H.
Fig. 2.
Fig. 2.
Adult PMCs and vascular smooth muscle cells arise from Hic1-expressing cells at 1 week of age. (A) Schematic diagram of the lineage-tracing analysis of cells expressing Hic1 at 1 week old. (B) Anti-αSMA immunohistochemistry (green) and Hic1-tdTomato (red) in whole-mount seminiferous tubules from 4- and 8-week-old Hic1CreERT2:ROSA26tdTomato mice injected with 4-OHT at P4 and P5. (C) The proportion of Hic1-tdTomato+ PMCs in 1-, 4- and 8-week-old Hic1CreERT2:ROSA26tdTomato mice injected with 4-OHT at P4 and P5 (n=3 mice per age). Data are shown as the mean±s.e.m. Analysis was performed using one-way ANOVA followed by Tukey's multiple comparison test. **P<0.01, ***P<0.005. (D) Hic1-tdTomato in vascular smooth muscle cells distinguished by αSMA (cyan) and adjacent PECAM-1 (green) immunoreactivities in testis tissue sections from 4-week-old Hic1CreERT2:ROSA26tdTomato mice. White arrows indicate vasculature in D. Right panels in B show the confocal image of PMCs at each age. An inset in D shows the regions surrounded by a broken rectangle at higher magnification. Scale bars: 50 μm in left panels in B; 20 μm in D and right panels in B.
Fig. 3.
Fig. 3.
Testes are larger, with tubular dilatation, in adult Hic1 cKO mice. (A) Schematic diagram of the experimental strategy to deplete Hic1 specifically in smooth muscle cells in the postnatal testis. (B) Gross morphology of testes from 4- and 8-week-old WT and cKO mice injected with 4-OHT at P4 and P5. (C) Relative testis weight to body weight in WT, Het and cKO mice at 4 and 8 weeks of age. WT, n=12; Het, n=11; cKO, n=9 at 4 weeks and WT, n=14; Het, n=13; cKO, n=7 at 8 weeks of age. (D) Histology of the testes from WT and cKO mice at 1, 4 and 8 weeks and 6 months of age. Right panels show the regions surrounded by broken rectangles in left panels at higher magnifications. (E,F) Average area of seminiferous tubule cross-sections (E) and the percentage of degenerative seminiferous tubule cross-sections (F) in WT, Het and cKO mice at 8 weeks of age. n=3 for each genotype. Data are shown as the mean±s.e.m. Analysis was performed using one-way ANOVA followed by Tukey's multiple comparison test. **P<0.01, ***P<0.005, ****P<0.001. Scale bars: 1 mm in B; 200 μm in D.
Fig. 4.
Fig. 4.
Distribution of Sertoli cells and germ cells in cKO mice. (A-F) Distribution of Sertoli cells (A,B) and germ cells (C–F) within the seminiferous tubule from 8-week-old WT and cKO mice. (A,B) The number of Sertoli cells marked with SOX9 immunoreactivity (red in A) per cross-sectioned seminiferous tubule was significantly decreased in cKO mice. (C,D) Relative cell density of spermatogonia positive for GFRα1, PLZF, LIN28A and KIT (red or green in C) compared with the number of SOX9+ Sertoli cells (A) were significantly larger in cKO mice compared with WT mice. (E,F) The numbers of cells positive for SCP3 and HSP70 (brown in E) per cross-sectioned seminiferous tubule were significantly smaller in cKO mice. (G) TUNEL-stained (green) testis section with anti-VASA or SOX9 immunohistochemistry (red in lower two panels) from WT and cKO mice at 8 weeks of age. (H) The number of TUNEL+ apoptotic cells per cross-sectioned seminiferous tubule was larger in cKO mice. (I,J) The number of CCND1+ proliferative cells (red in I) negative for GATA4 immunoreactivity (green in I) per seminiferous tubule cross-section was not significantly different between WT and cKO mice. In this analysis, we used paraffin-embedded samples to conserve the morphology of the samples, in which endogenous tdTomato in the mouse model were diminished and unobservable. n=3 for each genotype. Data are shown as the mean±s.e.m. Analysis was performed using one-way ANOVA followed by Tukey's multiple comparison test or unpaired Student's t-test. Small insets in A and C show magnification of the cells positive for each marker. Insets in I show the magnification of regions surrounded by broken rectangles. White arrowheads in C indicate the cells positive for each marker. *P<0.05, **P<0.01, ***P<0.005. Scale bars: 50 μm.
Fig. 5.
Fig. 5.
Size and density of PMCs were not different in WT and cKO mice, but the number of PMCs was increased in cKO mice. (A) Anti-αSMA immunohistochemistry (green) and tdTomato (red) in whole-mount seminiferous tubules from WT and cKO mice at 8 weeks of age. (B) Average surface area of the seminiferous tubules covered by a single PMC in WT, Het and cKO mice. (C) Number of PMCs per half circumference of seminiferous tubule in WT, Het and cKO mice. (D) Density of PMCs on the surface area of seminiferous tubules, shown as the number of PMCs per area of 10,000 µm2. n=3 for each genotype. (E) Anti-Ki67 immunohistochemistry (green) and RFP signal (red) in cryosections from WT and cKO mice at 1 week of age. (F) The proportion of Ki67+ proliferative smooth muscle cells was higher in cKO mice compared with WT mice. In this analysis, we visualized tdTomato with RFP immunoreactivity owing to the permeabilization process required for Ki67 staining, which diminishes the endogenous tdTomato. Data are shown as the mean±s.e.m. Analysis was performed using one-way ANOVA followed by Tukey's multiple comparison test (B-D) or unpaired Student's t-test (F). ***P<0.005, ****P<0.001. Right panels in A show the confocal image of PMCs from each genotype. In E, right upper panels labeled ‘PMC’ show the magnification of the regions surrounded by broken rectangles, and right lower panels labeled ‘bv’ show the magnified image of the blood vessels indicated with white arrows. Yellow arrowheads in E indicate smooth muscle cells positive for both Ki67 and RFP. Scale bars: 100 μm in left panels in A; 20 μm in right panels in A; 50 μm in E.
Fig. 6.
Fig. 6.
Hic1 deletion in testicular smooth muscle cells affects their morphology and functionality. (A) Immunohistochemistry of ECM proteins (red) in testis tissue sections from 8-week-old WT and cKO mice, showing hardly any fibronectin signal, with relatively strong collagen IV and LAMA1 signals in the basement membrane in cKO testes. (B) Transmission electron micrographs of 8-week-old WT and cKO mouse testes, showing the ultrastructure of PMCs together with the basement membrane in 8-week-old WT and cKO testis. BM, basement membrane; EC, endothelial cell. Stars indicate the accumulated lipid-like structures around the basement membrane. (C) Gene expression levels of Acta2 and Cnn1 in tdTomato+ cells sorted from 8-week-old WT and cKO mice. n=4 for WT, n=5 for cKO. Lower panels in A and B show the magnification of regions surrounded by broken rectangles, respectively. Analysis was performed using unpaired Student's t-test. *P<0.05, **P<0.01. Scale bars: 100 μm in A; 500 nm in B.

Similar articles

Cited by

References

    1. Agrimson K. S., Onken J., Mitchell D., Topping T. B., Chiarini-Garcia H., Hogarth C. A. and Griswold M. D. (2016). Characterizing the spermatogonial response to retinoic acid during the onset of spermatogenesis and following synchronization in the neonatal mouse testis. Biol. Reprod. 95, 81 10.1095/biolreprod.116.141770 - DOI - PMC - PubMed
    1. Akiyama S. K. (1996). Integrins in cell adhesion and signaling. Hum. Cell 9, 181-186. - PubMed
    1. Amrani Y. and Panettieri R. A. (2003). Airway smooth muscle: contraction and beyond. Int. J. Biochem. Cell. Biol. 35, 272-276. 10.1016/S1357-2725(02)00259-5 - DOI - PubMed
    1. Briones V. R., Chen S., Riegel A. T. and Lechleider R. J. (2006). Mechanism of fibroblast growth factor-binding protein 1 repression by TGF-β. Biochem. Biophys. Res. Commun. 345, 595-601. 10.1016/j.bbrc.2006.04.052 - DOI - PubMed
    1. Brozovich F. V., Nicholson C. J., Degen C. V., Gao Y. Z., Aggarwal M. and Morgan K. G. (2016). Mechanisms of vascular smooth muscle contraction and the basis for pharmacologic treatment of smooth muscle disorders. Pharmacol. Rev. 68, 476-532. 10.1124/pr.115.010652 - DOI - PMC - PubMed

Publication types

MeSH terms